-
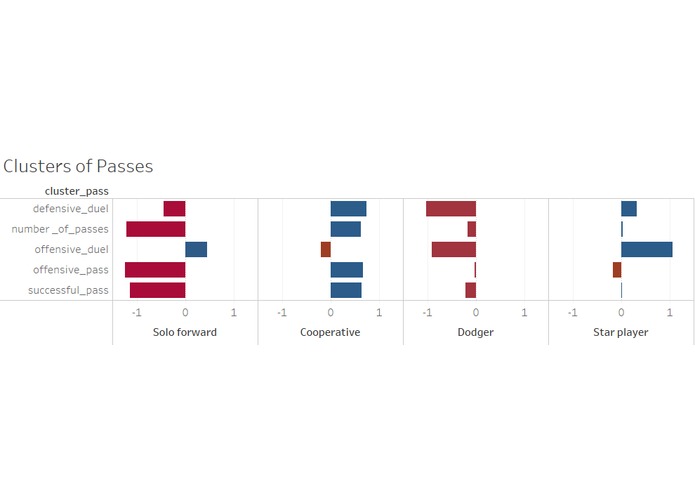
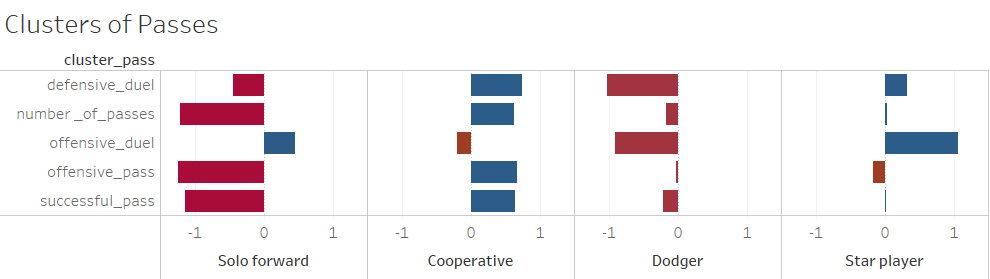
Fig1 - Clusters of Passes
-
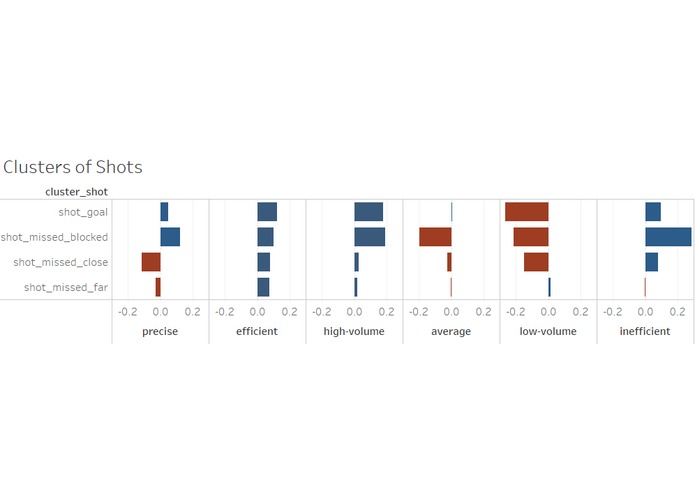
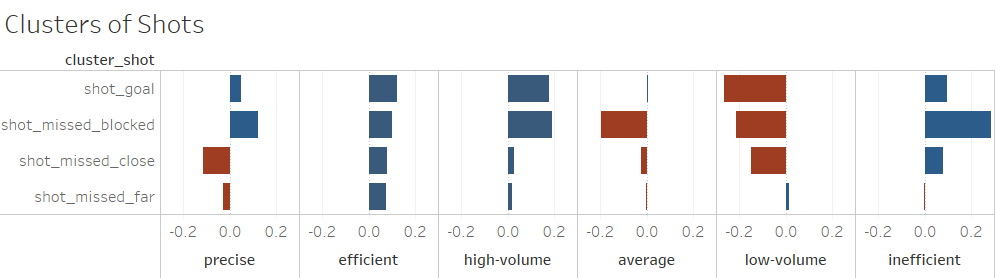
Fig2 - Clusters of Shots
-
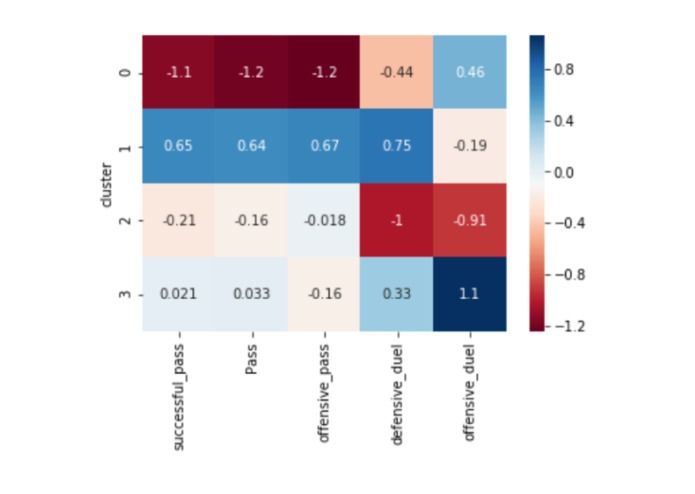
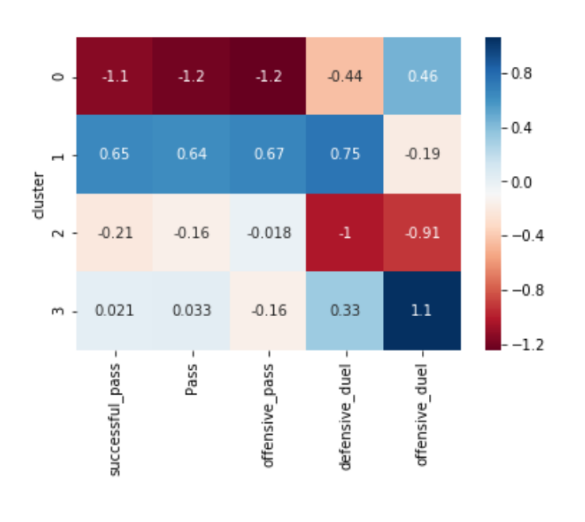
Fig3 - Cluster Heatmap of Passes
-
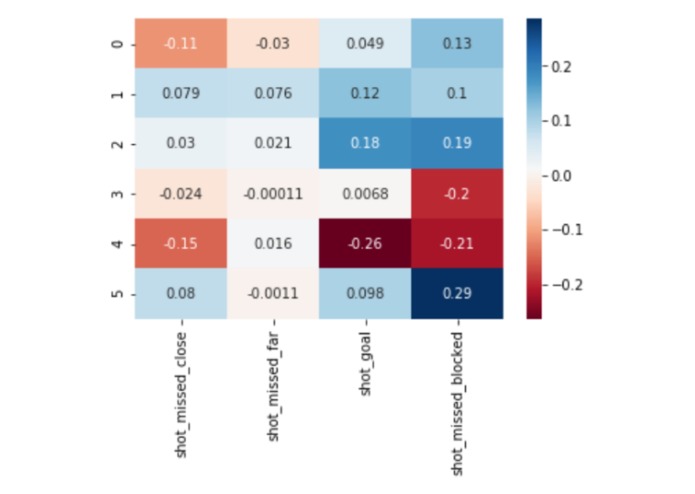
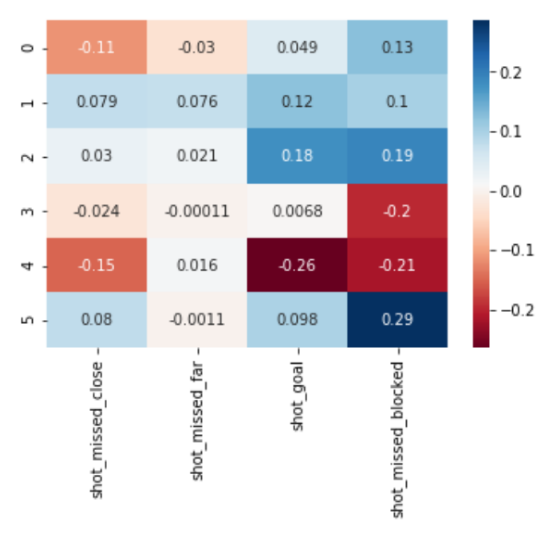
Fig4 - Cluster Heatmap of Shots
Problem Statement
Although ELO based rating systems currently used by U.S. soccer are excellent at quantifying team skill based on win %, they fail to deliver an understanding on the specific strengths of a team and their contributing factors. Additionally it is often hard to determine purely from historical matches whether a match loss was due to a team performing below their potential or whether an opposing team was simply technically superior. We wanted to explore whether there were alternative ways to quantify player skill and represent a team as an aggregate of its individual players, when accounting for both player skill and synergy across players.
Proposed Solution
Overview
Our approach revolved around applying unsupervised and supervised modeling methods that would give insight into the playstyle of a team and then determine how that style performed against other ones. Ultimately we combined several clustering models for shots on goals, passes, and other ball control metrics of players, and used those clusters to create a team profile and build a boosted tree classifier that predicts match outcome.
Detailed approach
For the project we focused our attention on the MLS full dataset. Any similar set can be used for the method as long as the data is representative of all the matches played by the involved players and contains enough granularity.
The underlying assumption for the data and our approach is that each player for the most part has a consistent style or strength in their play. We use player level data to represent a team as a whole.
We started by filtering out features that were irrelevant to our analysis or that had a low enough frequency count (<1%); we considered such features to describe either rare events or to be of no interest. We then grouped features through the use of subject knowledge while referencing the given data dictionary into categories that represented the associated activity. Some examples of our categories included "passes", "shots", "goalkeeper", "fouls, cards, penalties", "match conditions" (e.g. weather), and a few others. Given these categories we performed some preliminary EDA and analyzed whether the features within these categories were valid candidates for our analysis. After performing principal component analysis (PCA) on several categories to get a sense of the data heterogeneity within our groups we decided to focus on "passes" and "shots", since all player actions involving the ball can be bucketed into these two categories.
After selecting our feature space of interest we feature engineered new covariates pertaining to these categories by aggregating the data to a player level within a match. Our features were either computed by considering rules based on x,y coordinates of the associated activity or through aggregation functions like counts and averages of originally given features.
In the case of shots on goals, we determined the quality of the shot based on how accurate the shot was, without taking into account if it was blocked or not. Here we specifically wanted to distinguish between the quality of the shot and the defense’s efforts to mitigate a goal. To accomplish this, we aggregated different “pass” features into four features: Shot missed close: Shots missed, by a small margin from the goal. Shot missed far: Shots that were far away from the goal. Shot goal: Shots that resulted in goals. Shot missed block: Shots on goal that were either blocked by the goalkeeper or hit the goal post.
For passes, after all the aggregation we arrived at 7 metrics: total, successful/unsuccessful, offensive/defensive, offensive duels, defensive duels. Cross, assists, launch, through_ball, 2nd assists were considered as offensive passes because they convey a team’s intent of moving the game forward. But there can be other passes outside of these categories that can be attacking. We looked at the x coordinates of the starting and ending point of the passes and an aggressive pass was categorized by the x coordinate of the ending point of the pass being greater than the x coordinate of the starting point, meaning that the ball is moving forward, and the opposite for a defensive pass. We also looked at the number of offensive and defensive duels completed by a player in a game, indicating their intention and skill in the game.
Given our two sets of features for passes and shots we applied multiple clustering models. We tried using archetype analysis to map the extreme values that span the convex hull around the dataset. The reasoning behind archetype analysis is that it finds the ideal styles (e.g. 100% aggressive) and maps all other data points as being a linear combination of the ideal styles. However, further investigation yielded better luck in using centroid based clustering methods (like GMM) to determine clusters based on similarity between player styles.
Clustering the teams based on the shots on goals features (shown in Figures 1 and 2) resulted in six well defined clusters after looking at the optimal point in the silhouette plots. These are defined below: -Precise -Efficient -High-volume -Average -Low-volume -Inefficient
We identified 4 clusters as being the optimal solution for the category of passes. Immediately clear, intuitive styles emerged from the clusters:
- “Solo Forwards” - represented by overly aggressive players, with high offensive activity and low defensive metrics
- “Cooperative” - represented by players with strong ball control and a well-balanced style
- “Dodger” - players avoiding opposing confrontation and focusing on supportive passing
- “Star player” - players demonstrating solid ball control and excellent offensive initiative due to all metrics falling in the average or above average range, but offensive duel count being exceptionally high.
Although the clustering results were promising enough as is, of further interest would be to see if the clusters yielded predictive power as well. Given the clusters a player belonged to in terms of shots and passes, a team within a match is represented by a vector of the number of players in different clusters. We built a boosted tree classifier using the team vector representations as features and the match outcome (win, loss, draw) as response. The fine-tuned xgboost model yielded cross-validated 43% accuracy (30% improvement over baseline), which is sufficiently above baseline guessing to have predictive value.
Future Improvements
Our methodology showcased a novel approach of quantifying players and teams, but there is strong room for improvement. Most of the work would involve revisiting our feature engineering and discussing with a subject matter expert (SME) the validity of certain assumptions behind the labeling in the data dictionary. Not only fine-tuning the features within the shots and passes category, but also adding additional categories (e.g. “defensive actions” to hold activities like “interception”, “concealment”, etc.)
Having more robust features would improve the quality of the clustering and open up to deeper insights in terms of characterizing the clusters to a particular style. When using PCA we saw that many of the original features from the MLS dataset were orthogonal to each other, which is usually a desired property in highly predictive models. However, in the case of style identification through the use of clustering, having too many dimensions dilutes the interpretability of clustering. Finding an appropriate way for dimensionality reduction while still retaining meaningful styles was a strong concern of ours. For future project iterations we would look into strengthening the foundation that is feature aggregation and selection.


Log in or sign up for Devpost to join the conversation.