-
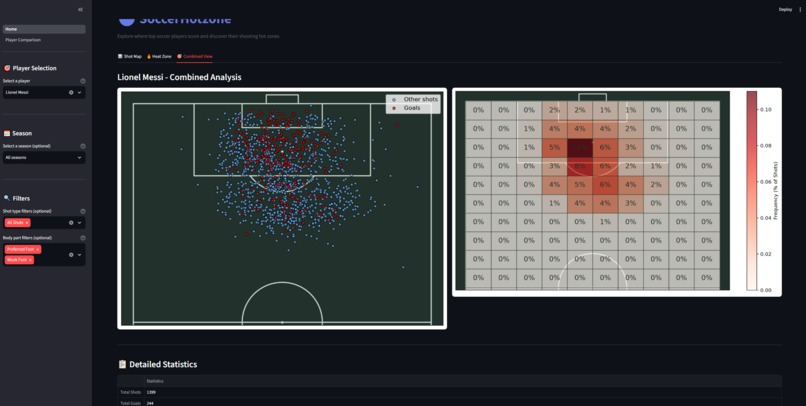
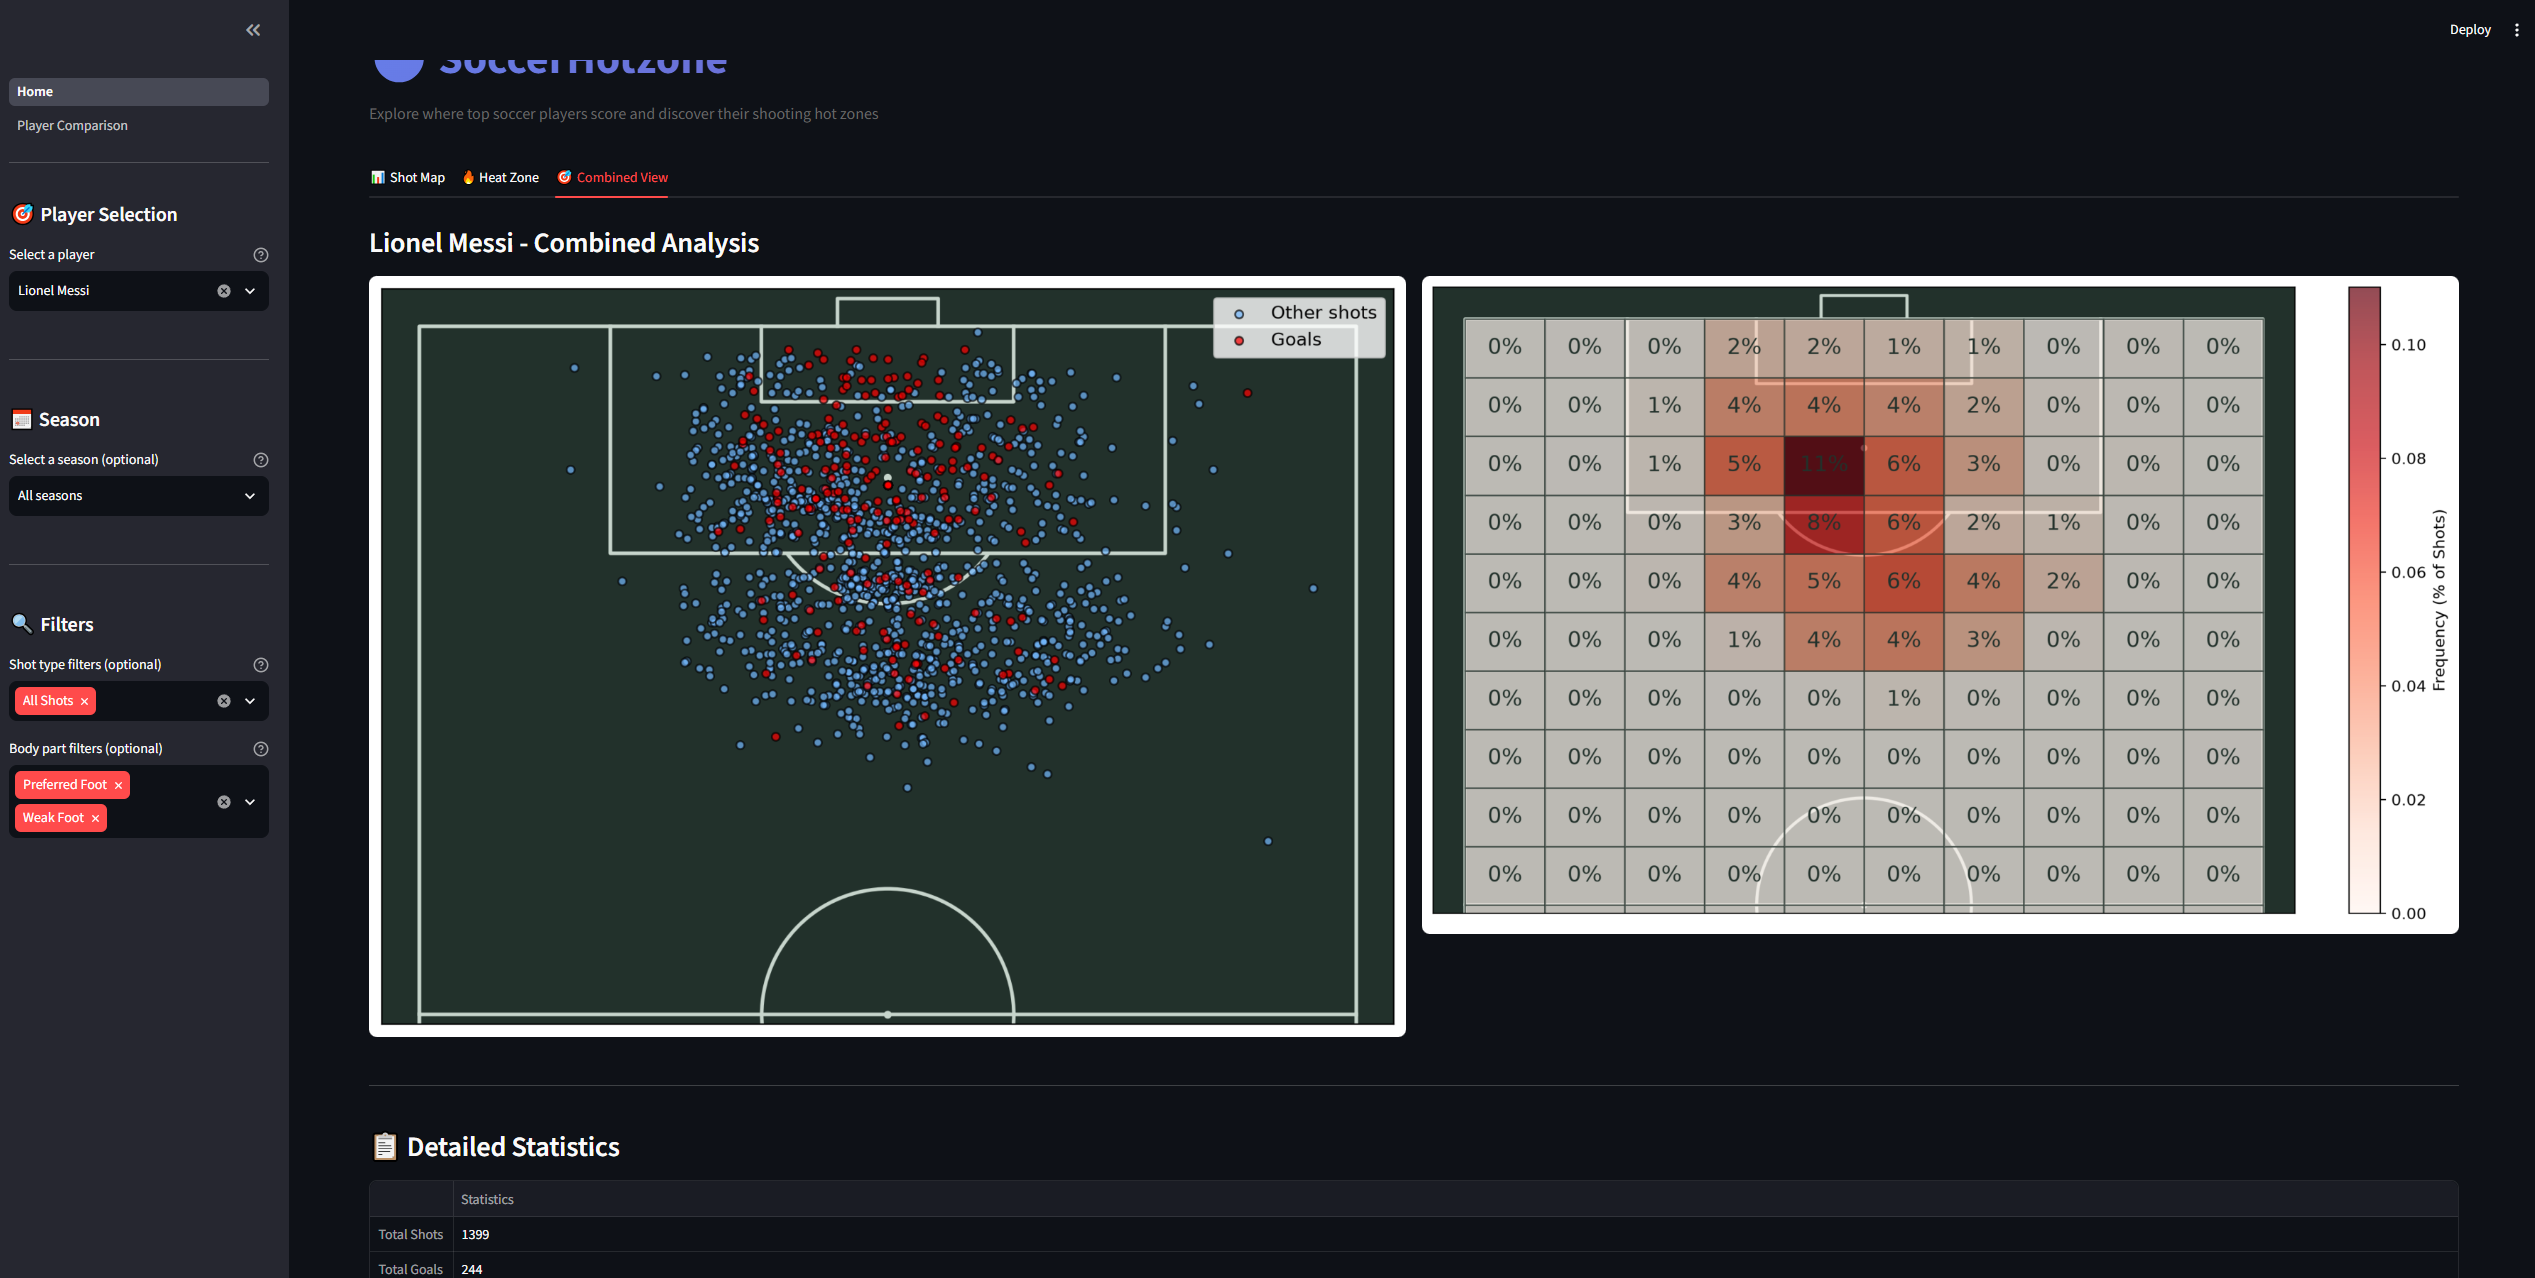
Messi All Shots Scatterplot and Heatmap
-
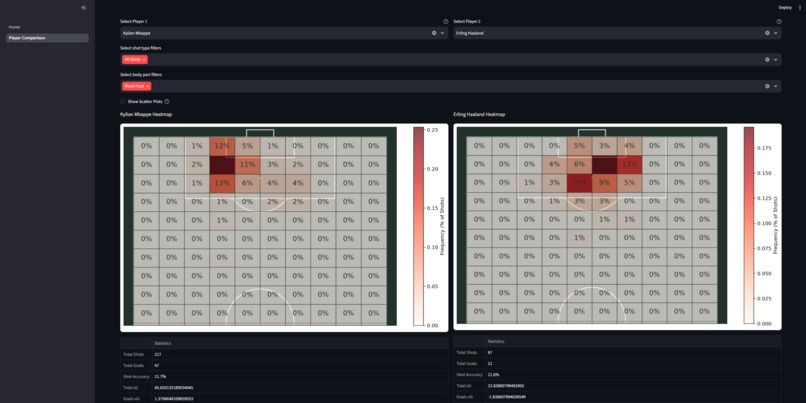
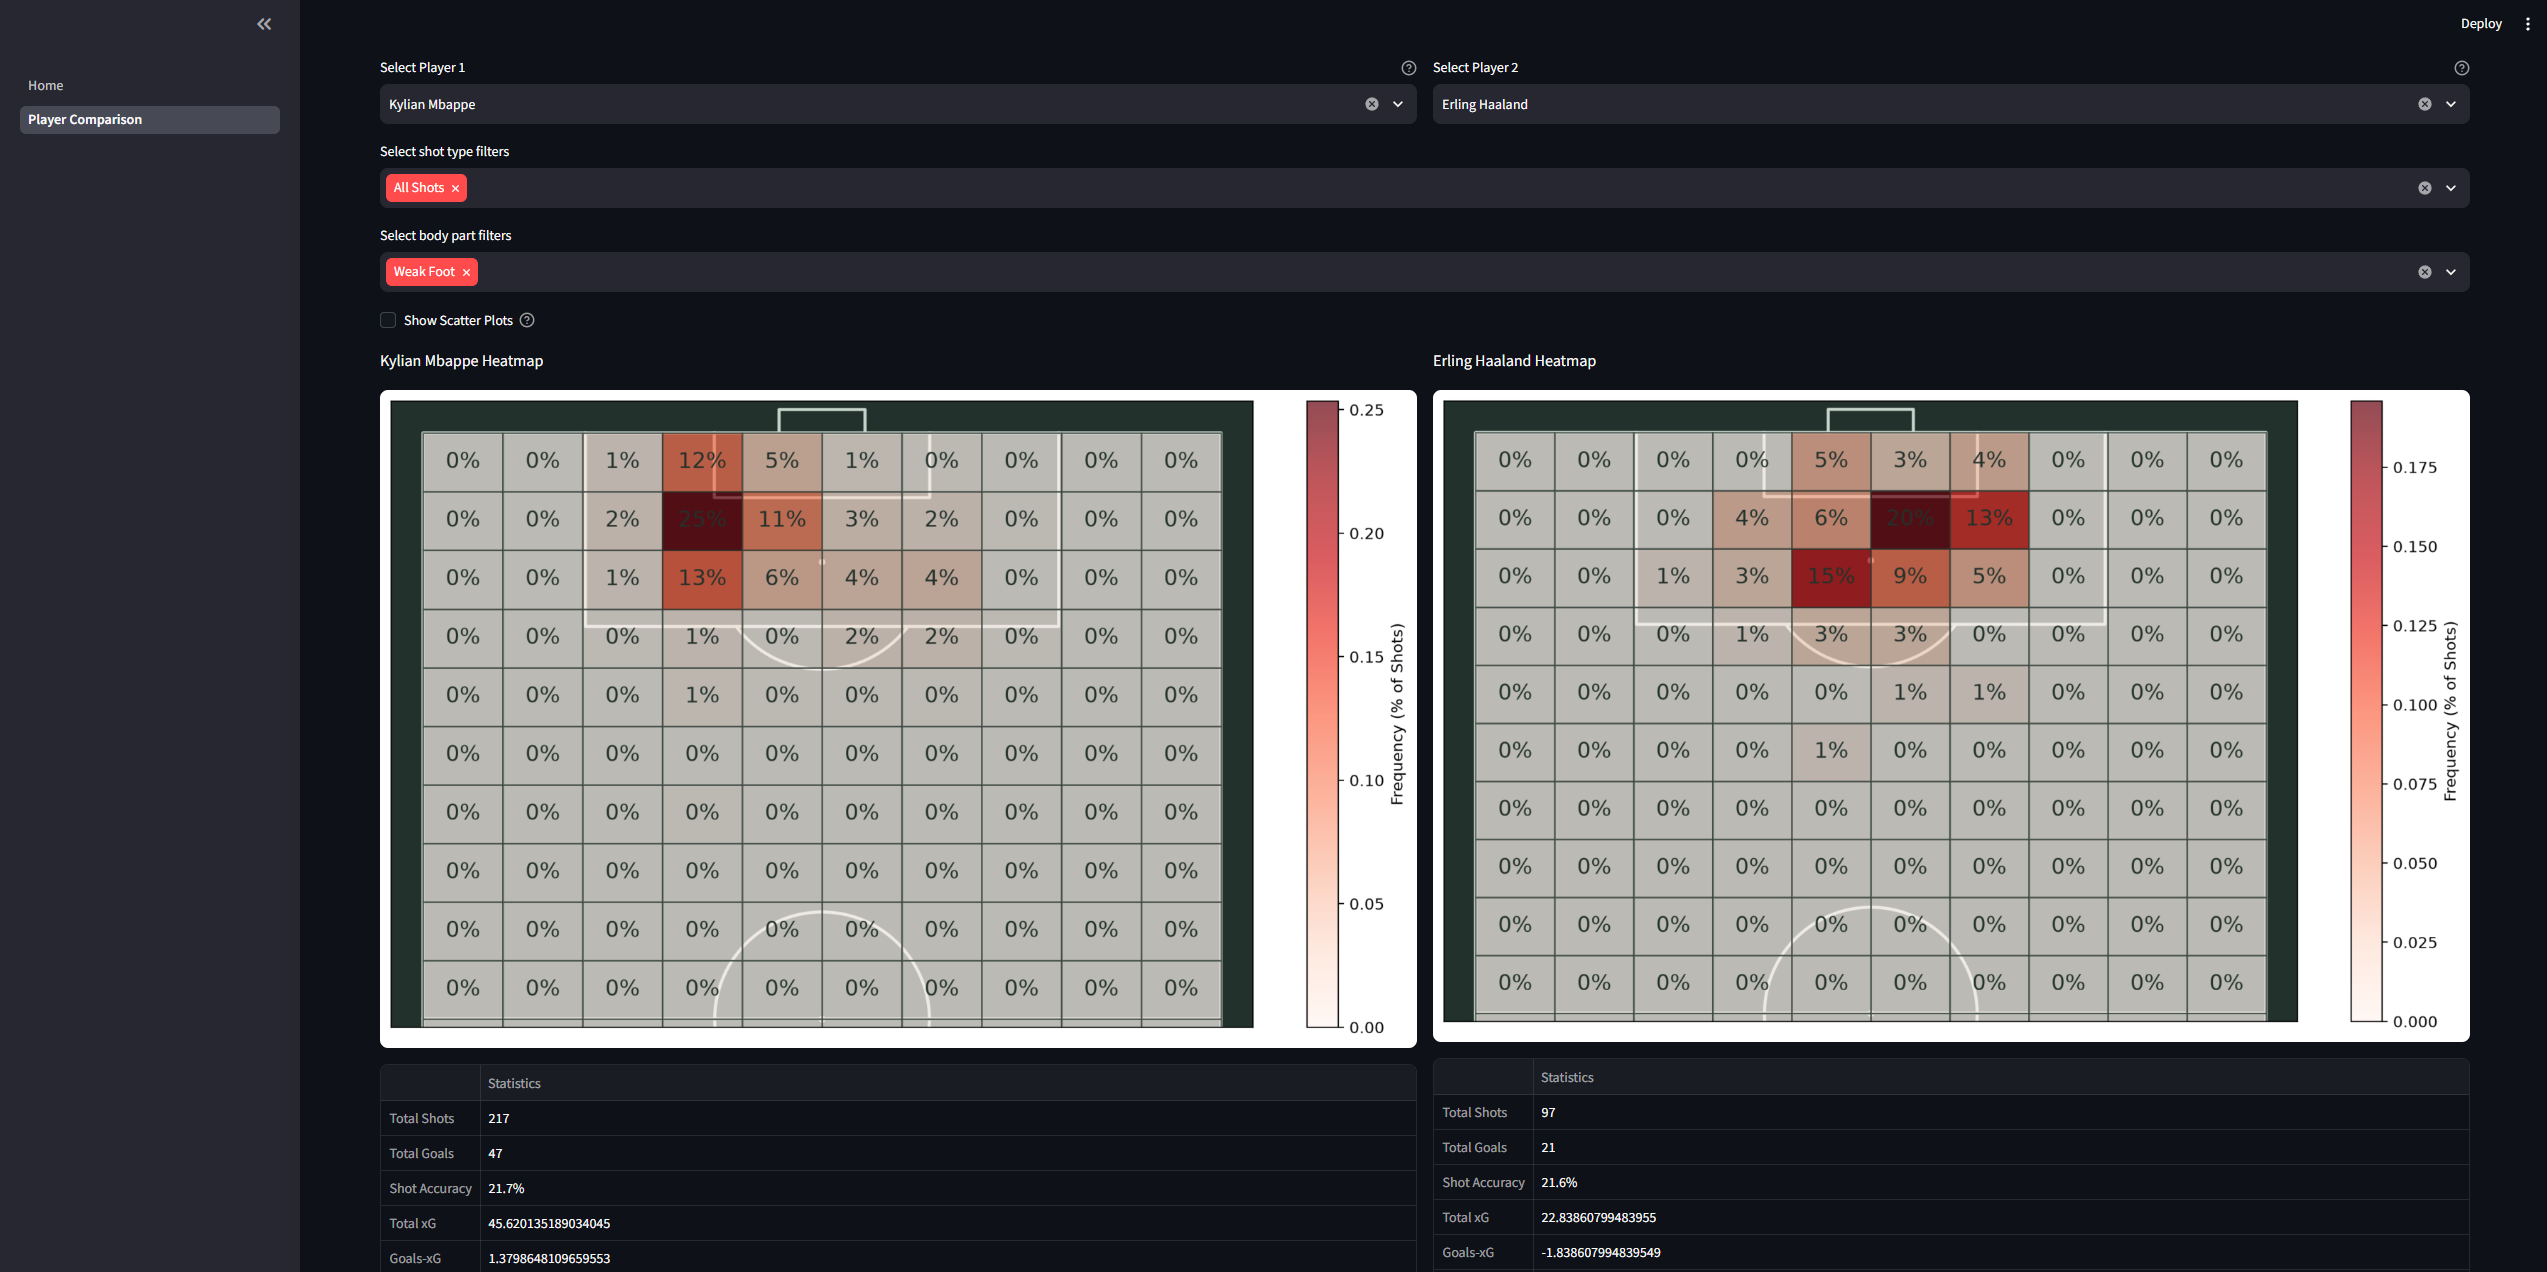
Mbappe vs Haaland All Weak Foot Shots
Inspiration
Due to the numerous ways that players can score in soccer, I wanted to build an application that visualizes where some of the best goal scorers are most dangerous from, where they prefer to take shots and their preferences for the type of shots that they take.
What it does
Soccer Hotzones examines 20 of the best goalscorers in the European top 5 leagues (Premier League, La Liga, Serie A, Ligue 1, Bundesliga) player shots, starting from the 2014/15 to 2025/26 and allows users to view the distribution of the shot histories. It processes the outcomes of each and every shot the player took, the location of the shot, and the outcomes to determine where a player is most effective when shooting the ball, as well as what types of shots they excel at. Users can then view either a scatterplot showing all the locations from which a player takes shots/goals, or a heatmap displaying the distribution of the zones where they prefer to take shots.
How I built it
I built it utilizing Streamlit for the frontend, mplsoccer to build the scatterplots and heatmaps, with data coming from Understat.
Challenges we ran into
The main challenge that I ran into was collecting shot data for the players. Due to the lack of open soccer data available online (unless you want to pay for it), collecting shot data was difficult. I overcame this challenge by scraping Understat, a popular football analytics website that provides advanced statistical data to get the data I needed.
What I learned
During the course of building this project, I learned about web-scraping techniques to collect data that can be used in a variety of ways. I also learned about some of the challenges that can occur when scraping, such as rate-limiting and some of the ways to combat them by using a proxy, changing headers that you send in a request or simply waiting a period of time inbetween requests.
What's next for Soccer HotZones
The next step for Soccer HotZones would be to expand player coverage, allowing users to make more meaningful comparisons between players. I would also add league-based comparisons, showing how a player's finishing performance compares to the average player in their league during the same period. This would allow users to see how a player ranks among the league's top finishers and provide more context for evaluating their performance.
Built With
- mplsoccer
- python
- streamlit
- understat
