-

Demo overview - introduction
-

Demo overview - explore the data
-

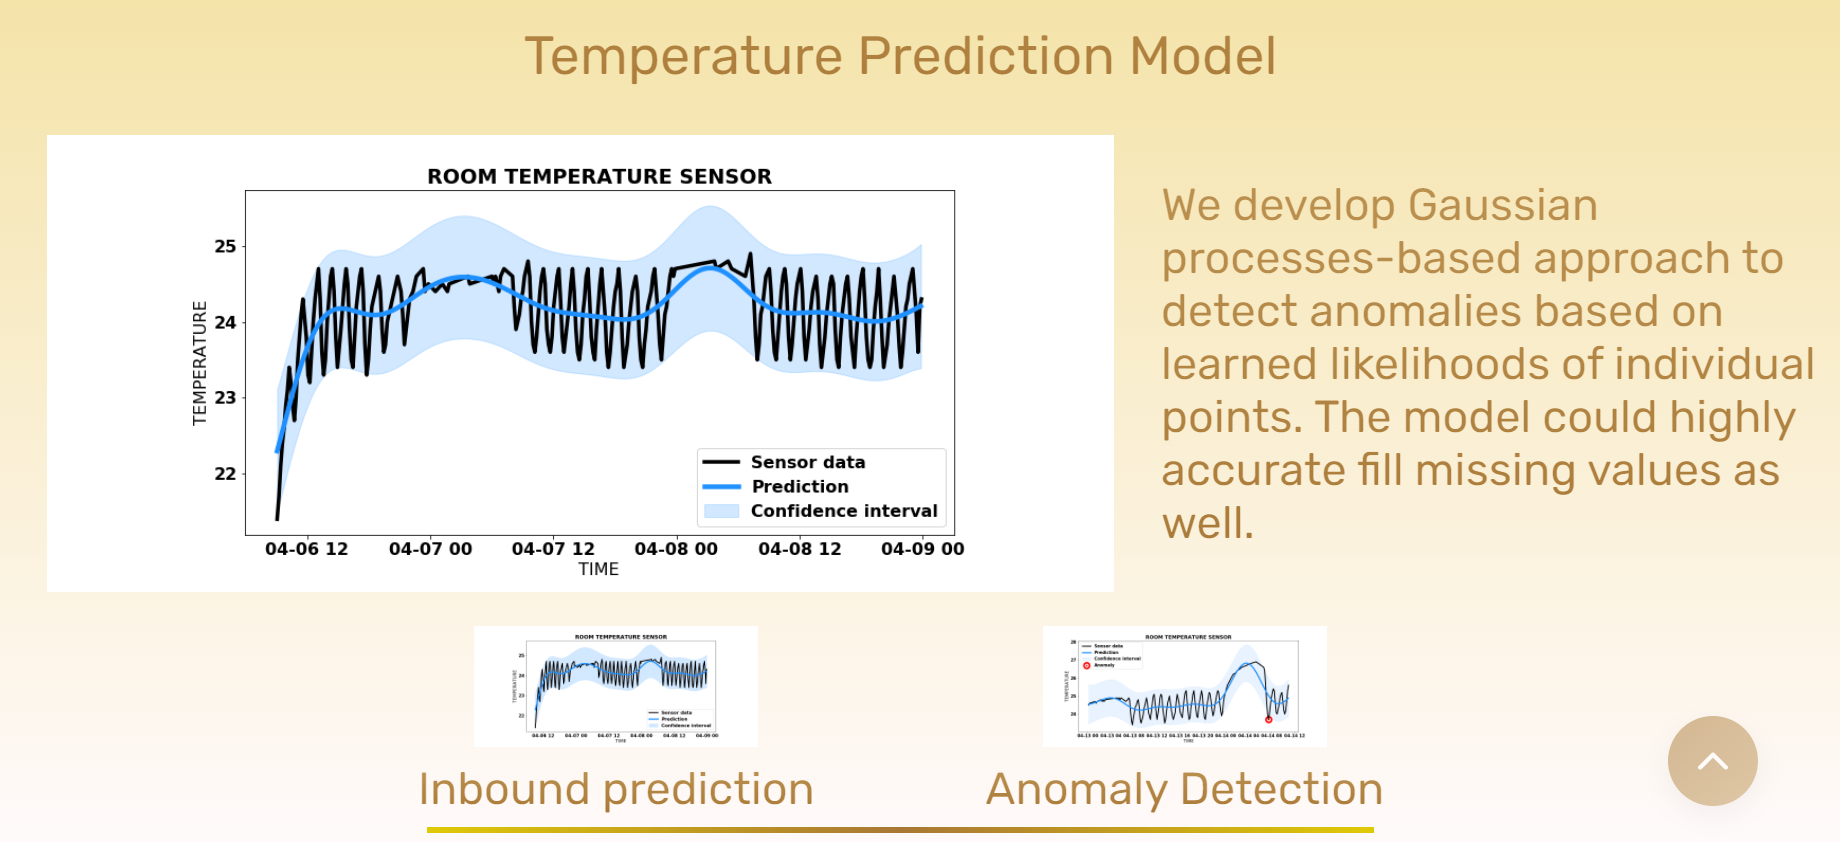
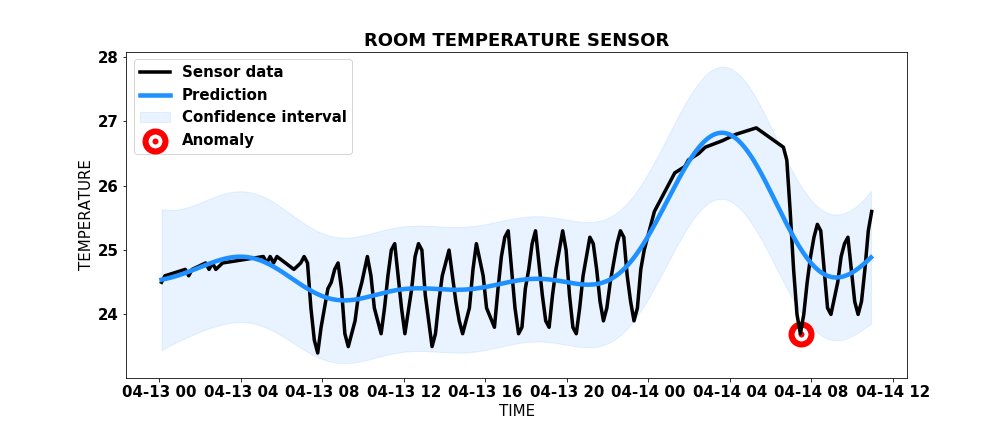
Demo overview - prediction model
-

Demo overview - our team
-

Microscope with sensors
-

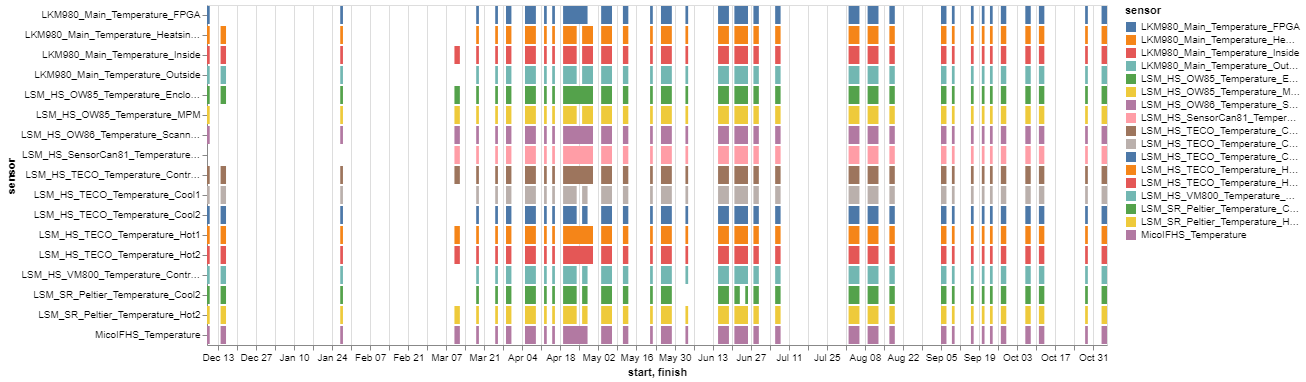
Four regions of measurements
-

Example of measurements
-

Illustration of anomaly prediction, missing values handing and forecasting
-

Logo of the team


Inspiration
We are the joined team of international students located in Germany and Belgium who learned the true beauty of good beer and are ready to fight for it!
With three Data Scientists and one Front-End developer in our team, we chose the ZEISS challenge without hesitations. It was the best way to apply our data analysis skills to real-life issues and present results in the shape of a real demo.
We never heard about microscopes application in the brewery, so the pitch early caught our attention. Also, data in the shape of time series were the final weight to say “yes!” to the ZEISS!
What it does
Our solution contains two types of results.
The first - more theoretical, is obtained from manual data analysis and visualization. We dedicated a lot of time exploring the domain knowledge and used this information to treat our data properly. It allowed us to see some patterns in data, better understand its weaknesses, and make particular conclusions. Those results are presented in our slides.
The second type of result is more practical and has the shape of the demo. We provided our solutions for several machine learning tasks hidden in the data: anomaly detection, missing values, and forecasting. Using a simple interface, anyone can see our outputs for those tasks. This demo also has some information about the task and our team!
How we built it
As true Data Scientists, we started with data exploration. Due to the specific domain of the data origin, we spent some time reading documentation and deeply understood the problem. One team member dedicated herself to data analysis entirely, and there is a lot for her to say!
Meanwhile, other team members were preparing models for anomaly detection, the template for the future demo, and many illustrations to use further in the presentation and demo. Both main outputs - slides, and demo, were prepared simultaneously during the hacking.
To build machine learning models, we used Python with all corresponding ML packages (scikit-learn, pandas, statsmodels, numpy, matplotlib, altair). For the demo, we used html, css, and js.
Challenges we ran into
The real challenge for us was data understanding. Thanks to the great documentation provided by ZEISS, we were able to distinguish different weird sensors' names from each other and understand their roles. We also spent some time clarifying the time slots presented in the data, for example, that seed needs from 2 to 20 days to germinate.
Also, we thought a while about how to present our results, what should be on the platform and what - only on the slides.
The most technically challenging part was machine learning models building and tuning, but this is our job, right?
Accomplishments that we're proud of and what we learned
We were delighted to dive into the details of the brewery process and receive new domain knowledge in the field that is new for us. We are proud that we dug through the data and built quality machine learning models for various tasks. We feel the same about our handy demo and creative illustrations!
Probably, the most important take-home message for our team is that you should never doubt yourself and never be afraid of something new! Because you never know which cool opportunities are waiting for you after the turn!
What's next for the SOB team
We faced a lot of issues with input data. But issues mean challenges! The next challenges definitely should be related to splitting data into stable regions and using them for fitting prediction models. An alternative way for investigation is to synchronize sensors measurements from different sensors related to the certain microscope and come up with multi-sensor models for future state prediction.
But of course - the sky is the limit!


Log in or sign up for Devpost to join the conversation.