Inspiration
Our Inspiration is to provide valuable metrics that can help Data Scientists evaluate and predict fires across the USA. We're firm believers that the data is out there and just needs to be aggregated. We believe adding features like this will radically improve predictions and help us create measures for these outbreaks.
What it does
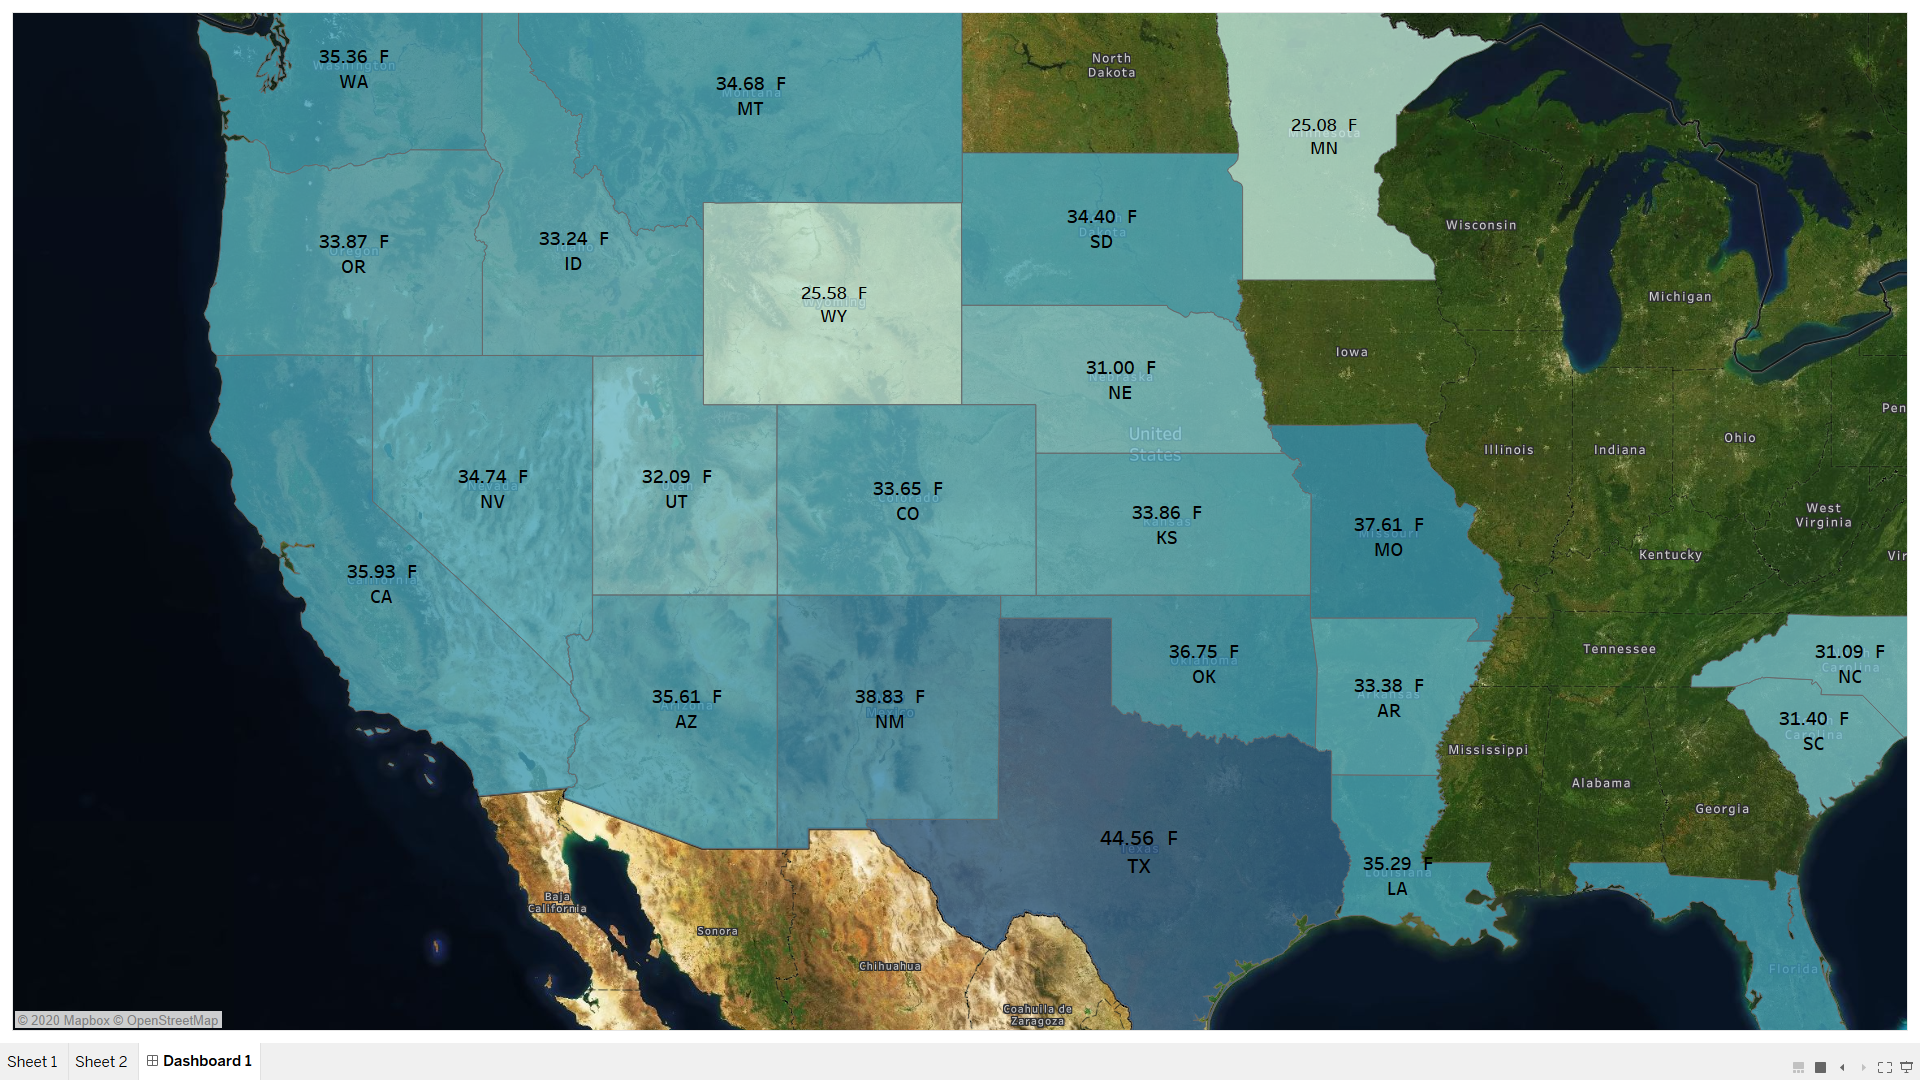
We Aggregated Data Across Multiple Datasets and Ran a few models to predict fire spread for certain Longitudes, Latitude. We Visualized our data using Tableau
How we built it
We used Python, Weather API, and datasets across the internet and visualized Tableau
Challenges we ran into mostly were caused by Access to Data, We spent an enormous amount of time getting historical weather data to concatenate with our original Dataset. We spent the time after that parsing through different jsons, joining tables and cleaning our data to be ready for our model.
Most Challenging bit of our Challenge was
Accomplishments that we're proud of
We didn't really use data that was pre-made. It felt like a real data Science project where we created our own data and that through hacks.
What we learned
We learned how difficult access to certain data is. We learned how we can still make the best out of a situation even if there are restrictions by iterating.
What's next for SNN(Save Nature Now)
Getting Access to More Data and Aggregating it!
Built With
- jupyter
- kaggle
- pandas
- python
- scikit-learn
- sklearn
- tableau
- tensorflow
- weather-api


Log in or sign up for Devpost to join the conversation.