-
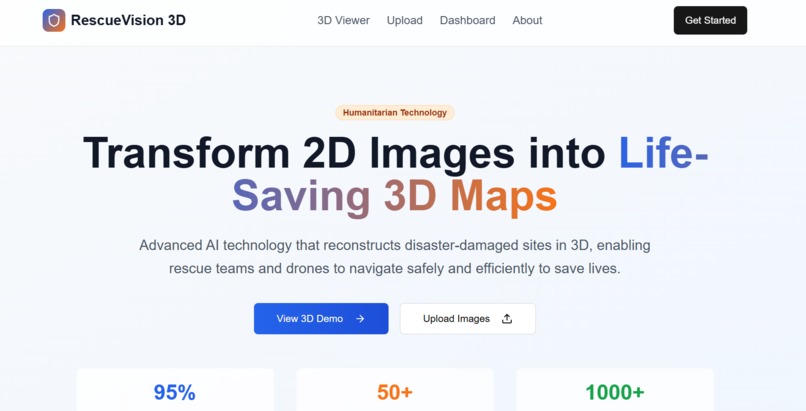
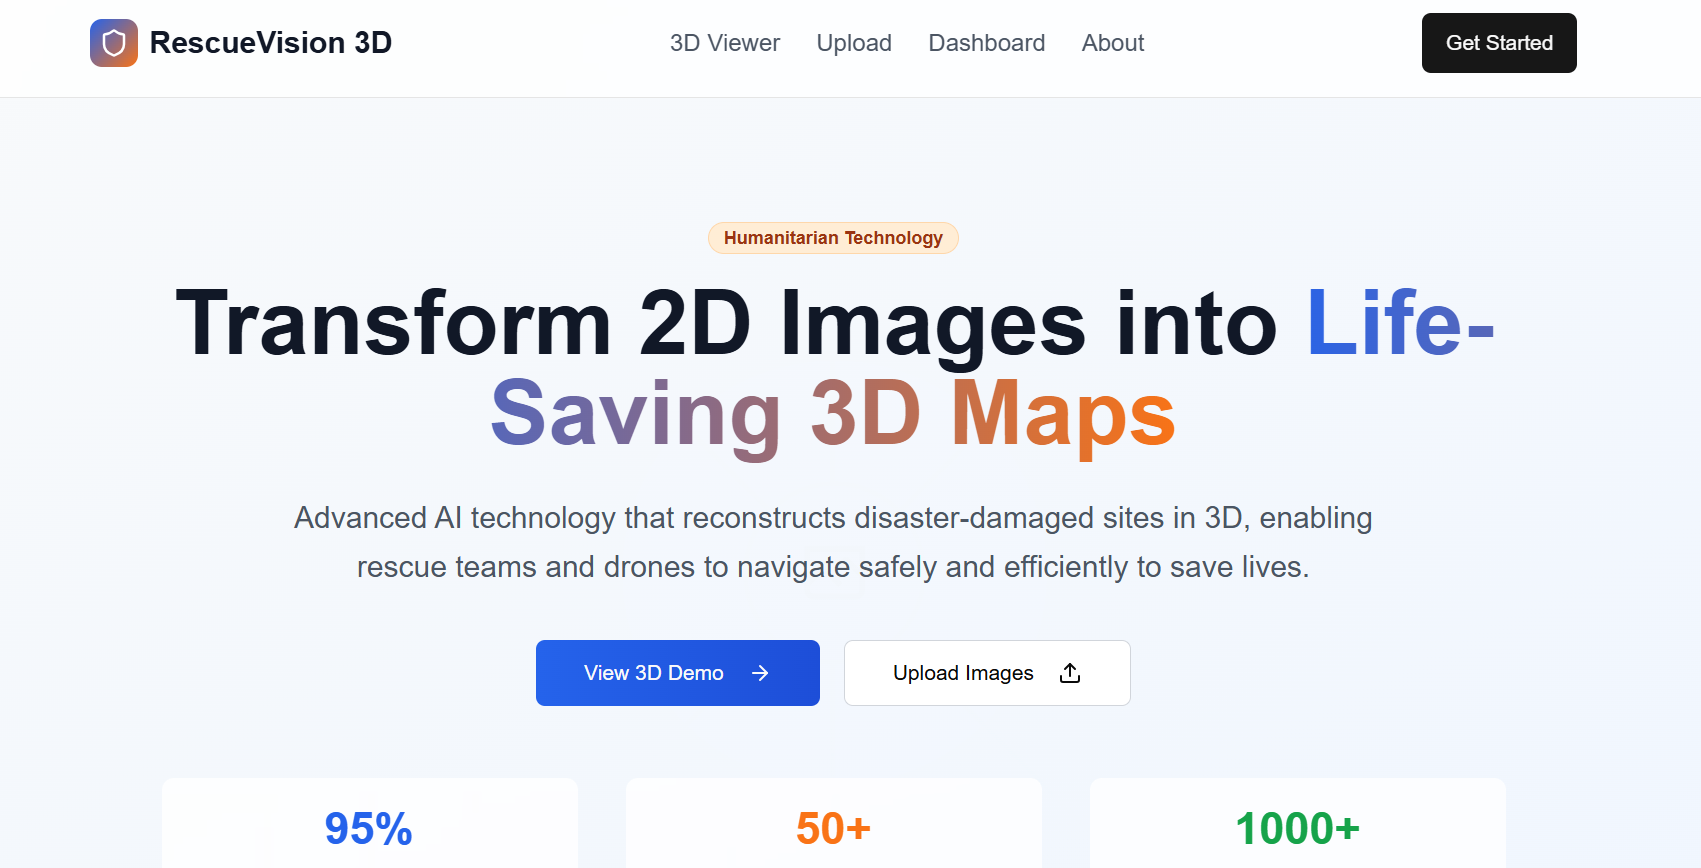
Our 2d website
-
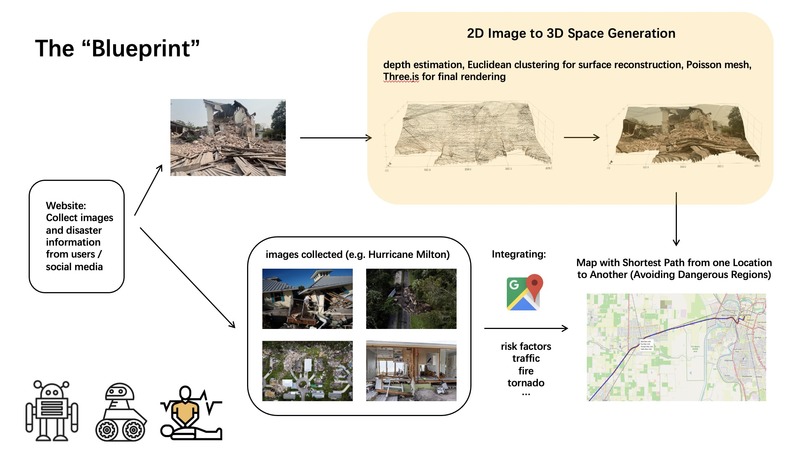
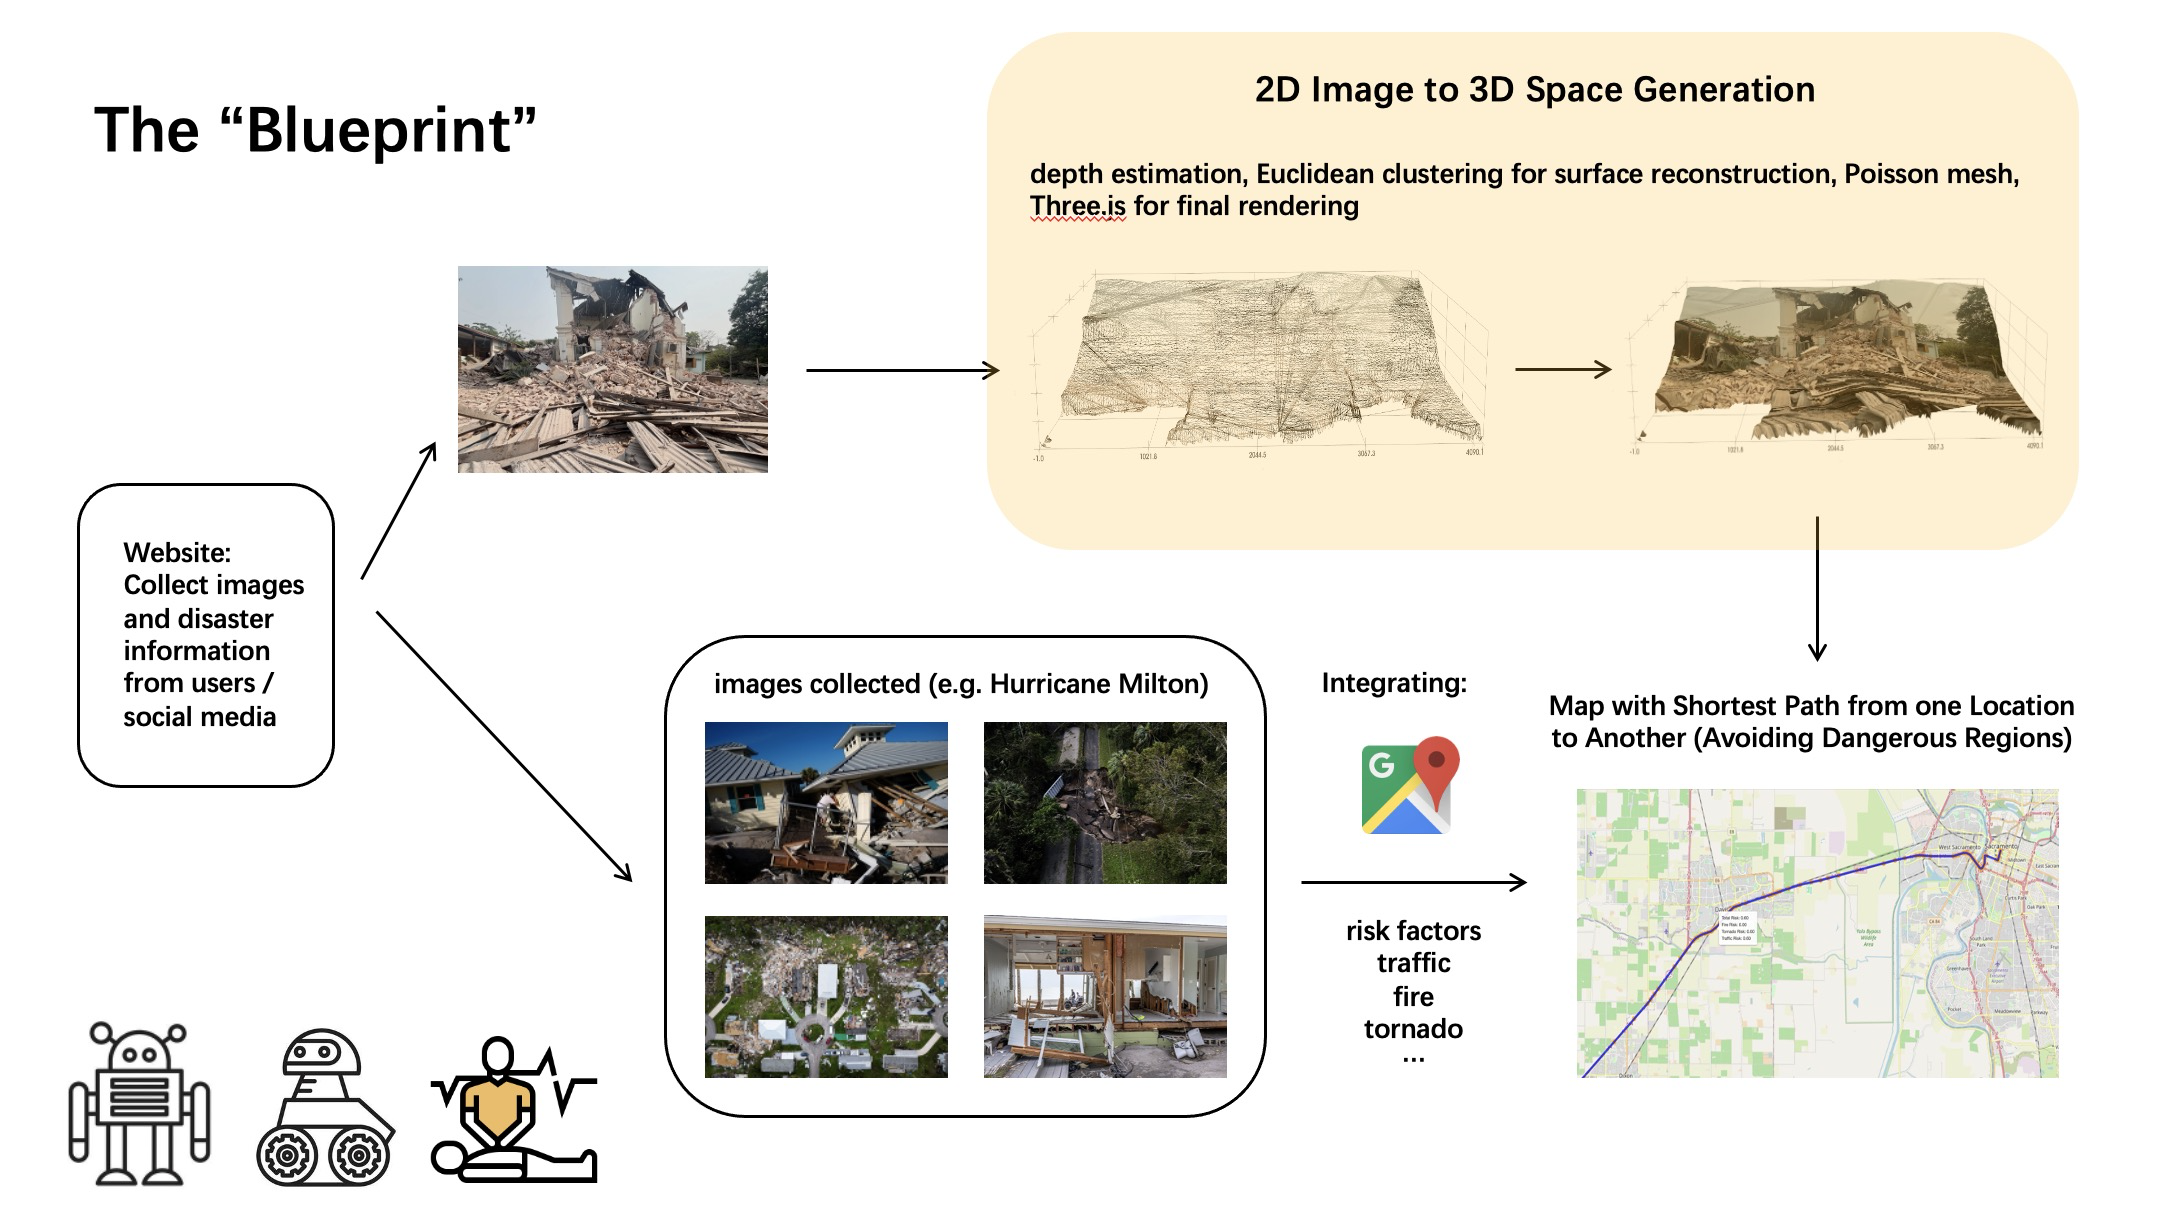
The "blueprint" of our project
-
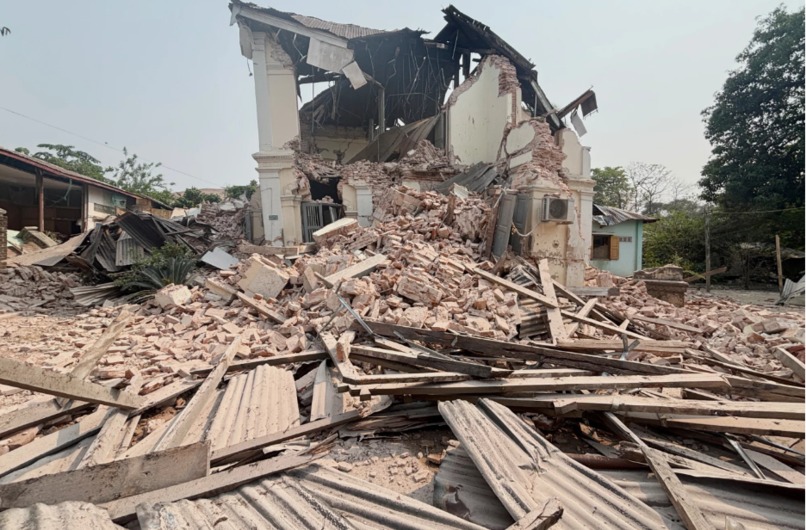
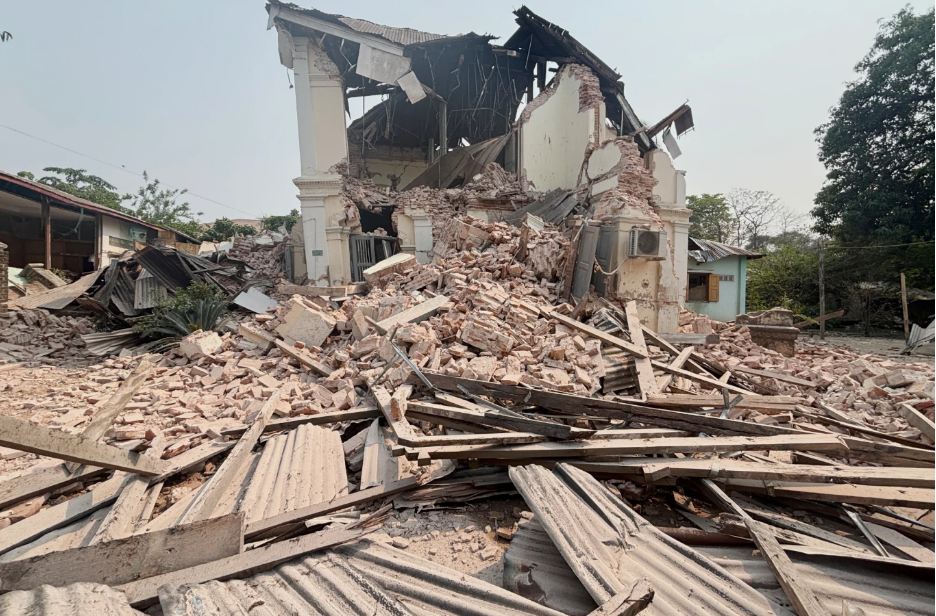
Original 2D image of ruins
-
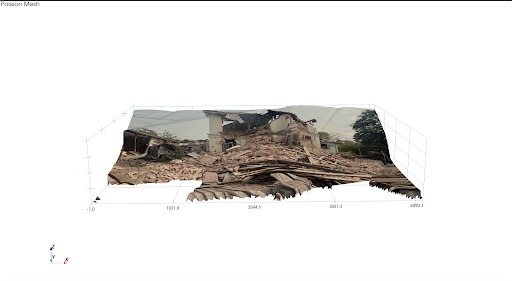
3D Rendering of image 1
-
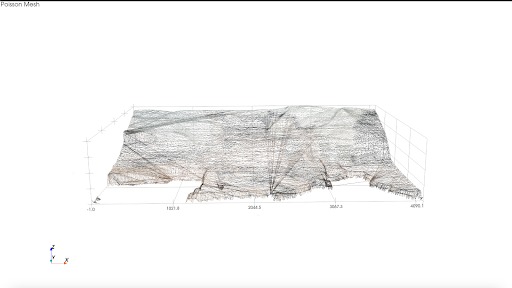
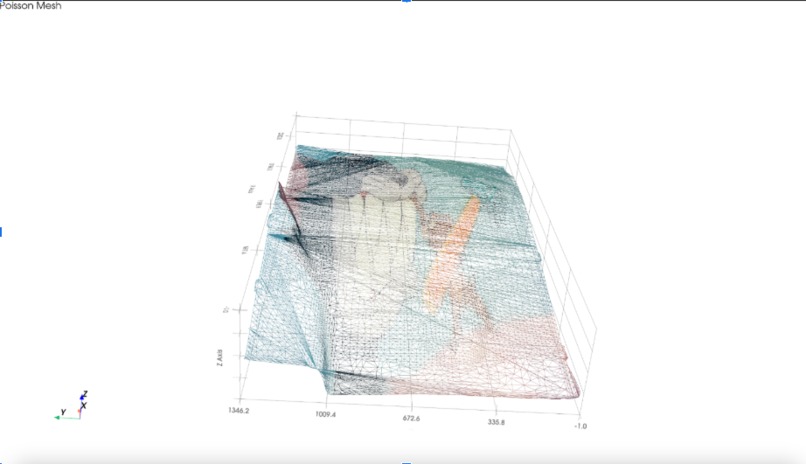
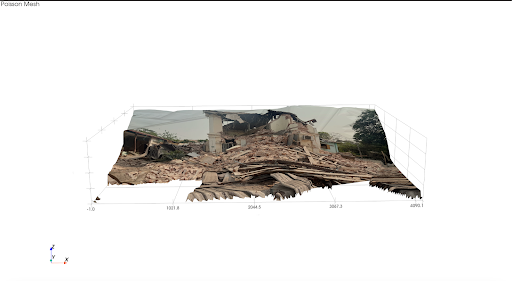
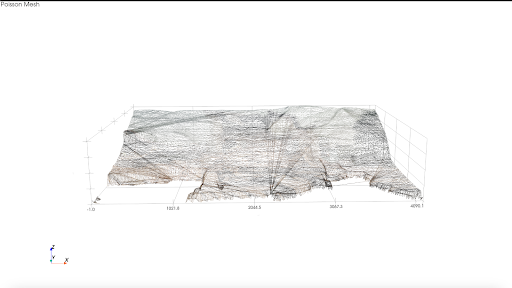
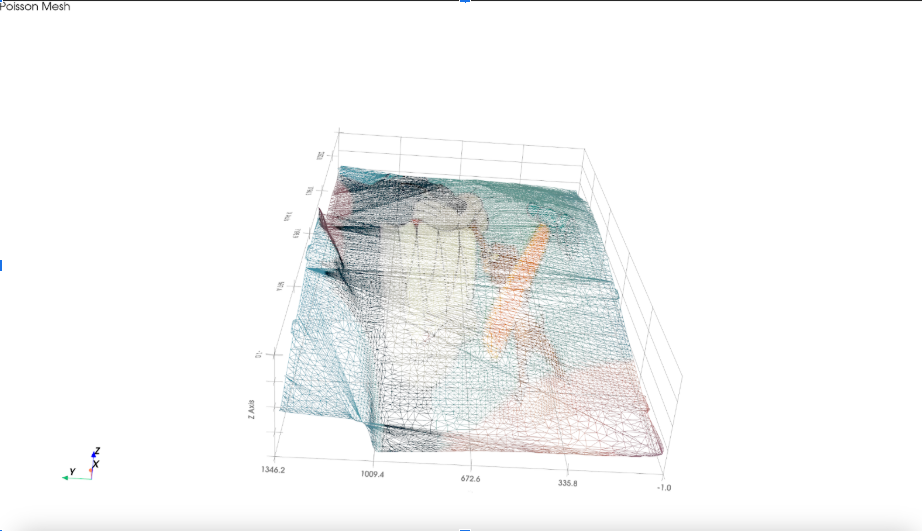
Poisson meshing of 3D image
-

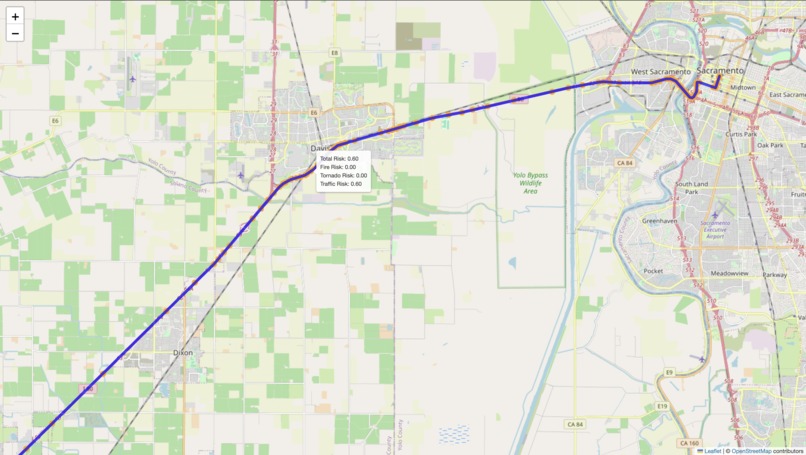
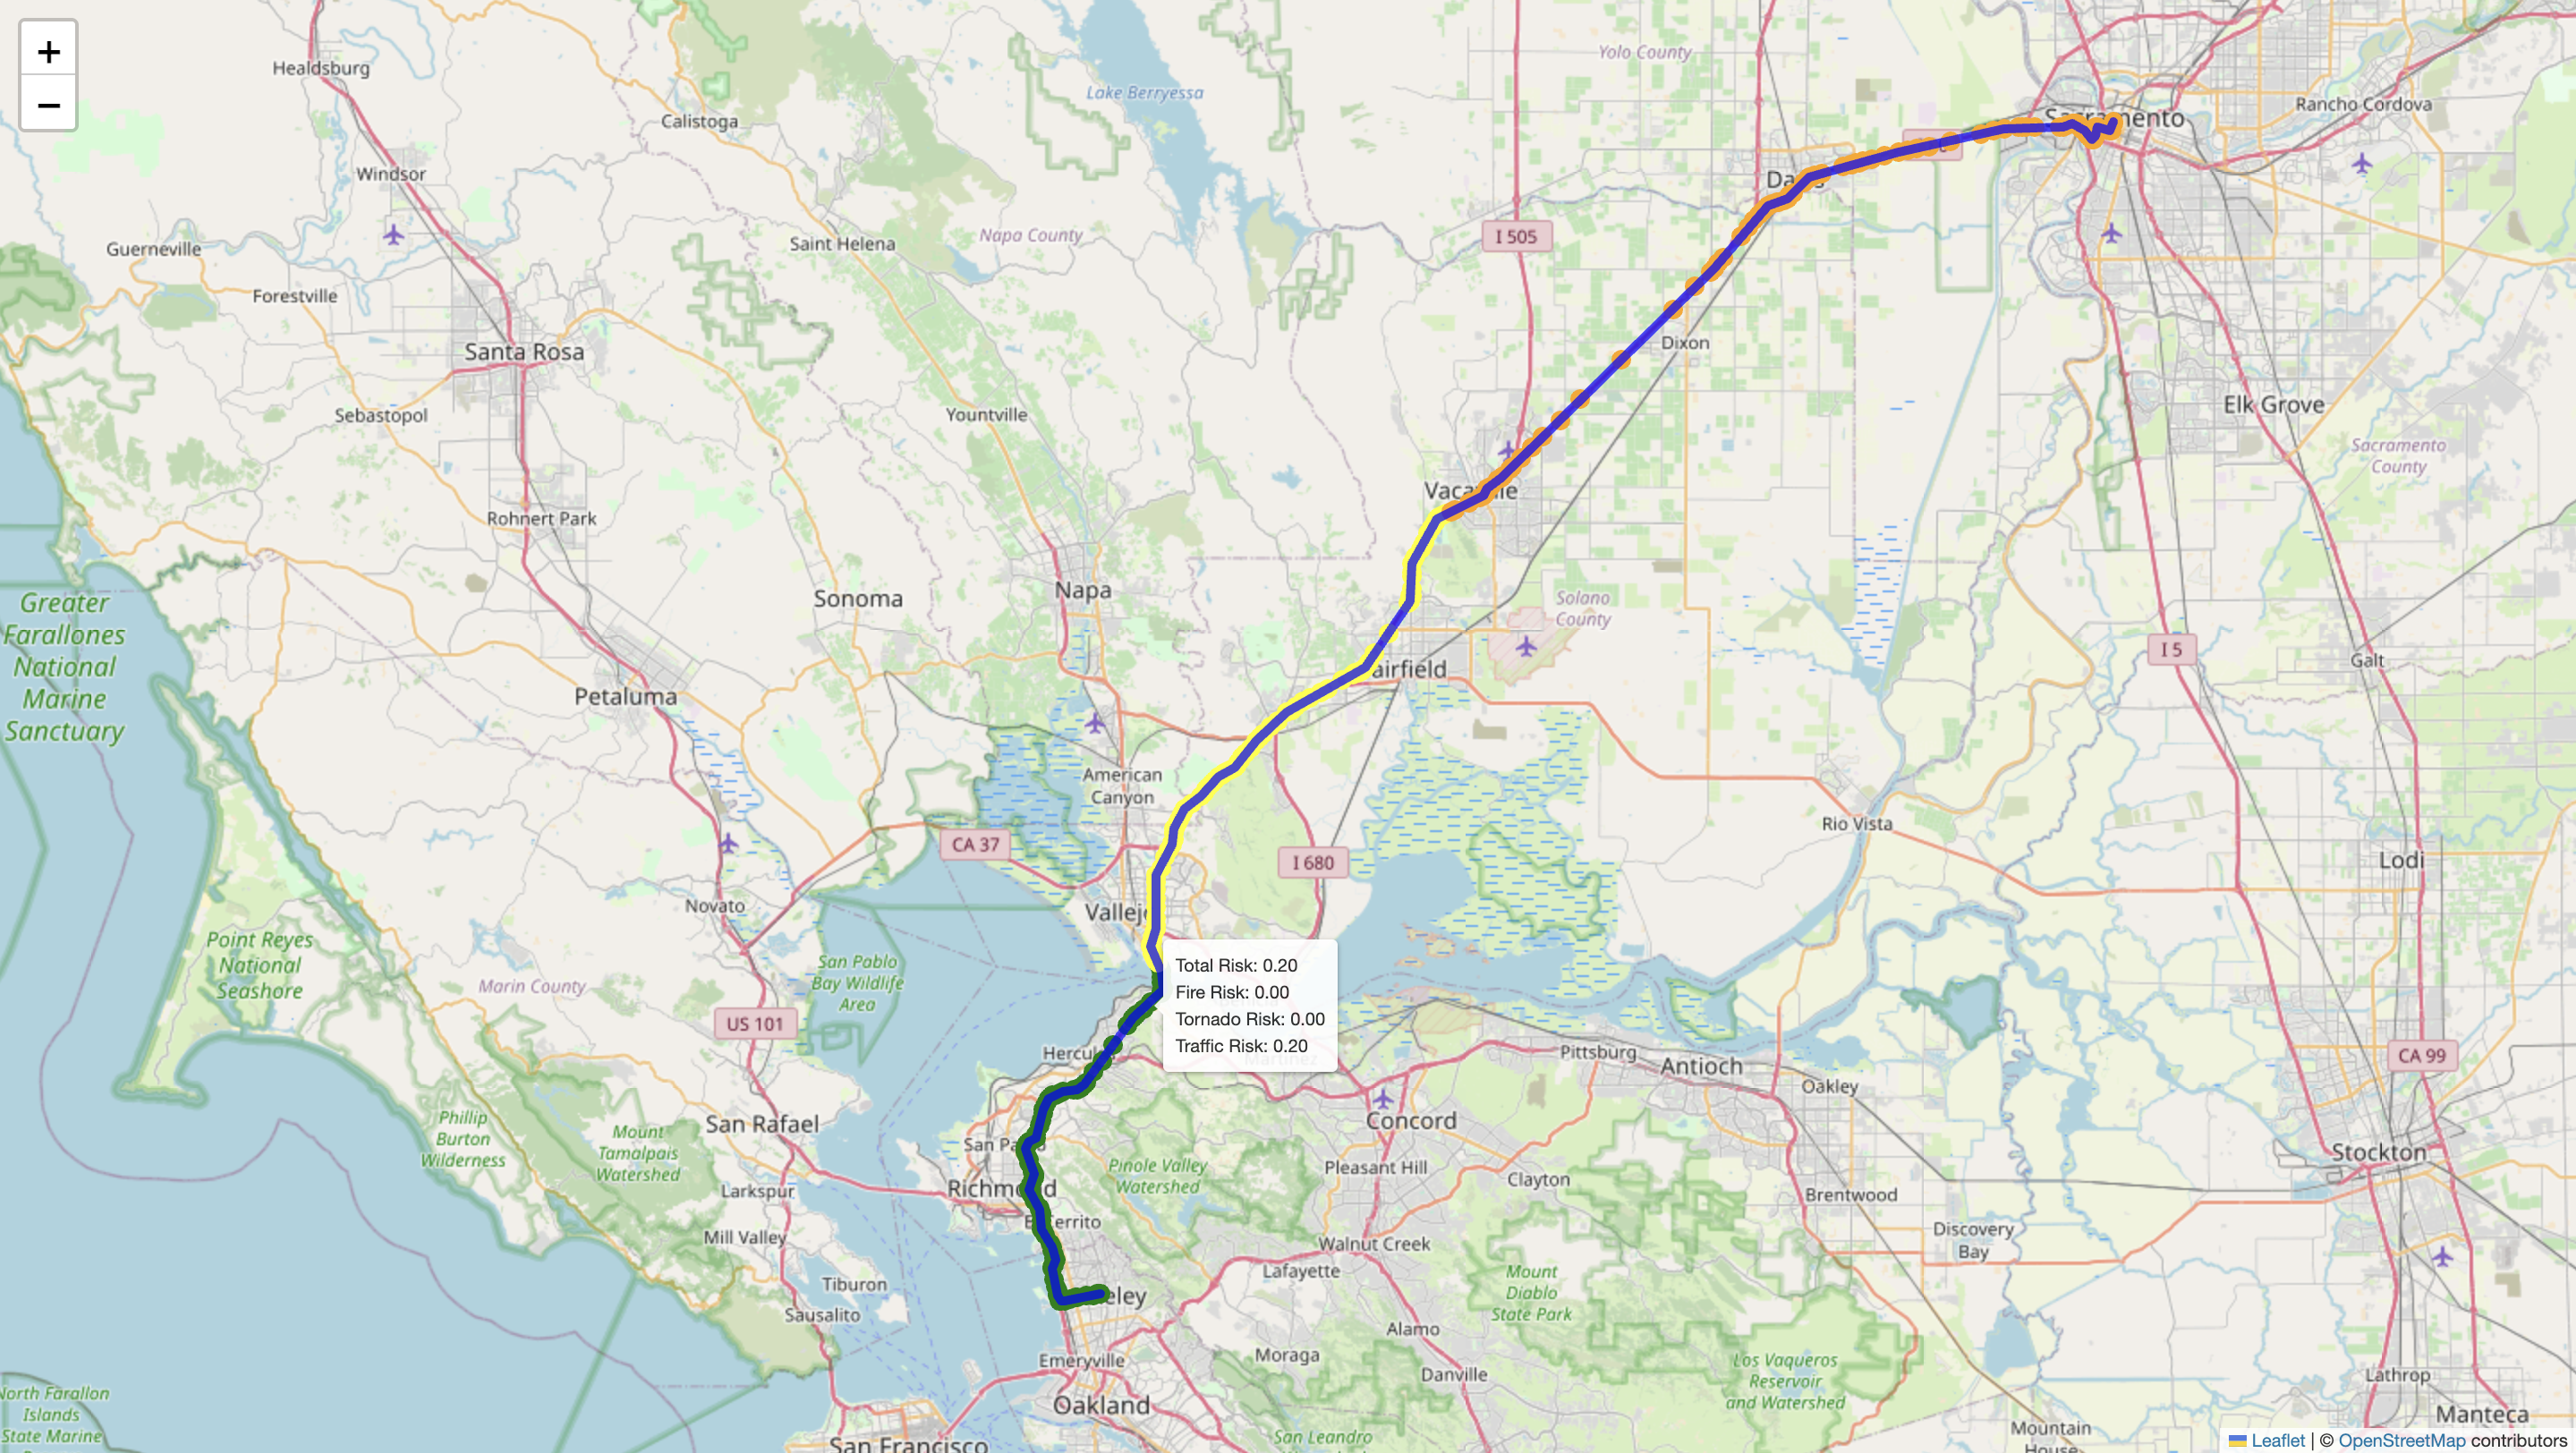
Zoomed out photo of pathfinding from rescuer to building with risk score label
-
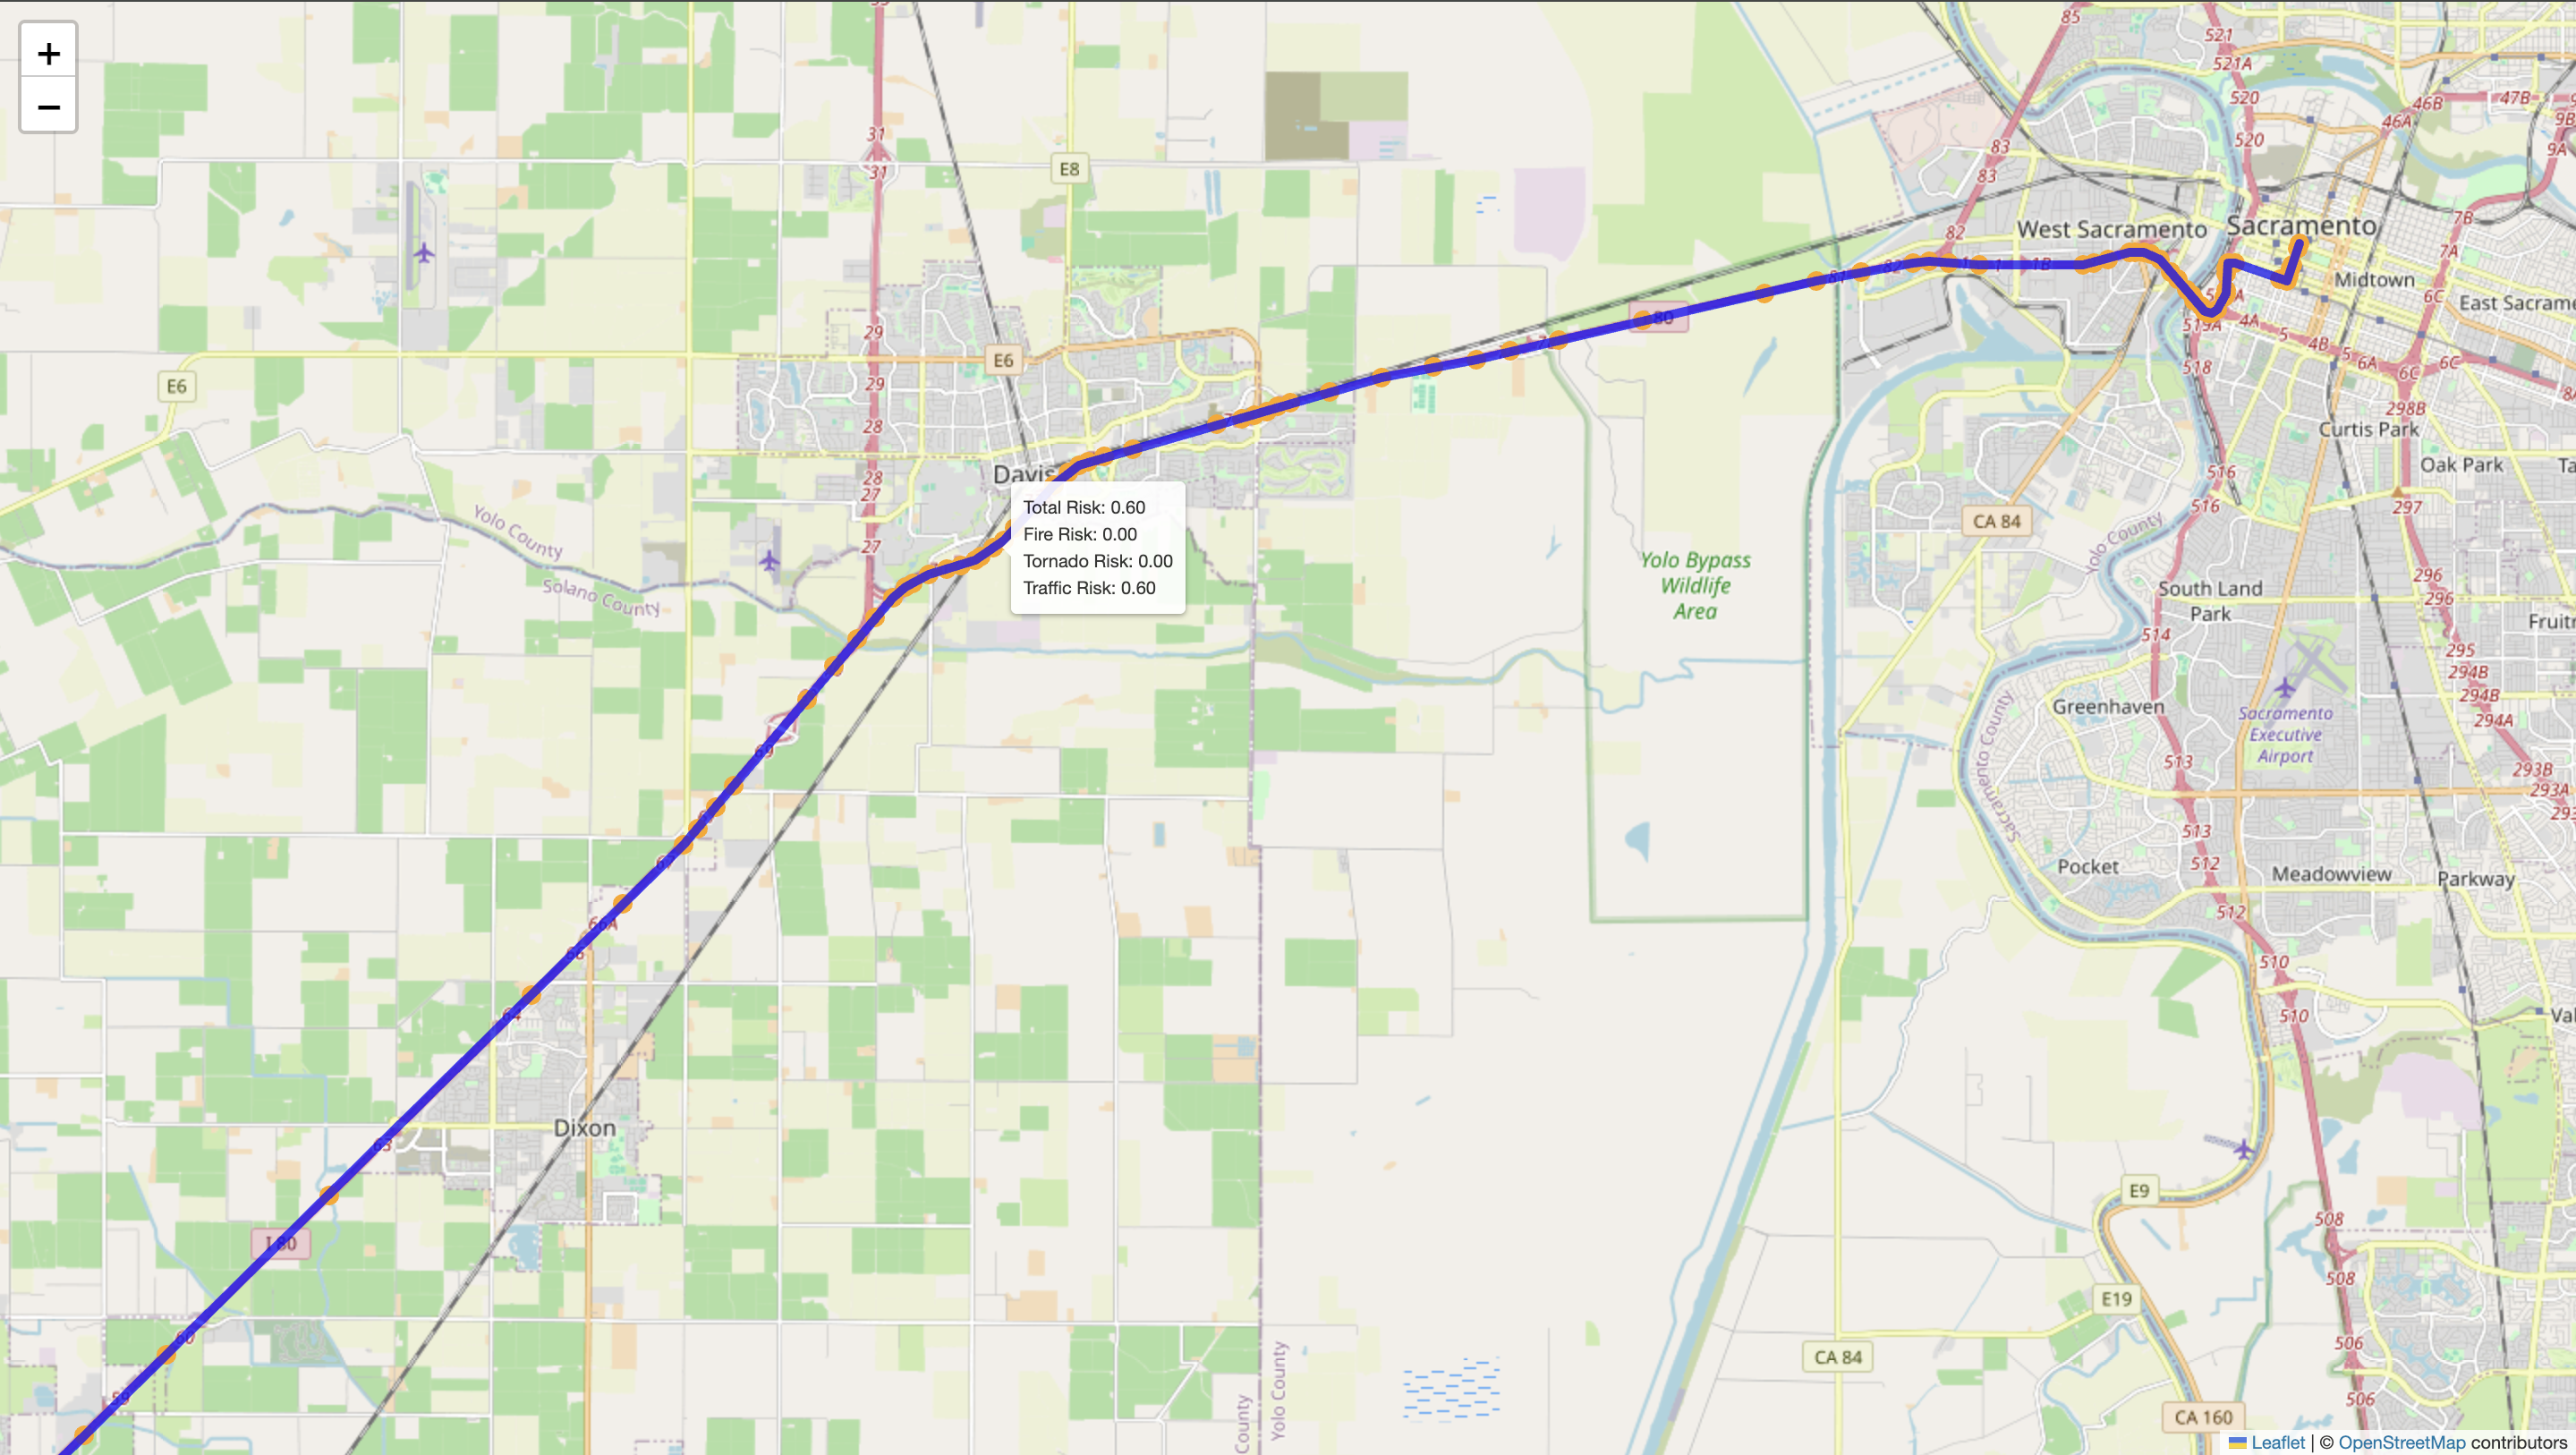
Close up photo of the same path
-
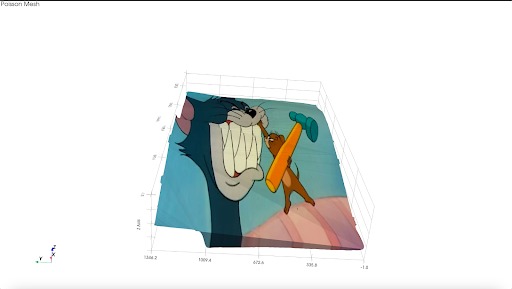
3D Tom and Jerry the inspiration:)
-
The coolest!

Inspiration
In major earthquakes, up to 30% of deaths happen not during the initial shock, but in the hours that follow—due to delayed rescue in inaccessible or poorly understood structures. That’s millions of people who could’ve been saved. Families that could’ve been reunited. This isn’t just tragic—it’s preventable. Post-disaster, roads are often blocked, unstable, or unsafe, making it extremely difficult and dangerous for rescue teams to reach those in need. Add in the fact that most building blueprints or street maps are outdated, missing, or nonexistent—especially in rural or low-income areas—and you have a perfect storm of disorganization and loss. That’s where Snap2Save comes in:
Our solution aims to save time, protect rescuers, and prioritize lives by combining two technologies: 1) 3D reconstruction of disaster-hit buildings from a single 2D image 2) Shortest pathfinding through dangerous terrain using real-time disaster data
What it Does:
Here’s how it works in real life: 1) Users uploads information into model a) An image of an impacted building b) Coordinates of the rescuers and the building 2) Our model outputs a 3D rendering of the user’s image 3) Our path-finding features maps shortest path from rescuer’s coordinates to the building, factoring in hazards like wildfires or tornado warnings 4) Rescuer upon arrive take photos of impacted building and uses 3D rendering of building to better navigate building to rescue victims
All it takes is a smartphone photo and basic coordinates.
Why Build This?
With Snap2Save, survival has been reduced to accessibility of a smartphone–and Snap2Save obviously. With the maturity of image generation technology only 5-10 images on average is sufficient for accurate image generation, all one needs is a few seconds to collect the photos to save lives. But the issue isn’t a lack of smartphone footage—it’s that rescue teams still use outdated tools that waste time and cost lives. With Snap2Save, survival becomes a function of accessibility, not luck.
It’s about giving frontline responders a smarter way to navigate chaos, and giving victims a fighting chance.
Over 85% of search areas during Hurricane Ian (2022) had some form of smartphone footage, yet teams operated without visual reconstructions, relying only on street-level maps. Further, Snap2Save not only will save lives but protect rescuers guiding them along the shortest path to minimize probability of injury and avoid risky areas. Additionally for rural, low-income areas where street maps or building floor plan is scarce and ill-quality, Snap2Save will be able to transform that and lower the equity barrier for survival.
How We Built it?
A) Image Rendering Our implementation follows a two-step pipeline: converting a 2D image into a 3D point cloud and then visualizing and interacting with that 3D reconstruction.
🔁 Step 1: 2D to 3D Rendering We began with a single RGB image as input and used depth estimation to infer the relative distance of each pixel in the image from the camera. For this, we leveraged MiDaS and DPT, state-of-the-art pretrained models from the isl-org GitHub repository, implemented in PyTorch. These models output a depth map that we used to generate a 3D encoding.
Each pixel in the image was transformed into a 4-channel vector [R, G, B, relative_depth], forming a matrix of shape H x W x 4, where H and W are the image height and width. This matrix—encoded_matrix—served as the foundation for building the 3D structure. We then converted this matrix into a 3D point cloud. Each pixel's 2D coordinates and depth value were used to compute (x, y, z) positions in space, while the original RGB color was preserved. These were stored as two arrays: points_xyz (a Nx3 array of 3D coordinates) and colors_rgb (a Nx3 array of RGB values scaled to 255).
Next, we clustered nearby points based on Euclidean distance. We connected them by fitting small triangular surfaces between close neighbors, estimated normals, and then wrapped the original image texture around these triangle meshes to reconstruct the surface visually and structurally.
🌐 Step 2: Visualization & Interactivity The resulting mesh was rendered using either the Open3D GUI (Python) or Three.js (JavaScript) for real-time, interactive 3D viewing. This allowed users to rotate, zoom, and explore the generated 3D model from different angles.
For teams unfamiliar with 3D graphics pipelines, we ensured simplicity and accessibility by packaging our solution into a lightweight demo built using Streamlit or a simple Flask app. This made the tool easy to run locally or deploy online.
B) Path-Finding For the pathfinding component of our project, we built a risk-aware routing system designed to guide users along the safest possible route to a specified destination. The system integrates multiple real-time data sources, including live traffic conditions (via the Google Maps API), active wildfire incident data, and severe weather alerts such as tornado warnings. These data streams are used to calculate region-specific risk scores, which are then factored into the routing logic.
We compute a "fire footprint" to model wildfire hazards, assigning a dynamic risk score to any path that intersects this zone, with higher scores nearer the fire’s core. Similarly, tornado warnings are geolocated and translated into risk zones with their own scoring model. All risk factors are combined into a custom heuristic that drives our modified pathfinding algorithm, ensuring that routes are not only efficient but also optimized for safety. The final route is visualized using Folium, where each segment of the path is color-coded based on the cumulative hazard level, allowing users and rescuers to clearly see which areas to avoid.
Challenges we ran into:
Some challenges we ran into were initially when we were doing the 3D rendering, we always for some reason had the image stretched and dilated, or certain features or far removed from their original locations. We fixed that by altering the orientation. Another difficulty was connecting the frontend and backend, even though we had our frontend up and designed with designated place to upload image and designated place to display the rendering the connecting was far more complicated then expected. Lastly, once we rendered our image successfully there were various small bugs that was surprisingly time-consuming and took up the majority of the remaining time, for example for a picture that showed trees in a park it rendered it but had several white holes dispersed throughout. A challenge that we faced for path-finding was computing risk factors for different environments, for example for fires it was hard to find the fire footprint radius given centerpoint and where it overlapped with the path taking..
Accomplishments that we’re proud of:
We’re proud of our 3D rendering, it took several iterations and long hours of coding and debugging to perfect it. We’re also really proud of the 3d geometry mesh skeleton, using the poisson construction algorithm, that users can interact to turn on and off. It was a moment of bliss when we successfully implemented the poisson implemention algorithm before we sunk into debugging agony. Another accomplishment was implementing the risk-factor for the shortest path which we initially calculated with a* then pivoted to using google standard shortest path, and calculated that by having nodes along the path each attached with a risk score.
What We Learned:
There was definitely a lot of technical hardship and experience gained through this project. But beyond the technical we also gained confidence and a sense of realistic risk-taking that was essential to our hackathon. Originally we were hesitant to do the 3D rendering fearing because of lack of experience we shouldn’t try anything new or experimental especially in the time-constraint environment of the hackathon. One significant takeaway was parsing api data and getting point results for the pathfinding feature of our product. We also learned how to utilize different tools and sometimes repurpose tools, creatively interpret and apply them to build our 3D rendering for example geocoding api from Google Cloud and Claude 4.
Limitations
We only had 4-5 images for 6 natural disasters which is a total of 30ish images which is not a lot and further does not cover much diversity of the plethora of natural disaster or other catastrophic events. With more time we would collect and source more and more diverse data, to not only improve accuracy but build better interior and exterior of our 3D renderings.
What’s Next for
For next steps we work in tandem with emergency drone imaging, directing images to fly within the destination building to collect images of the interior and apply our 2d to 3d rendering to generate the 3d interior features(like stairwell, corridors) within our existing 3d building exterior/skeleton. The implementation of it is pretty streamlined given the heavy-lifting of the work has already been crafted with the 2d to 3d generator and we only need to feed in the drone images to fill it in.
Built With
- dall-e
- folium-midas
- google-maps
- meshlab
- open3d
- react.js
- three.js
- typescript

 Yiran Wei")

Log in or sign up for Devpost to join the conversation.