-
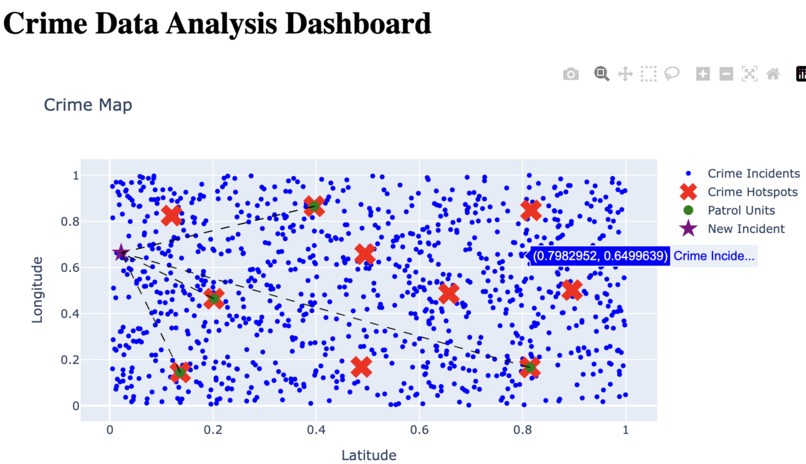
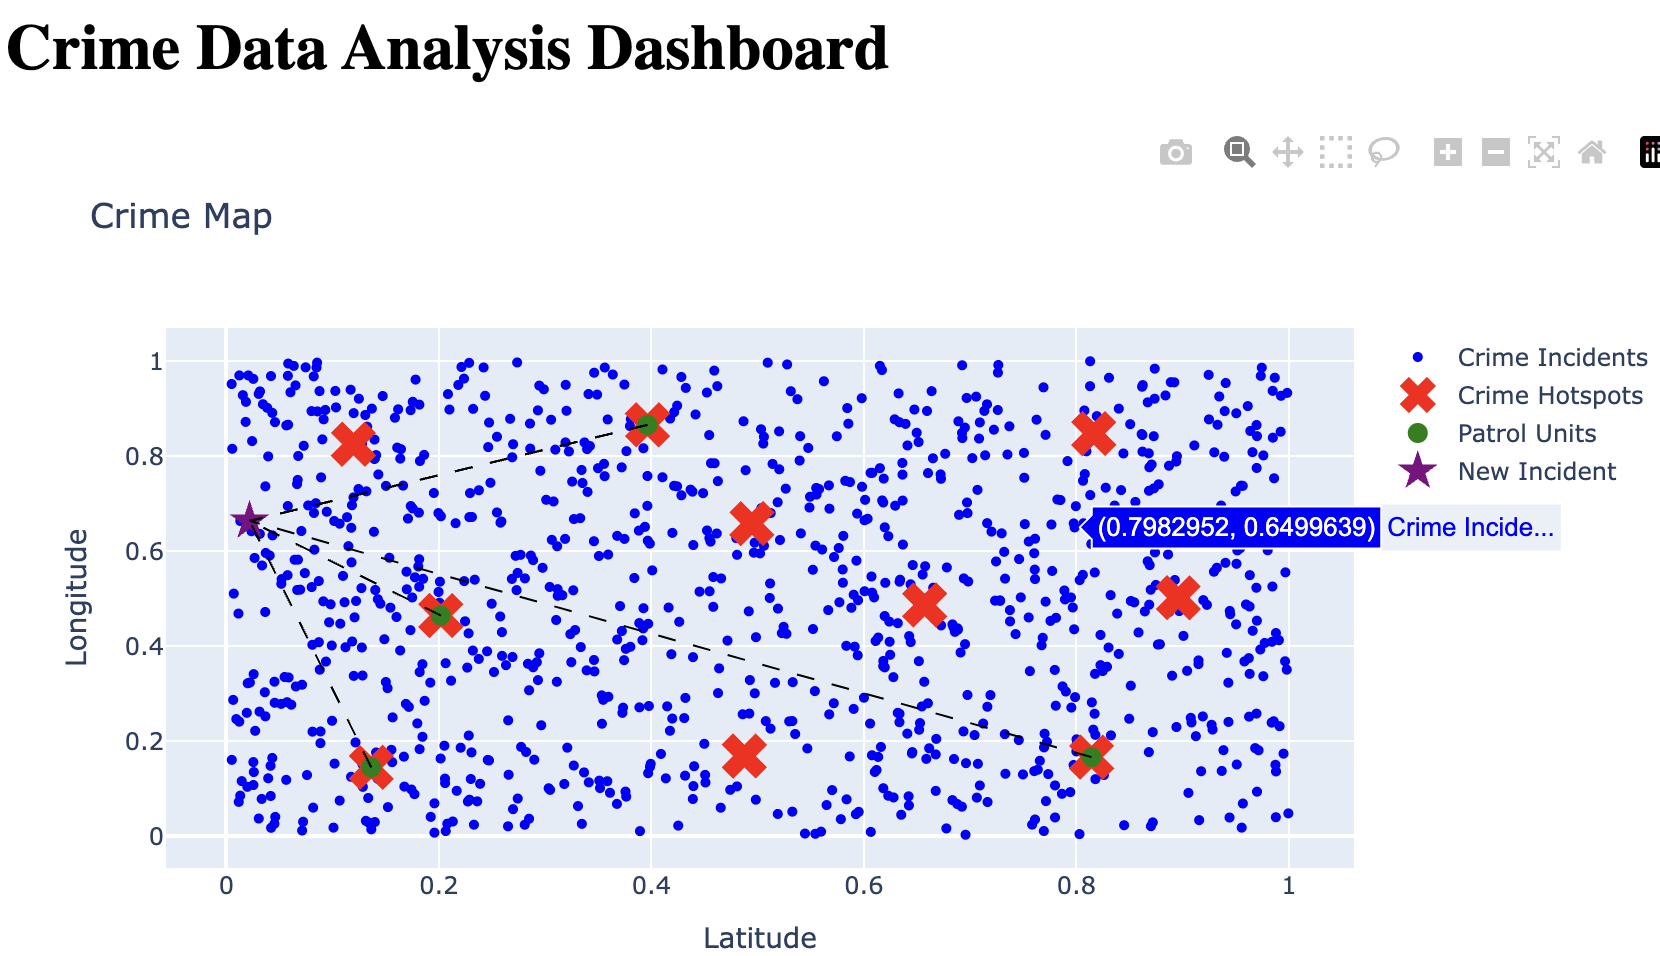
Simulated map and paths
Inspiration
Our inspiration came from the need to enhance public security and safety through data-driven approaches.
What it does
Smurfs simulates crime incidents, identifies hotspots, optimises patrol routes, and dynamically adjusts them based on real-time incidents for effective security management.
How we built it
We built Smurfs using Python, leveraging libraries such as numpy, scikit-learn, Dash, and Plotly for data simulation, analysis, visualisation, and web-based deployment.
Challenges we ran into
Our main challenges included optimising patrol routes dynamically and integrating real-time incident updates into the system effectively.
Accomplishments that we're proud of
We're proud of developing a comprehensive solution that combines data analysis, visualisation, and real-time adaptation to enhance public security.
What we learned
Throughout the project, we learned about various clustering and optimisation techniques and gained insights into building interactive dashboards for data visualisation.
What's next for Smurfs
In the future, we plan to integrate more advanced machine learning algorithms, enhance real-time incident prediction, and collaborate with law enforcement agencies for practical implementation. We could also trying using density based clustering to determine our hotspot areas instead. Moreover, if we have access to crime data, we can further optimise the patrol routes by adding properties such as risk factor and distance to our graph edges. For instance for each location, we can calculate the risk factor based on the frequency of crimes and severity of crimes happening. Then, the maximum spanning tree of the graph will be the optimised patrol routes for the police to cover high-risk areas effectively. The shortest distance path can also be determined to shorten emergency response times. We also hope to use machine learning algorithms to predict where crime might happen in the future.
Built With
- dash
- matplotlib
- numpy
- plotly
- python
- scikit-learn

Log in or sign up for Devpost to join the conversation.