-
-
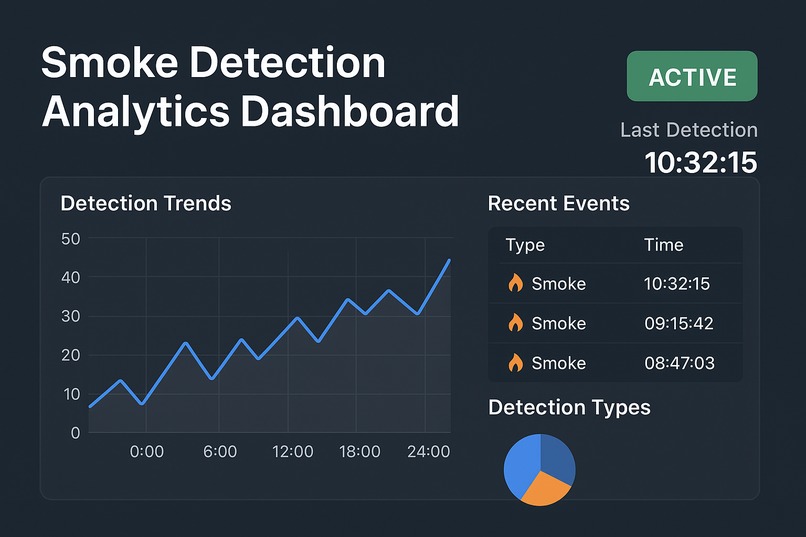
Smoke Detection Dashboard

The Smoke Detection Analytics Dashboard is a web-based software solution designed to present smoke detection data in a clear, interactive, and user-friendly manner. The goal of this project is to help administrators and stakeholders monitor, analyze, and review smoke-related events through an intuitive dashboard interface.
Instead of focusing on hardware or physical detection systems, this project emphasizes data visualization, monitoring, and management through a modern web application.
What Inspired Me
Many smoke detection solutions focus heavily on detection logic but provide poor visibility and analytics for end users. I wanted to build a dashboard that transforms raw detection data into actionable insights through charts, logs, and real-time status indicators.
How I Built the Project
The dashboard was developed as a responsive web application that displays smoke detection records, alerts, and analytics. The system workflow includes:
Receiving processed smoke detection data
Displaying real-time and historical records
Visualizing trends using charts and tables
Providing a clean and intuitive UI for monitoring
The focus was on frontend usability, data presentation, and dashboard performance.
What I Learned
Designing scalable dashboard layouts
Implementing real-time data visualization
Improving user experience (UX) for analytics platforms
Structuring clean and maintainable frontend code
Challenges Faced
Designing a clean UI for complex data
Managing dynamic dashboard updates
Ensuring responsiveness across devices
Optimizing page performance
Built With
- and
- api
- css3
- dynamic
- github
- html5
- javascript
- python
- tables
- ui

Log in or sign up for Devpost to join the conversation.