Project Story
About the Project
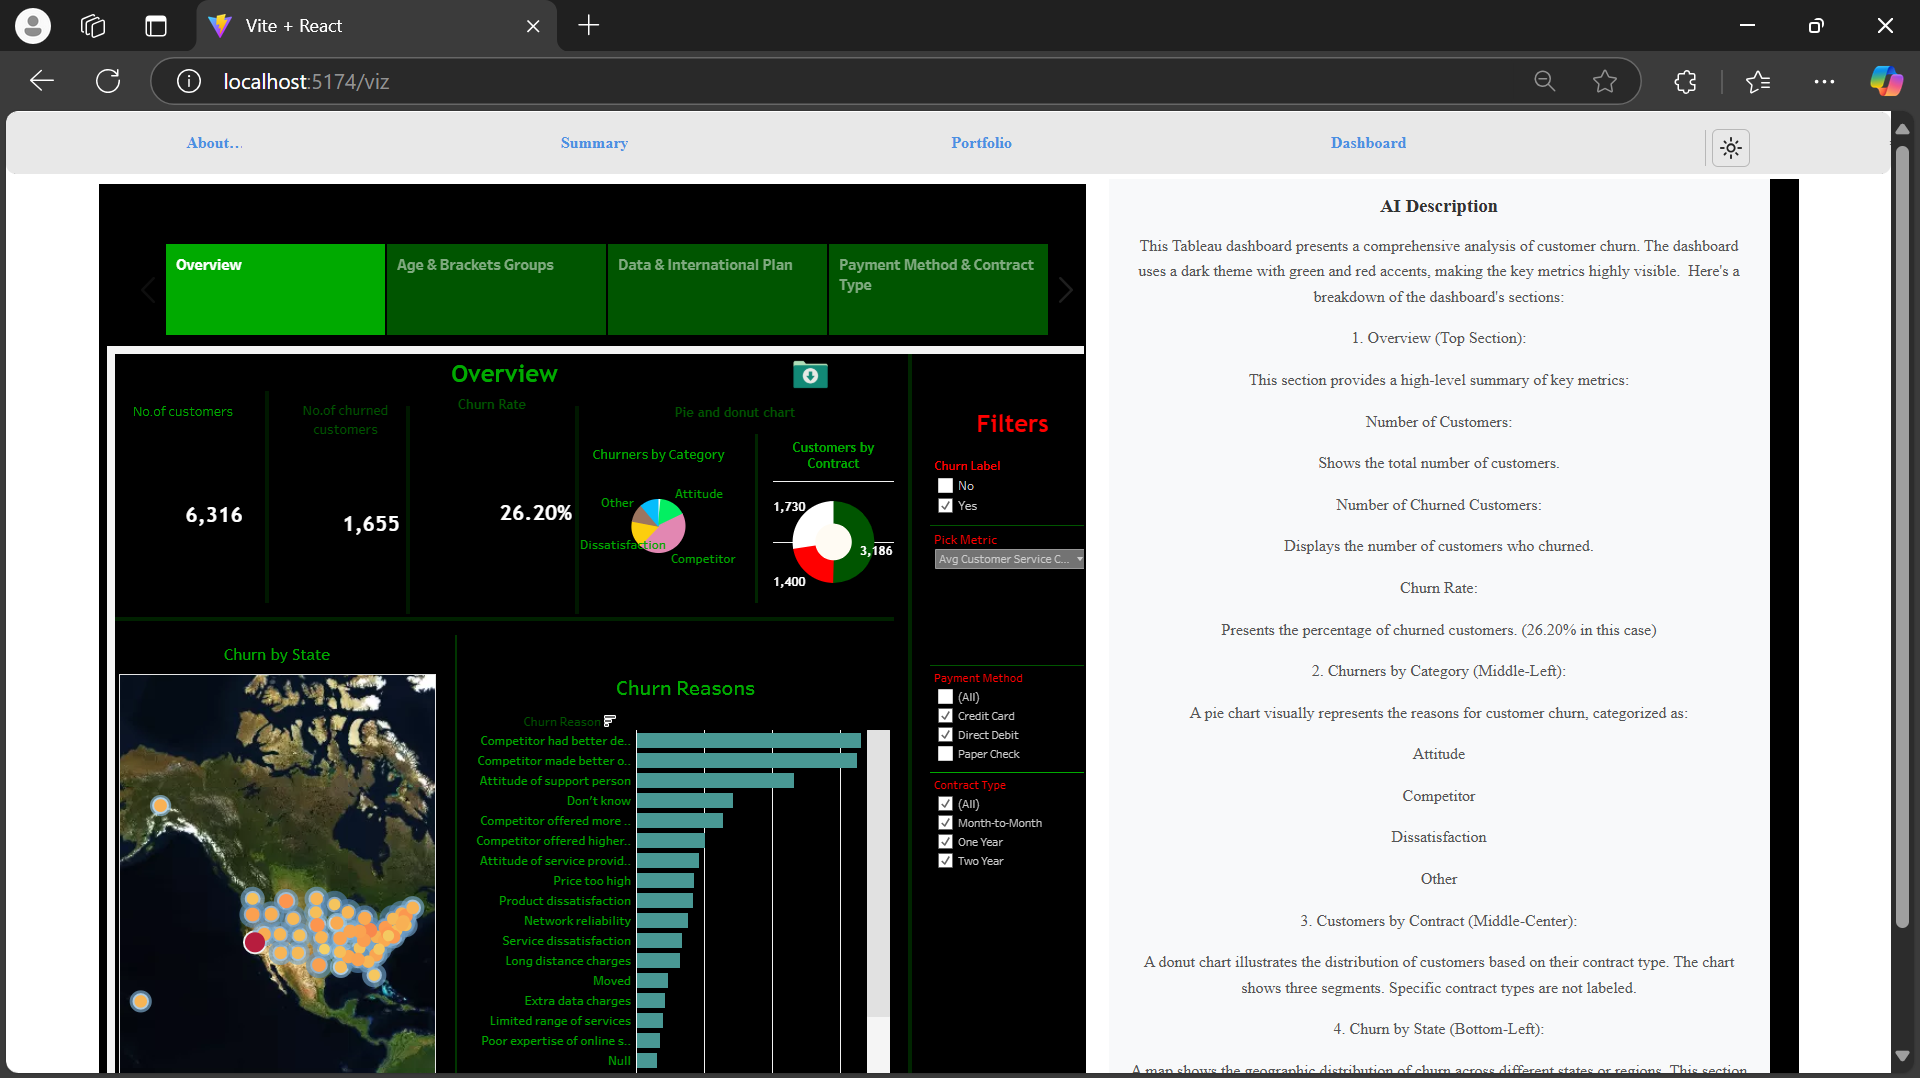
"smartViz" is an innovative web application that integrates Tableau visualizations with AI-driven analysis, built using React and the Tableau JavaScript API. The project was inspired by the need to enhance data accessibility and interactivity. As data becomes increasingly complex, it’s crucial to find ways to make visualizations more insightful and actionable. I wanted to create a tool that not only allows users to interact with Tableau dashboards but also provides AI-generated interpretations of the visualized data.
This project merges the world of interactive data visualization with intelligent AI capabilities, providing users with a more comprehensive understanding of their data. Whether it’s a business user analyzing trends or a researcher exploring correlations, "smartViz" transforms how users engage with data.
How I Built the Project
Building "smartViz" involved integrating several key technologies:
React: I used React to build the user interface and manage the state of the application. React’s component-based structure helped me organize the project, while hooks like
useStateanduseEffectmade handling the lifecycle of the embedded Tableau visualization seamless.Tableau JavaScript API: Embedding Tableau dashboards directly into a React app was one of the main challenges of this project. I used Tableau’s JavaScript API to load and display interactive visualizations directly within the application. The API allowed me to interact with the Tableau content dynamically and embed it as an object in the React component.
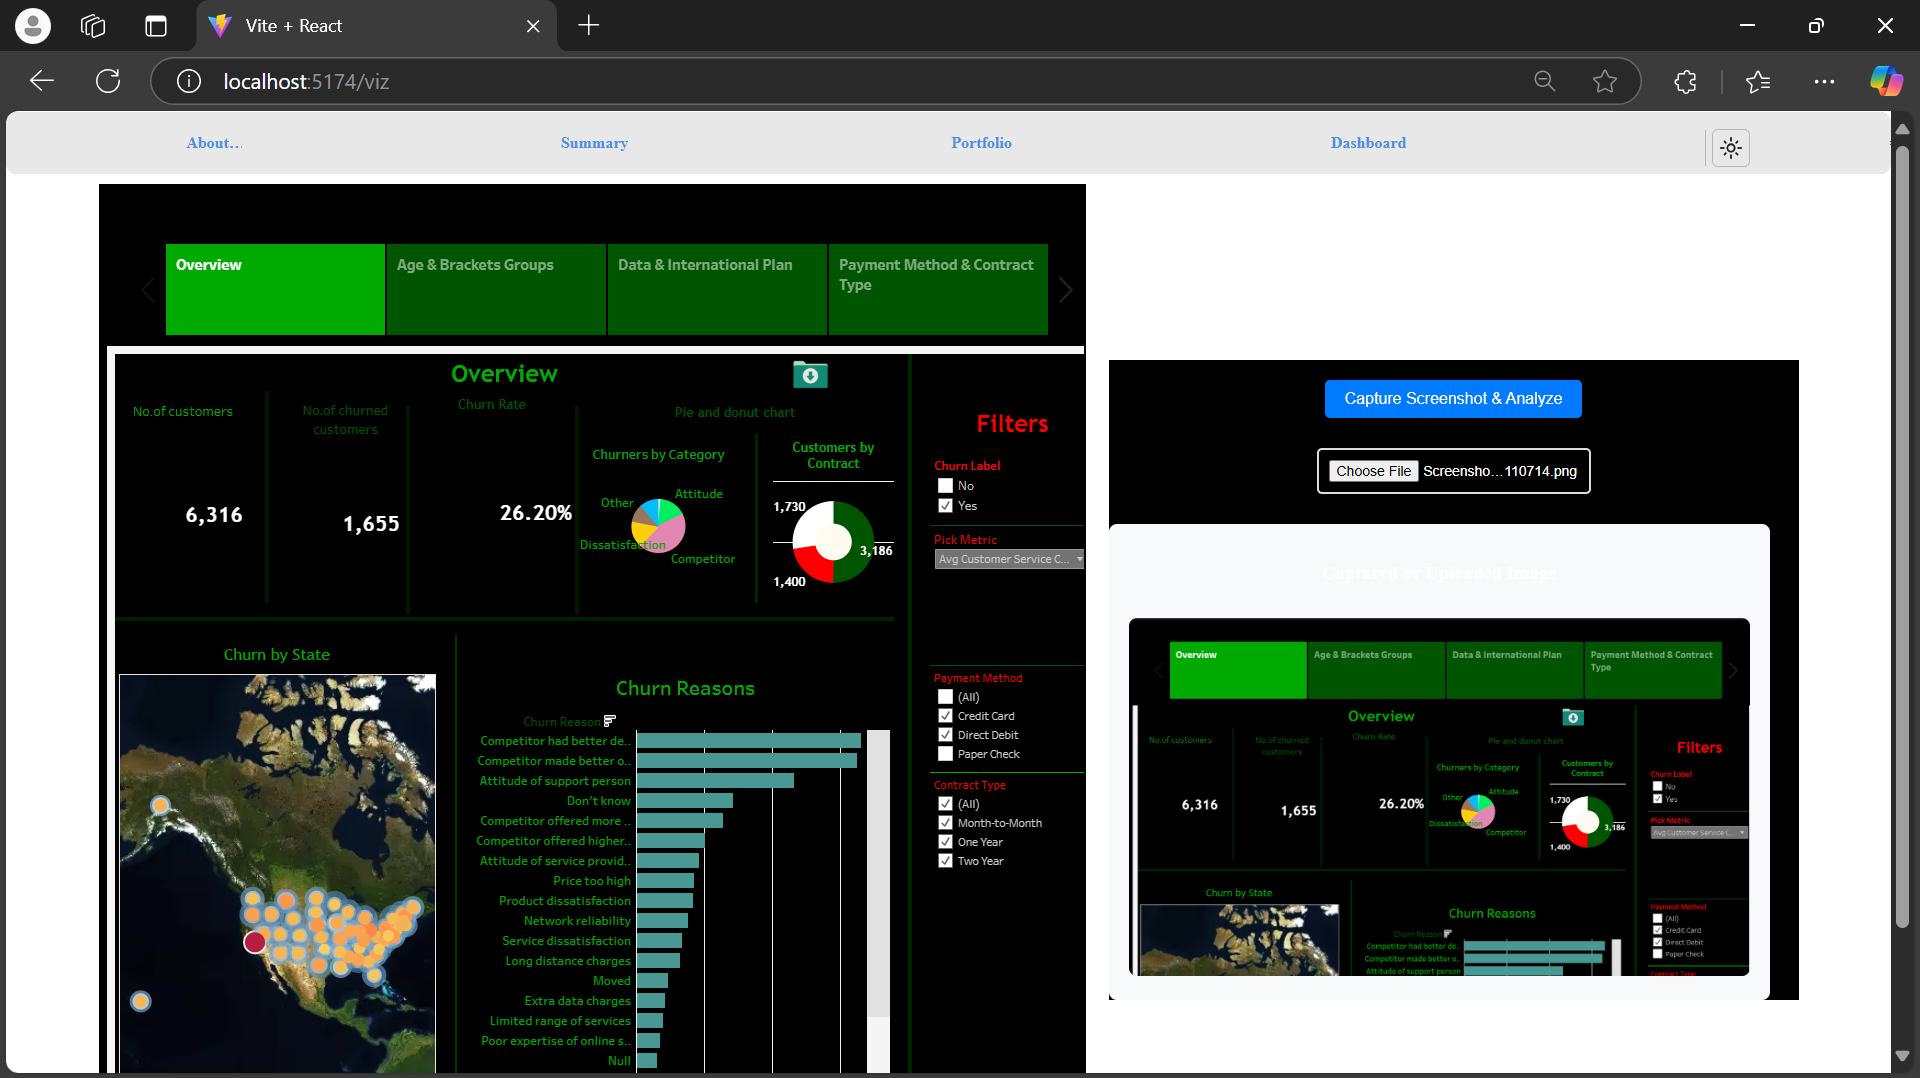
HTML2Canvas: To capture Tableau visualizations as images, I utilized
html2canvas. This library converts HTML elements into a canvas, allowing users to take a screenshot of the Tableau dashboard, which is then passed on for AI analysis.AI Image Analysis: After capturing the image, I integrated a custom backend that uses AI to analyze the screenshot and return a descriptive interpretation of the data it captures. This AI model breaks down the visualization into understandable insights, helping users better comprehend the displayed data.
Challenges Faced
Embedding Tableau in React: One of the most significant challenges was embedding Tableau dashboards properly into a React application. Tableau’s JavaScript API wasn’t designed specifically for React, so I had to manage its lifecycle manually. This required understanding the intricacies of both Tableau's API and React's component lifecycle, ensuring the dashboard loaded correctly and the visualization remained interactive.
Image Capture Consistency: Ensuring accurate image capture of dynamic Tableau visualizations was tricky. Tableau’s visualizations could change frequently based on user interactions, so capturing the correct state of the dashboard using
html2canvasproved to be complex. It required managing timing and ensuring the right data was captured every time.AI Interpretation of Visualizations: The AI component posed a unique challenge. While AI can process and analyze data, interpreting the content of a Tableau visualization accurately is not straightforward. I had to fine-tune the AI model to generate meaningful, contextually accurate analysis based on the images of the Tableau dashboards.
What I Learned
Through this project, I deepened my understanding of integrating external libraries and APIs, especially embedding dynamic content like Tableau in a React application. I also gained valuable experience working with image capture libraries and integrating AI models for data analysis.
This project also taught me how to solve real-world technical problems, like ensuring proper synchronization between capturing images and analyzing them in real-time. Furthermore, I learned how to balance user experience with technical constraints, optimizing the interface for both performance and ease of use.
Key Takeaways:
- Combining data visualization and AI can significantly improve the way users interact with and interpret complex data.
- React’s flexibility makes it a powerful framework for building interactive and dynamic web applications.
- Overcoming challenges like asynchronous data loading, image capturing, and AI integration requires creativity, patience, and continuous iteration.
"smartViz" stands as a solution that not only makes data visualizations more interactive but also enriches the user experience by providing AI-powered insights, bridging the gap between raw data and actionable intelligence.
Built With
- geminiai-api
- javascript
- node.js
- react
- tableaujavascriptapi

Log in or sign up for Devpost to join the conversation.