-
-
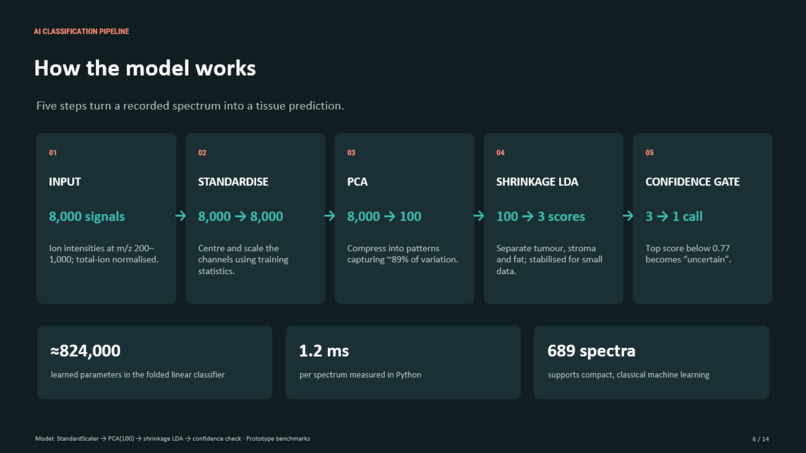
How the model works
-
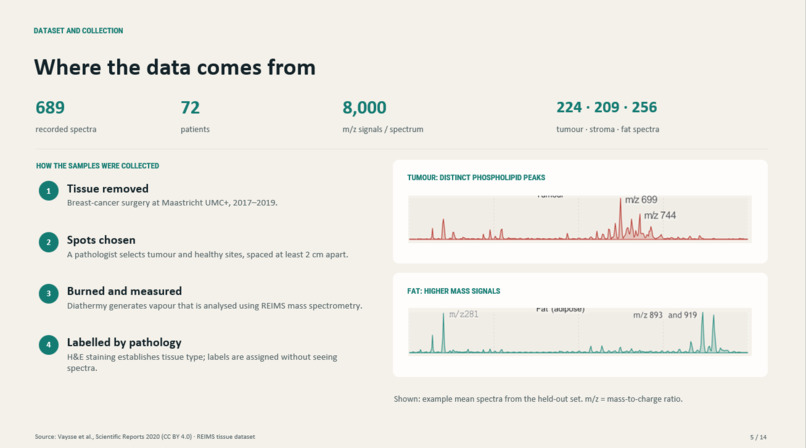
Data Origins
-
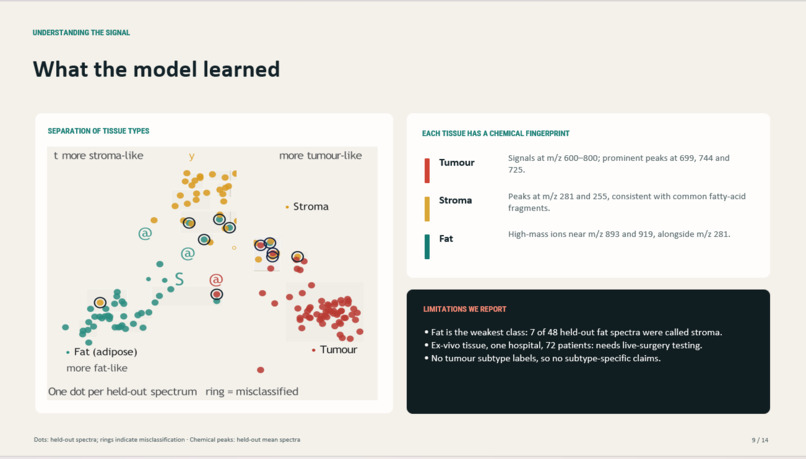
What the model learned
-
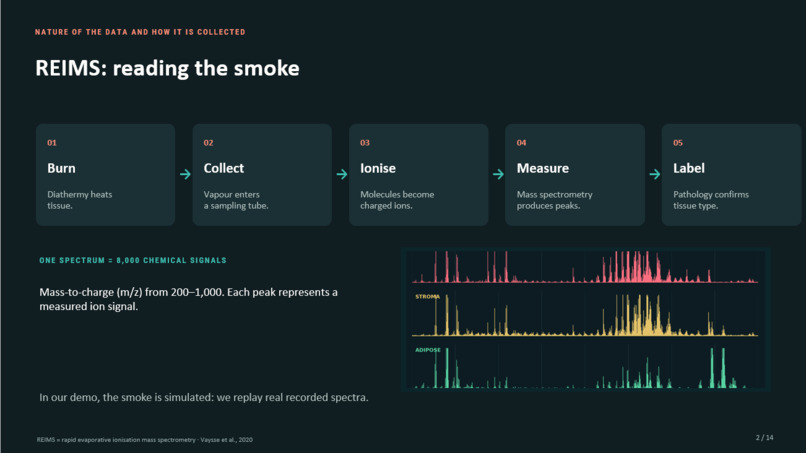
REIMS --> Reading the Smoke
-
Model Training methods
Inspiration
Around one in five women who have a breast tumour removed in breast-conserving surgery need a second operation, because cancer is found at the edge of the removed tissue. The surgeon only finds out days later, when the pathology report comes back.
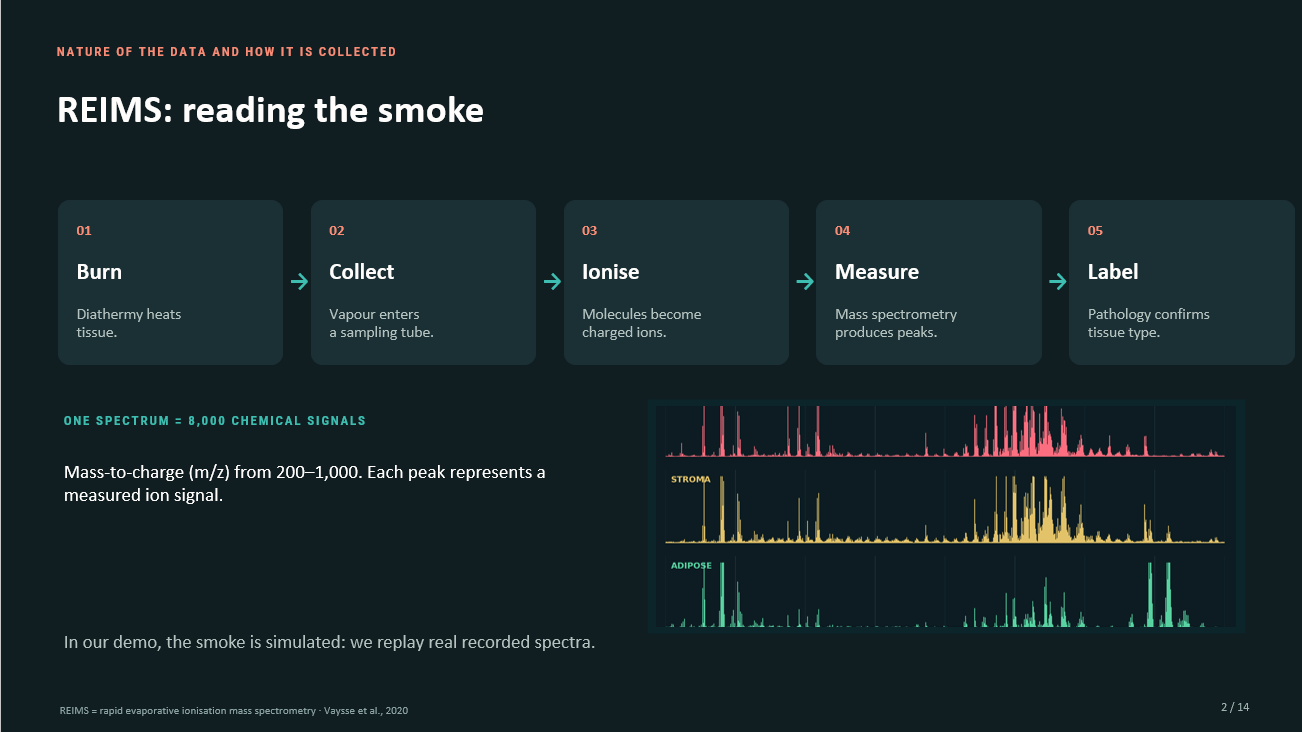
Surgeons already cut with an electrosurgical scalpel, which vaporises tissue and produces smoke. Researchers have shown that this smoke carries a chemical fingerprint of the tissue being cut (the "iKnife" idea). We wanted to see if we could turn that smoke into a live answer for the surgeon: are you cutting tumour, or healthy tissue?
What it does
SmartScalpel reads the mass spectrum of surgical smoke and classifies the tissue as tumour, stroma (fibrous connective tissue) or adipose (fat).
To demo it, we built an interactive surgery simulator:
- Cut the skin with a scalpel.
- Spread the wound open with a retractor.
- Burn with the SmartScalpel.
Every burn sends a puff of smoke to a simulated mass spectrometer. Our classifier reads a real recorded spectrum of the tissue under the tip, and an RGB LED on an Arduino turns red for tumour, yellow for stroma and green for fat. The model never sees the picture, only the spectrum.
How we built it
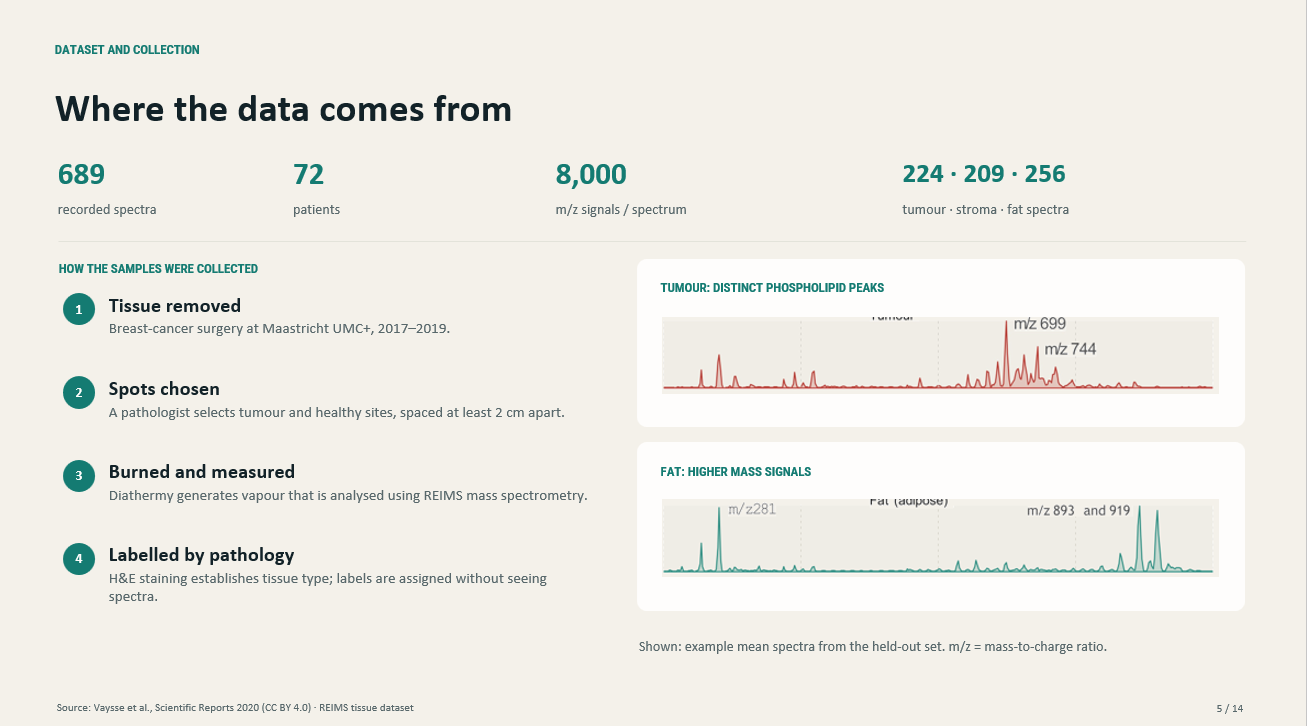
Data. We used the published REIMS dataset from Vaysse et al. (Scientific Reports, 2020, Maastricht UMC+): 689 smoke spectra from 72 breast-cancer patients, each labelled by a pathologist from stained tissue. Each spectrum is 8,000 numbers: ion intensity from $m/z$ 200 to 1000, normalised to total ion count.
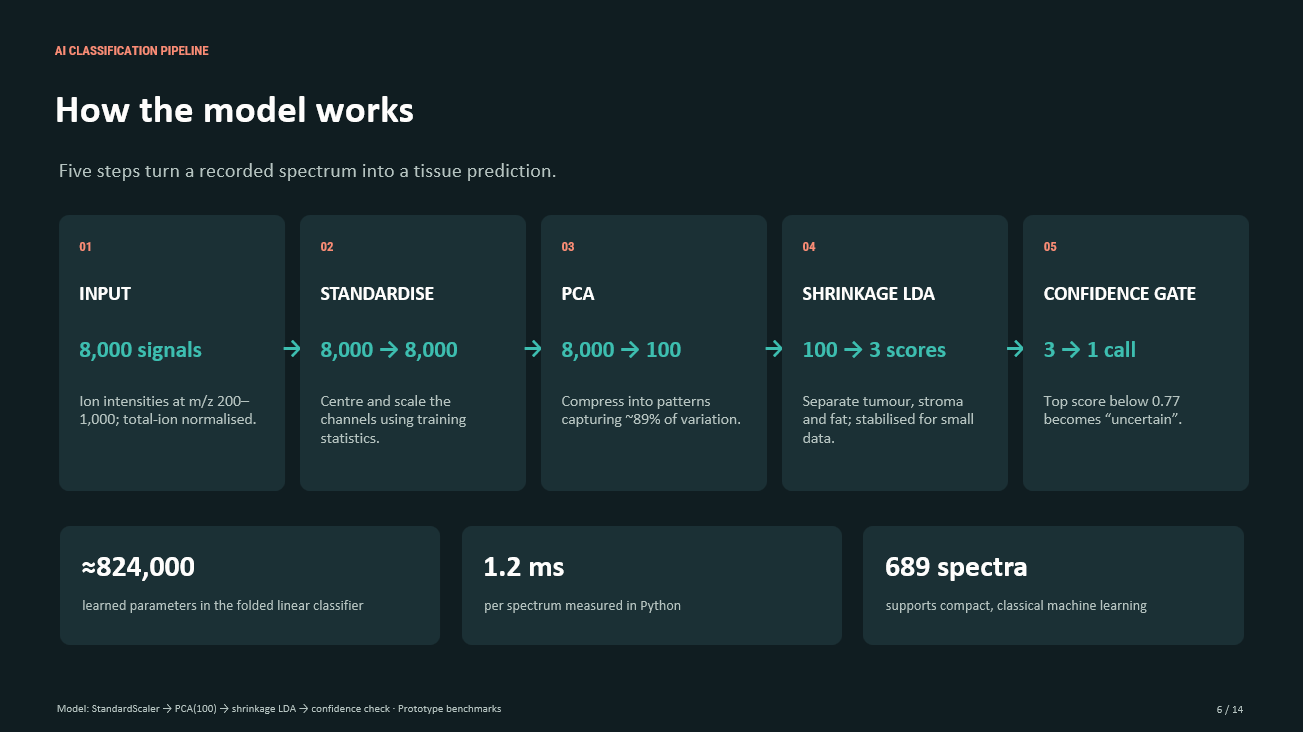
Model (PCA + shrinkage LDA). First, each of the 8,000 channels is standardised so small peaks still count:
$$z_j = \frac{x_j - \mu_j}{\sigma_j}$$
Principal component analysis compresses the spectrum into 100 features that keep 89% of the variation:
$$\mathbf{t} = P^\top \mathbf{z}, \qquad \mathbf{t} \in \mathbb{R}^{100}$$
Linear discriminant analysis then scores each tissue class $k$:
$$\delta_k(\mathbf{t}) = \mathbf{t}^\top \hat{\Sigma}^{-1}\boldsymbol{\mu}_k - \tfrac{1}{2}\boldsymbol{\mu}_k^\top \hat{\Sigma}^{-1}\boldsymbol{\mu}_k + \log \pi_k$$
With only about 530 training spectra, the shared covariance is noisy, so we use Ledoit–Wolf shrinkage:
$$\hat{\Sigma} = (1-\alpha)\,S + \alpha\,\frac{\operatorname{tr}(S)}{p}\,I$$
Scores become probabilities with a softmax, and the model says "uncertain" if it isn't confident enough:
$$p_k = \frac{e^{\delta_k/T}}{\sum_j e^{\delta_j/T}}, \qquad \text{answer only if } \max_k p_k \ge 0.77$$
Every step is linear, so the whole pipeline folds into a single map $\mathbf{d} = W\mathbf{x} + \mathbf{b}$ with $W \in \mathbb{R}^{3\times 8000}$. That let us run the exact same model in the browser as in Python, matching to within $10^{-8}$.
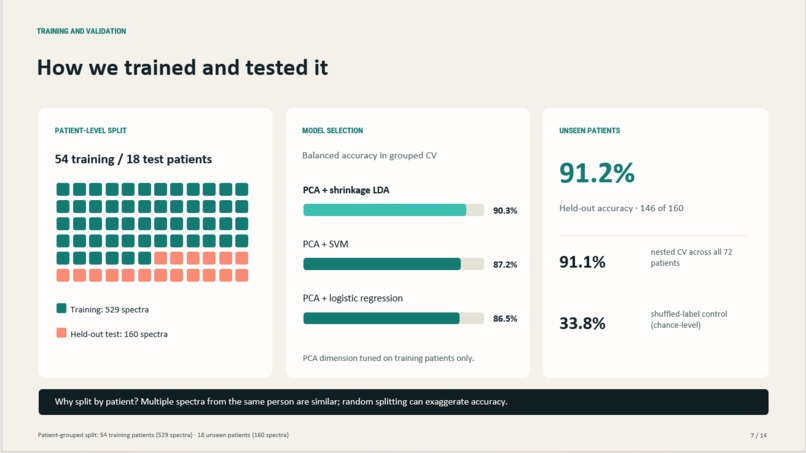
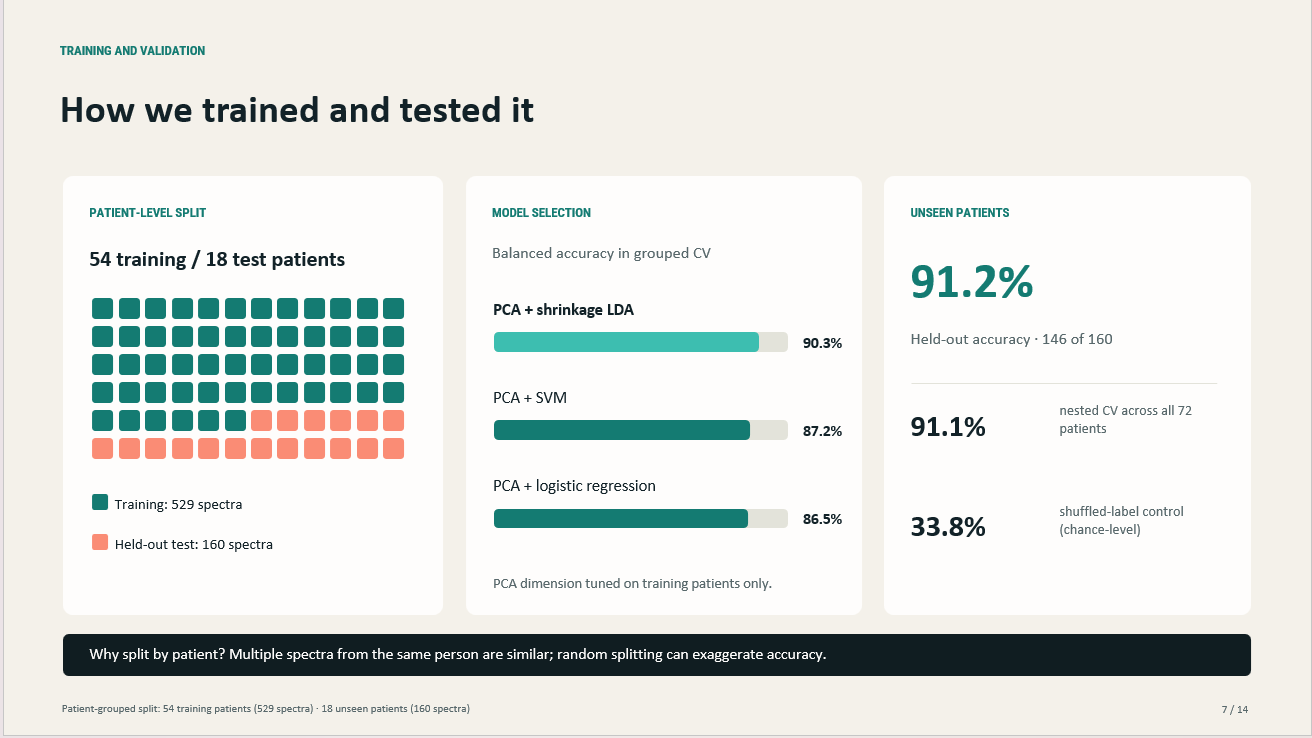
Validation. We split by patient, not by spectrum: 54 patients for training, 18 locked away for testing. Model choice, threshold and calibration all used training patients only.
| Check | Result |
|---|---|
| Held-out test (18 unseen patients) | 91.25% accuracy |
| Nested patient-grouped cross-validation (72 patients) | 91.1% ± 2.0 |
| With the 0.77 confidence cut-off | 96.9% accuracy on the 79% of spectra it answers |
| Shuffled labels (leak check) | 33.8% (chance) |
Simulator and hardware.
- Simulator: plain JavaScript on HTML canvas, no game engine. The breast tissue, cutting, smoke and diathermy sound are all generated procedurally.
- Laptop server: a Flask server runs our Python model and drives the Arduino over USB serial. The iPad connects to it over Wi-Fi.
- LED: the Arduino sketch mixes the colour with PWM. It turns the LED off automatically if commands stop arriving.
Challenges we ran into
- Data leakage. Spectra from one patient look alike, so a random split inflates accuracy. Patient-grouped splitting and a shuffled-label control kept the data clean.
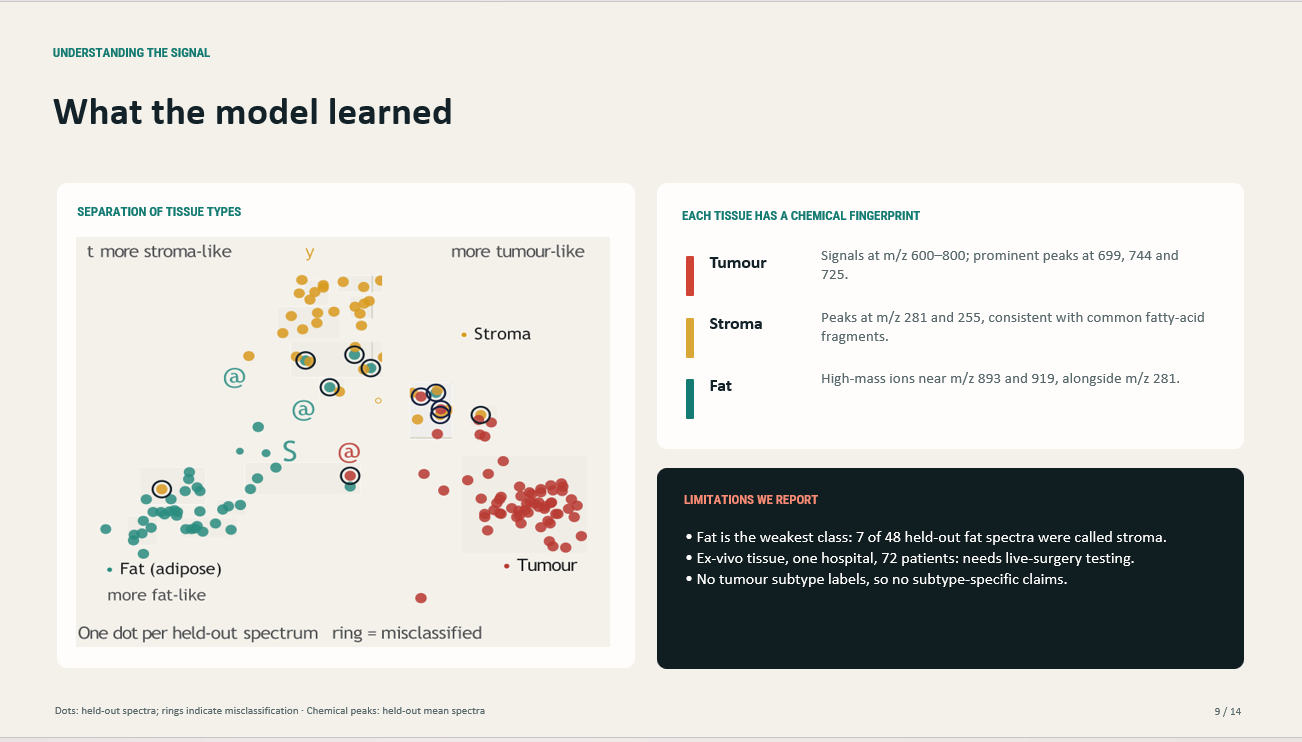
- Fat vs. stroma. Our weakest spot: 7 of 48 held-out fat spectra were called stroma.
- Missed tumours. 4 of 65 tumour spectra were misclassified. We added a confidence cut-off and found that all four scored below 0.77. The system would have said "uncertain", never "healthy".
- Making it read as smoke analysis, not image detection. Our first demo looked like an MRI scanner. We rebuilt it around a surgeon's side view, with visible smoke flowing into a sampler.
What we learned
- Validating by patient matters more than squeezing out another point of accuracy.
- Simple linear models are fast, explainable and hard to beat on small medical datasets.
- A model that knows when to say "I'm not sure" is safer than one that is always confident.
- The chemistry is visible: tumour smoke is strongest in the phospholipid range around $m/z$ 700, stroma around $m/z$ 255 and 281, and fat in high-mass ions near $m/z$ 893 and 919.
What's next
- Live surgery: testing on smoke recorded during real operations, not removed tissue.
- More patients and hospitals, to check the model holds up beyond one centre.
- Cancer subtypes: checking performance on different types of breast cancer.
SmartScalpel is a research simulation, not a medical device.

Log in or sign up for Devpost to join the conversation.