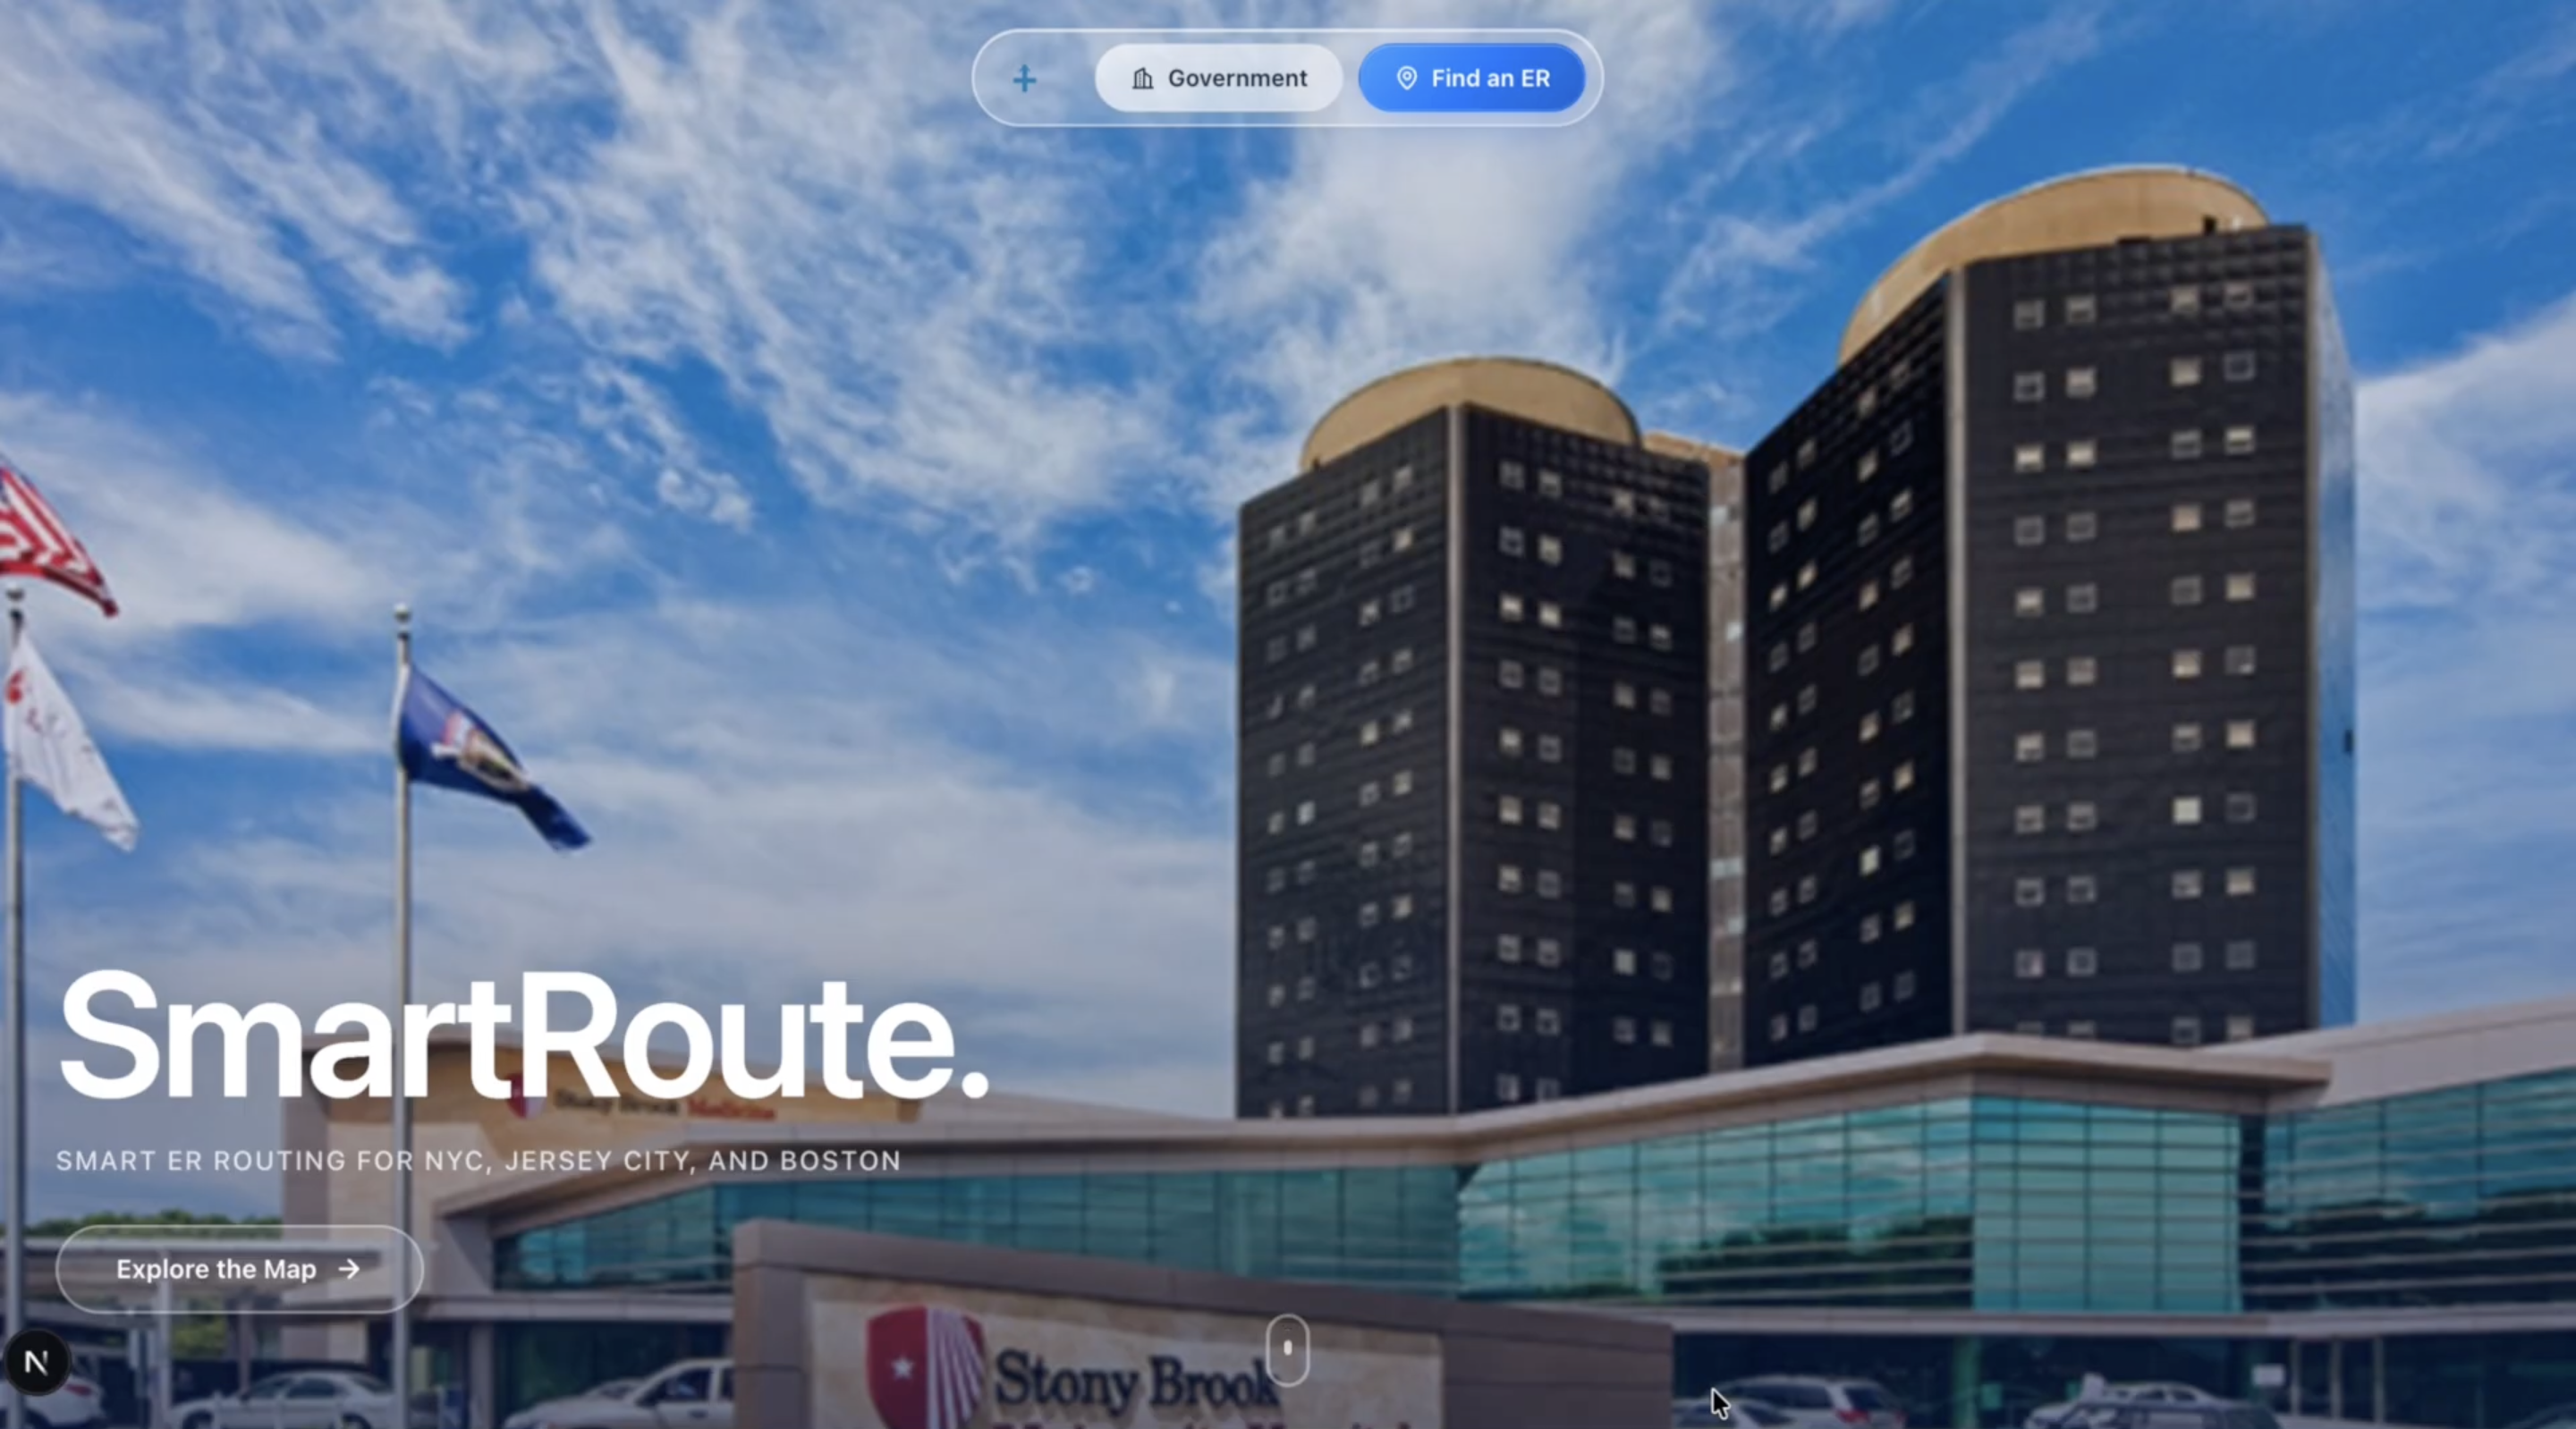
SmartRoute
What inspired us
Emergency care is a race against time, but “nearest hospital on the map” is rarely the same as “best hospital right now.” Traffic, ER backlog, and whether a facility can handle a given complaint all change the answer. At the same time, cities struggle to justify where to add capacity: a new ER shifts catchment for everyone nearby, yet planners often reason from static maps instead of flow.
SmartRoute grew from that gap: help people reach the right ER faster using live routing and triage-aware scoring and give public-sector users a credible ER planning sandbox place, a blueprint site, simulate how demand redistributes, and export evidence for memos. We focused on New York City, Jersey City, and Boston as dense, data-rich metros where these tradeoffs show up every day.
What we learned
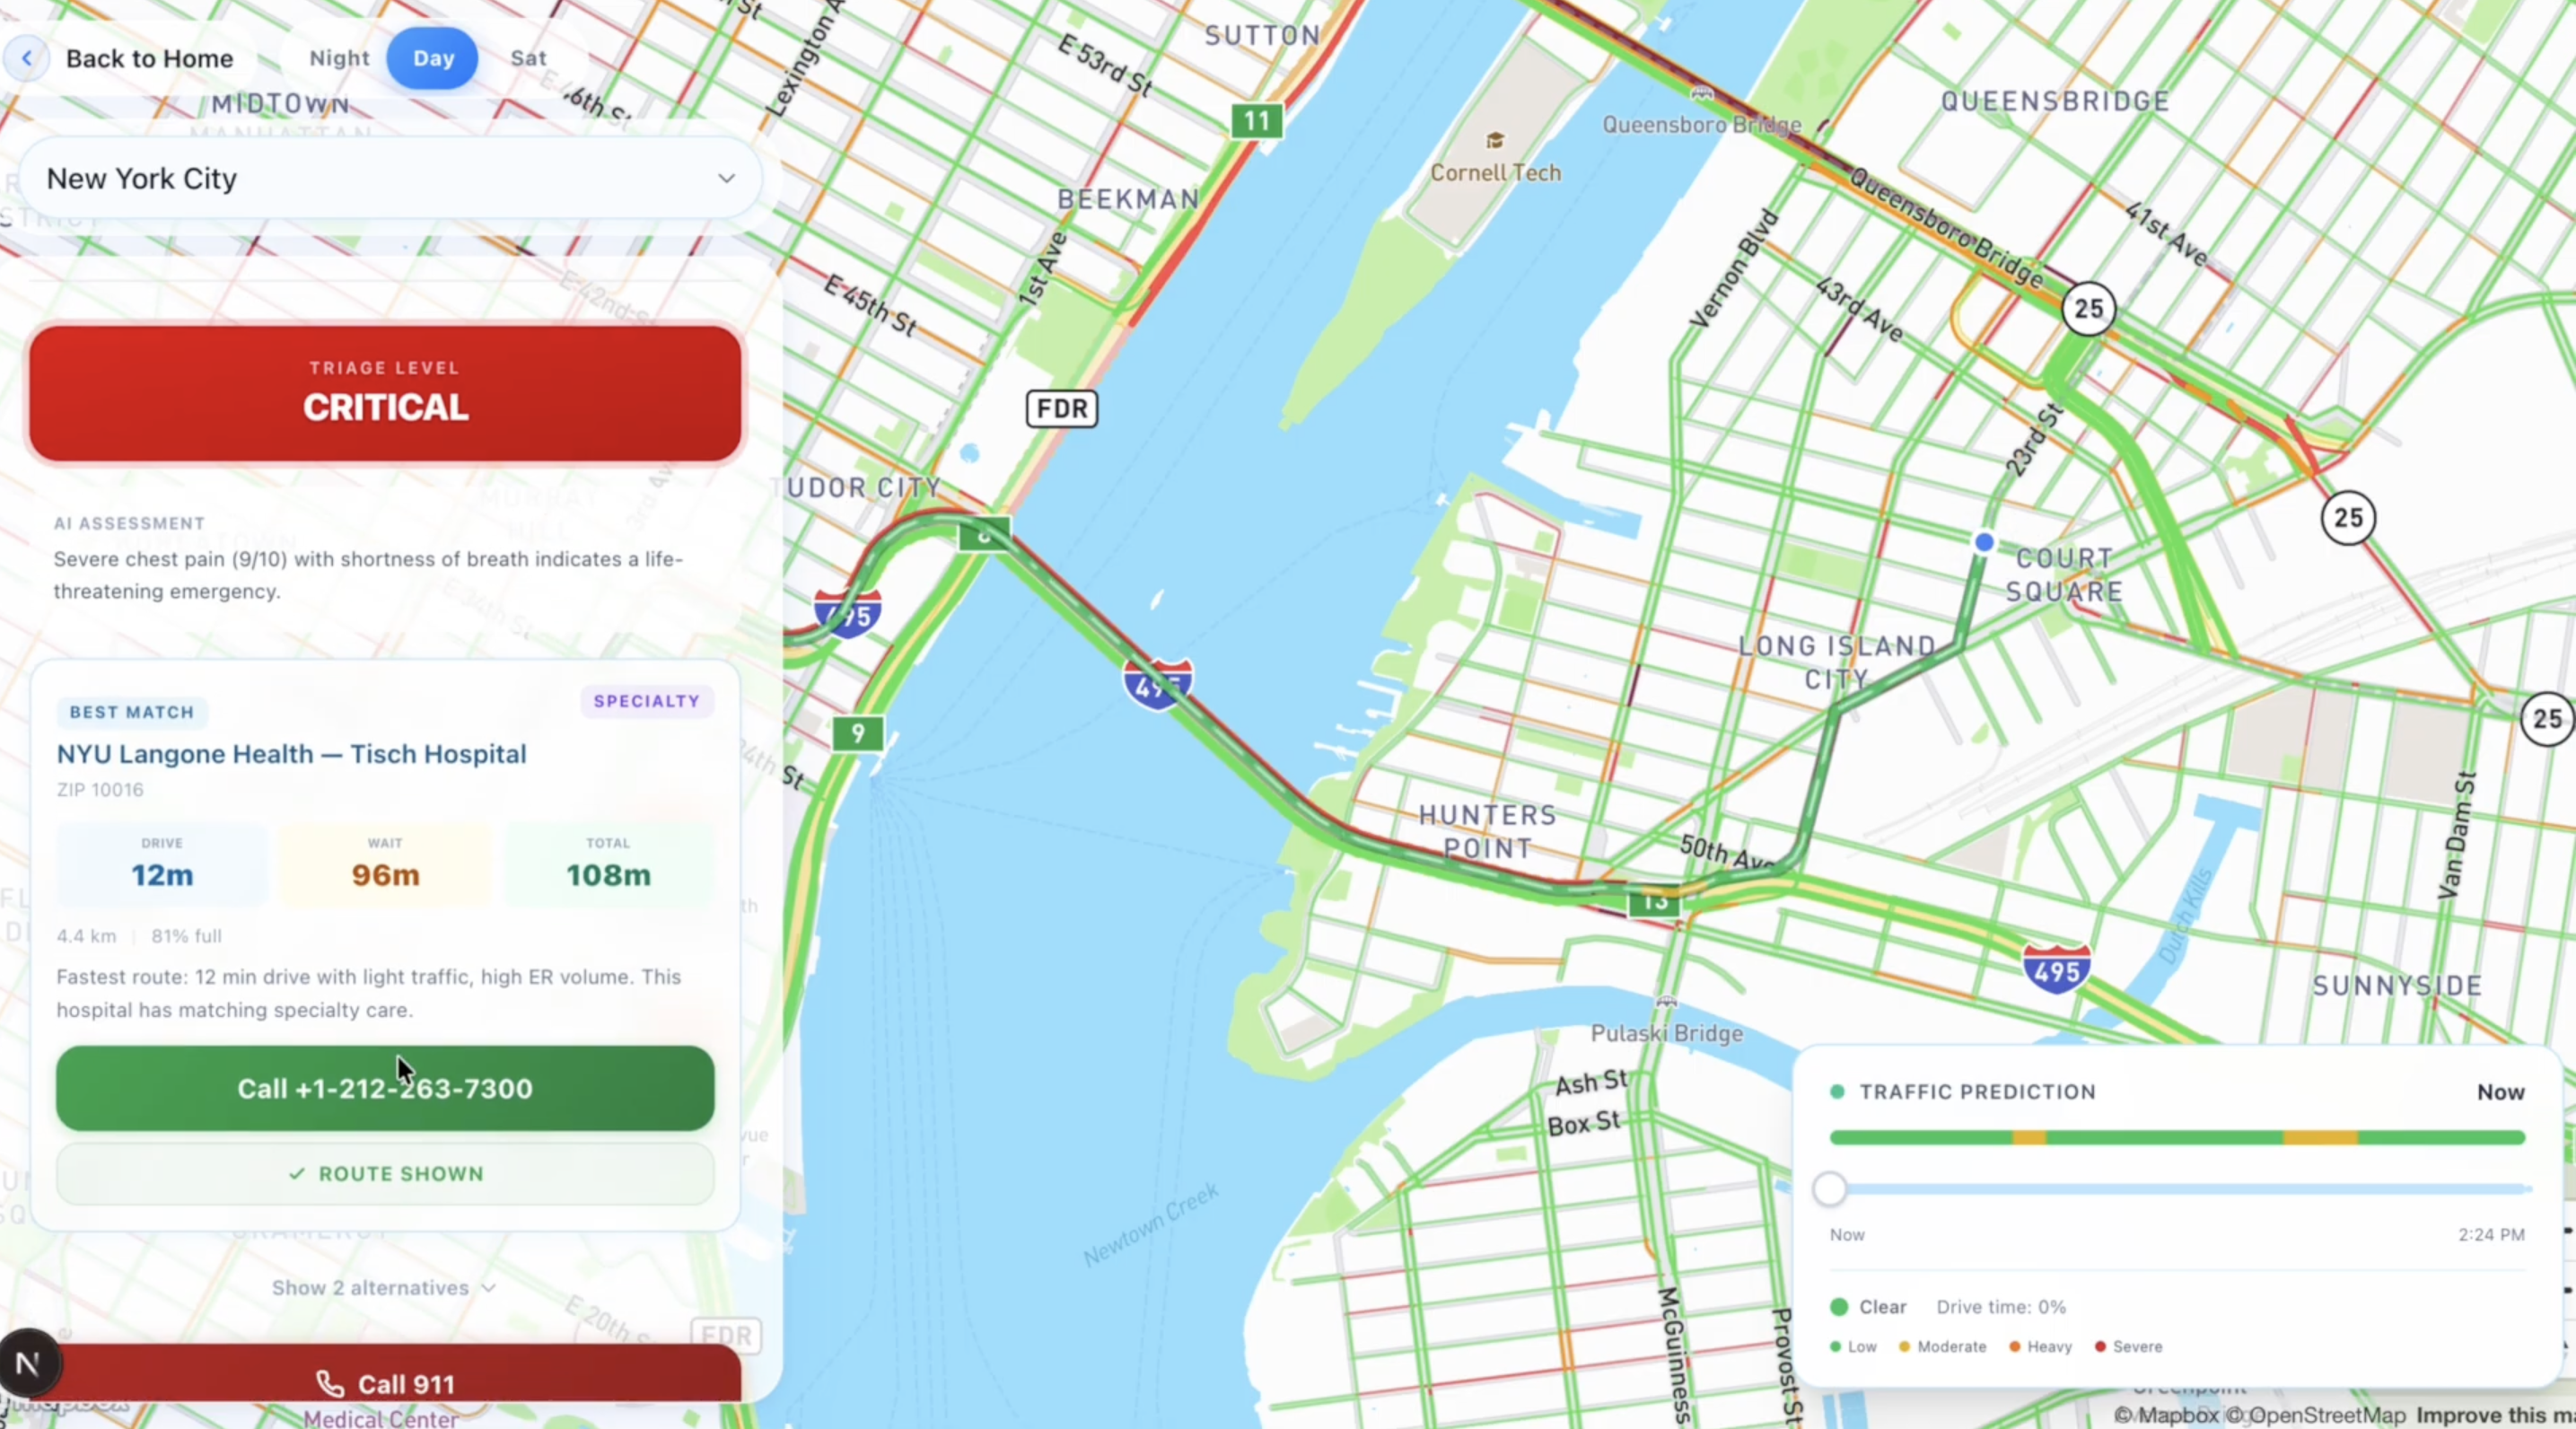
- Routing is a multi-objective problem. Minimizing drive time alone ignores wait and overload; minimizing wait alone can send people on unrealistic cross-town drives when seconds matter. Severity should change the balance. Critical cases weigh time-to-door heavily; non-urgent cases can tolerate more travel for shorter waits.
- Maps are a trust surface. Users forgive rough AI copy; they do not forgive a misleading line on a map. Traffic-aware geometry from a real directions API mattered as much as the score under the hood.
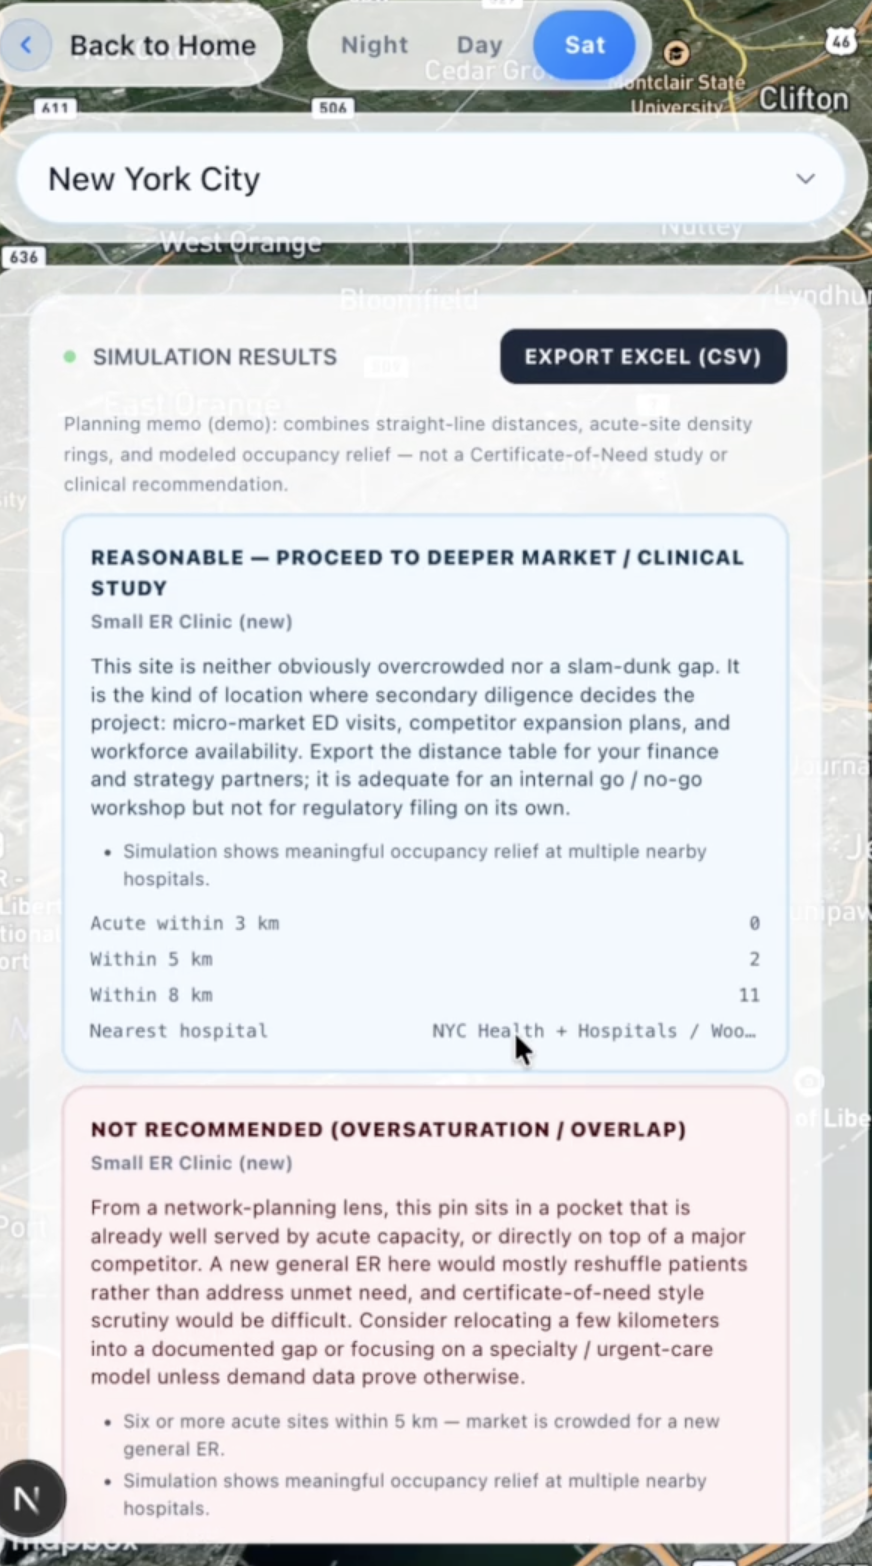
- Government mode is storytelling with geometry. Voronoi-style partitions and heatmaps turn abstract “coverage” into something planners can see and challenge before ground is broken.
- Demos need guardrails. Clear disclaimers that this is not a substitute for 911 are non-negotiable when you touch emergency routing.
How we built SmartRoute
Stack and layout
We shipped Next.js (App Router) with TypeScript and Tailwind CSS. The UI is organized around civilian and government experiences that share the same Mapbox GL map: 2D/3D views, custom layers for congestion and routes, and day/night/satellite basemap switching. Framer Motion handles transitions and micro-interactions; React Three Fiber and Three.js power the optional 3D building editor. API routes validate bodies with explicit checks (e.g. vitals ranges and required symptom flags for triage) before calling downstream services.
Backend: Route Handlers and data
Server logic lives in Next.js Route Handlers under app/api/. The Clearpath flow splits responsibilities across small endpoints: hospitals and congestion snapshots, triage classification, conversational intake, batch routing, and simulation. MongoDB stores per-city hospitals and congestion_snapshots; if a city has no seed data, we fall back to mock hospital and occupancy data so demos still run end-to-end.
Find ER & AI triage
Google Gemini drives two paths: a structured triage classifier (vitals + symptom flags → severity + short reasoning as JSON) and a multi-turn chat intake that follows a strict system prompt short questions, then a hidden TRIAGE_RESULT line the client parses so routing can start without exposing JSON in the user-visible reply. Deepgram is wired through dedicated transcribe and speak API routes so voice input and TTS stay server-side behind your keys.
Maps and driving time
We call Mapbox Directions (driving-traffic) with full GeoJSON geometry and congestion annotations so the map can draw the real road path, not a straight line, and reflect traffic where the API does. Requests run in parallel per candidate hospital; if Directions fails, we fall back to a haversine estimate and a simple two-point line so the UI never dead-ends. Drive and wait times are further adjusted with temporal heuristics (time-of-day patterns) so rush hour and off-peak behave differently in the score.
Routing Algorithm
The smart routing algorithm scores each hospital using a weighted formula:
score = w_drive * drivingTime + w_wait * adjustedWaitTime + w_occ * occupancyPenalty + w_spec * specialtyMismatch
Lower scores rank higher. Weights are severity-specific (critical vs urgent vs non-urgent): critical flows emphasize drive time and specialty match; non-urgent flows lean more on wait and occupancy. Specialty mismatch comes from mapping reported symptoms to expected hospital capabilities (e.g., cardiac, trauma). The occupancy penalty ramps up past a utilization threshold. Mapbox Directions supplies the driving-time and route geometry inputs to this function.
Government mode and ER planning
Government mode sends proposed ER sites (blueprints on parcels) to a simulation endpoint. Server-side code loads hospitals and latest occupancy, runs a distance-decay model over existing facilities (nearby sites feel the largest diversion of notional patient flow), and returns before/after metrics plus per-site reports. We pair that with Turf.js for geospatial helpers and export paths that produce CSV-friendly output for planning workflows. Heatmaps and flow visuals on the map communicate how catchment shifts when a new ER is dropped on the canvas.
Challenges we faced
- Objective tuning: Getting weights that feel right across critical / urgent / non-urgent required iteration; the math is clean, but the coefficients encode policy judgment, not physics.
- Live APIs and demos: Keys, quotas, and latency for maps, LLMs, and voice pipelines had to be handled gracefully so the UI stays usable when a service hiccups.
- Truth vs. simulation Wait times and occupancy are modeled or snapshot-based in a demo; we had to be honest in copy and UX so users never confuse optimization with a clinical decision system.
- Two audiences, one map: Civilian and government flows share the same geographic mental model but different mental tasks; keeping navigation and mode switching obvious took repeated UX passes.
SmartRoute is a demonstration platform not a substitute for emergency services. For life-threatening emergencies, call 911.

Log in or sign up for Devpost to join the conversation.