-
-
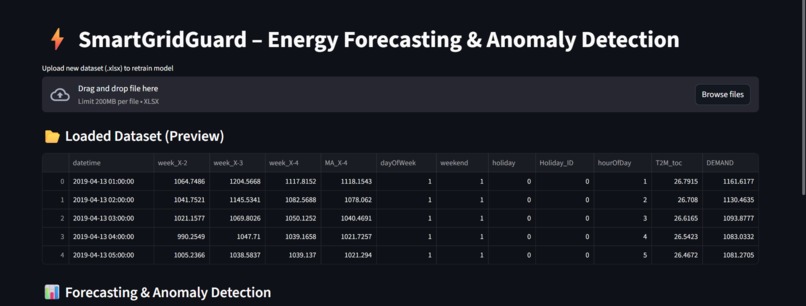
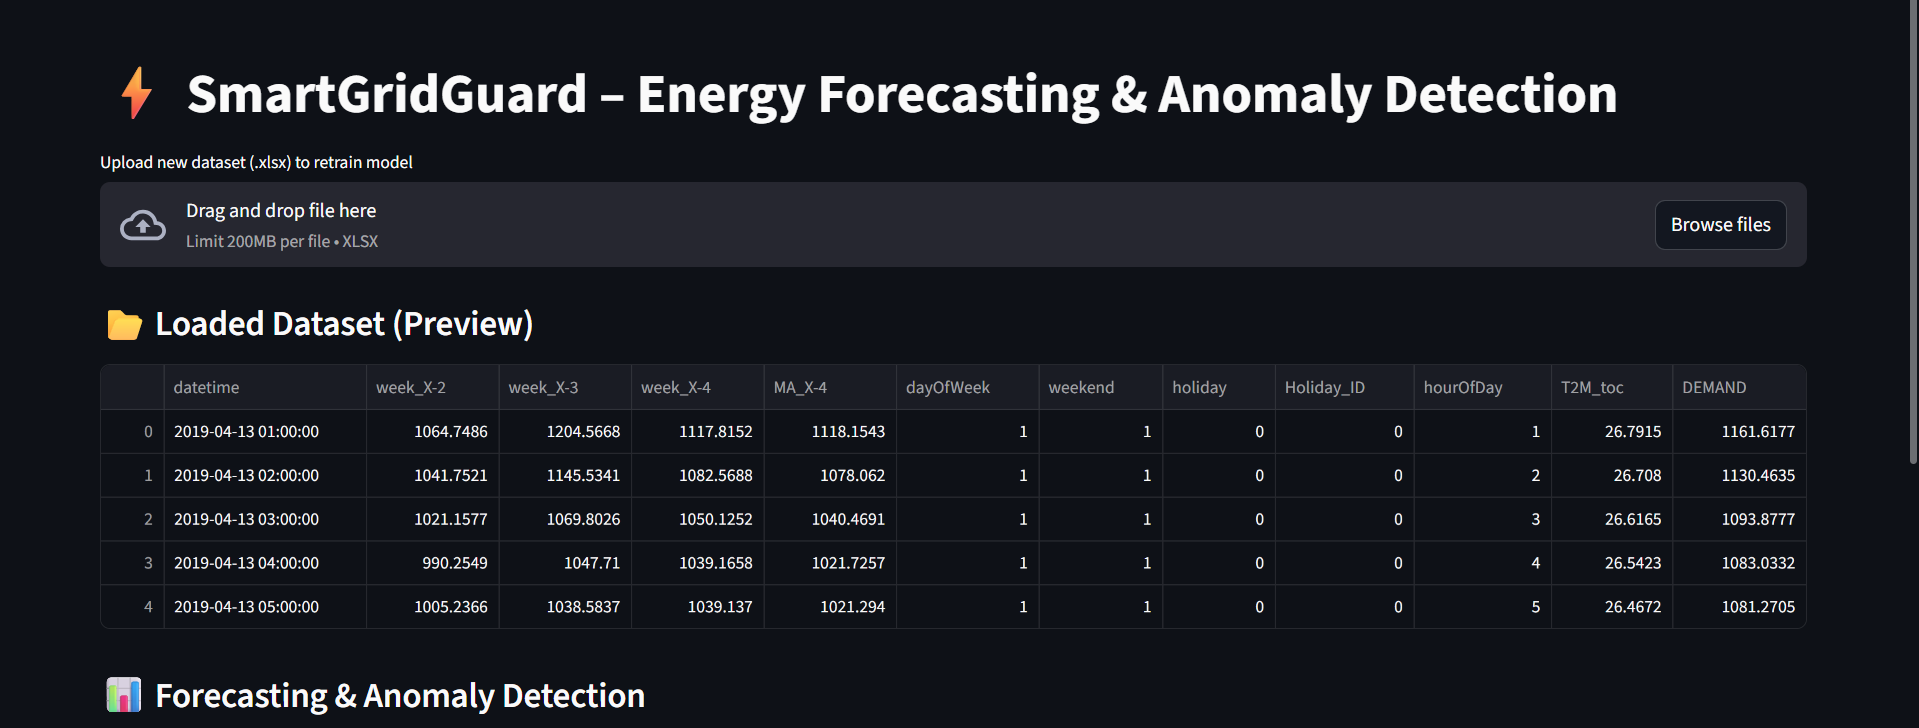
Streamlit Dashboard (default dataset)
-
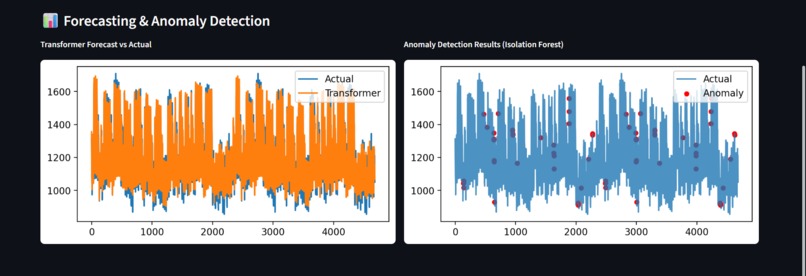
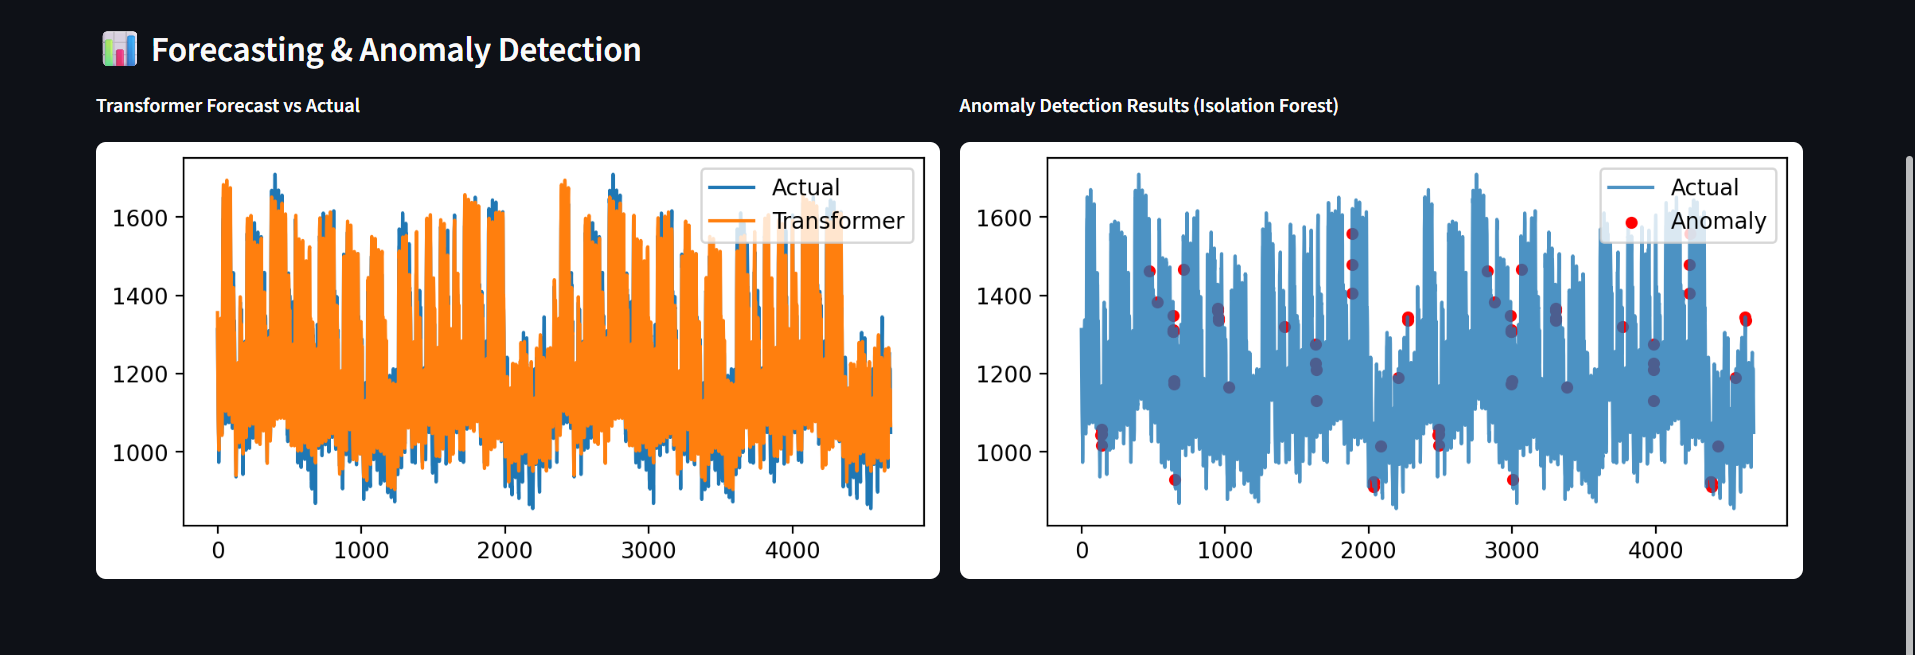
Visualise Results
-
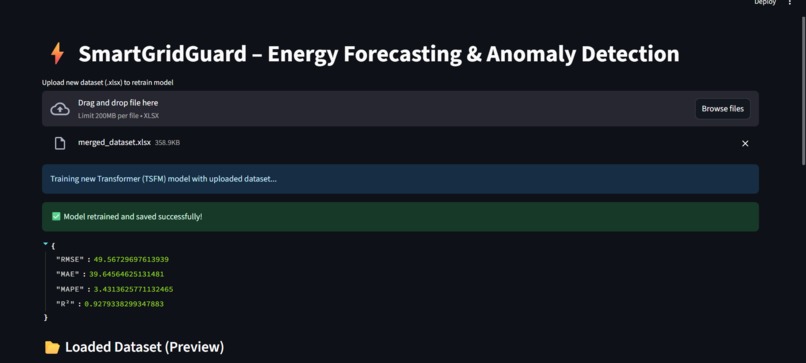
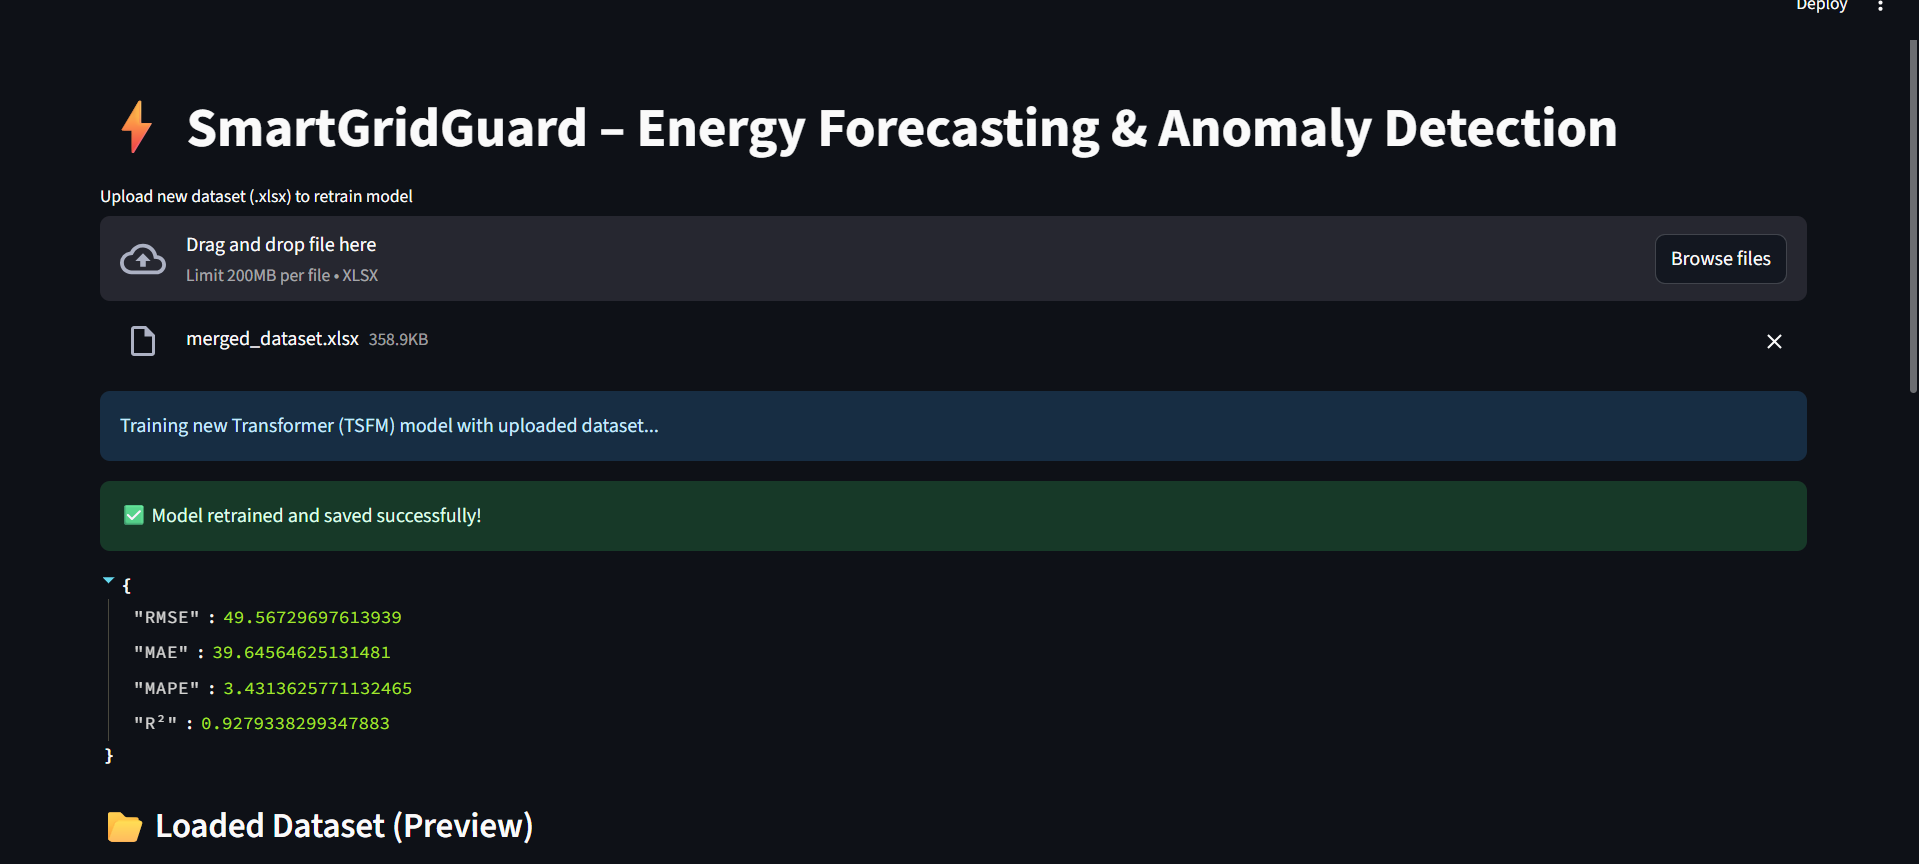
Retrain Model
SmartGridGuard: AI-Powered Short-Term Energy Load Forecasting and Anomaly Detection
Authors: Sahana Samanta, Sristi Saha
Inspiration
Buildings account for nearly one-third of global energy use and emissions. Accurate short-term energy load forecasting is crucial for balancing demand, integrating renewable energy, and preventing grid instability.
We were inspired by the idea of applying AI-based forecasting and anomaly detection to electricity consumption. The thought that our system could contribute — even in a small way — toward energy efficiency, reliability, and sustainability motivated us to build SmartGridGuard.
What It Does
- SmartGridGuard is an AI-driven forecasting and anomaly detection system designed for smart grids and building energy management.
- Uses Transformer-based time series models (TSFM) to forecast short-term electricity demand.
- Applies contextual anomaly detection using Isolation Forest on forecast residuals combined with calendar and temporal features (day of week, weekends, holidays, hour of day).
- Identifies abnormal load patterns such as spikes, drops, or unexpected behavior indicating equipment faults, inefficiencies, or unusual consumption.
- Provides a Streamlit dashboard for interactive visualization:
- Forecast vs. Actual Demand
- Highlighted Anomalies in real-time
In essence:
$$ \text{Predict} \;\; \rightarrow \;\; \text{Detect} \;\; \rightarrow \;\; \text{Visualize} \;\; \rightarrow \;\; \text{Act} $$
How We Built It
1. Dataset & Preprocessing
- Used the Electricity Load Forecasting dataset from Kaggle as the primary source of historical demand data.
- Retained contextual features:
- dayOfWeek, weekend, holiday
- Lag features: week_X-2, week_X-3, week_X-4
- Moving average: MA_X-4
- Hour of day: hourOfDay
- Weather: T2M_toc
- Dropped unnecessary identifiers like Holiday_ID to avoid data leakage.
- Data was normalized and converted into time-series sequences suitable for Transformer models.
2. Forecasting with Transformer (TSFM)
- Trained a Transformer-based model to predict short-term electricity demand.
- Configured with multiple encoder layers, multi-head attention, positional encoding, and dropout to capture temporal dependencies.
- Evaluation was done using metrics:
$$ \text{RMSE}, \;\; \text{MAE}, \;\; \text{MAPE}, \;\; R^2 $$
3. Anomaly Detection
- Residuals (difference between actual and predicted values) were computed.
- Residuals combined with contextual features (dayOfWeek, weekend, holiday, etc.) were passed into Isolation Forest.
- Applied score percentile thresholding instead of a fixed contamination rate, flagging anomalies above a chosen percentile (e.g., top 1.5%).
4. Visualization & Deployment
- Full pipeline visualized via Streamlit dashboard:
- Default Kaggle dataset integrated for evaluation
- Upload new datasets
- Run TSFM model for forecasting
- Apply anomaly detection
- View results in real time with intuitive plots (Actual vs Forecast and flagged anomalies)
Challenges We Ran Into
- Data quality & variability: Noisy and seasonal energy data makes anomaly detection tricky.
- False positives: Peaks during holidays/weekends initially looked anomalous; mitigated with contextual features (dow_sin/cos, weekend, holiday).
- Model generalization: Avoided overfitting of Transformer using dropout, validation splits, and attention-based architecture.
- Thresholding anomalies: Score percentile thresholding worked better than fixed contamination for Isolation Forest.
- Integration with Streamlit: Ensured seamless training → forecasting → anomaly detection → plotting.
Accomplishments We’re Proud Of
- Built a fully functional AI pipeline from raw energy data to anomaly visualization.
- Achieved accurate short-term load forecasting with Transformer TSFM.
- Designed a robust anomaly detection module combining residuals and context features.
- Developed an interactive Streamlit app supporting retraining, visualization, and user-friendly anomaly insights.
- Created a system deployable in real-world smart grid monitoring environments.
What We Learned
- How to integrate deep learning Transformers with classical ML anomaly detection for time series.
- Contextual features are critical: not every spike is an anomaly.
- Streamlit is powerful for rapid prototyping and visualization.
- Real-world ML systems need both predictive performance and interpretability.
- Correct handling of scaling, windowing, and inverse transforms is key in time-series forecasting.
What’s Next for SmartGridGuard
- Expand datasets: commercial, residential, industrial building types.
- We will incorporate pre-trained TSFM when datasets are provided; for now, we have demonstrated the workflow trained from scratch.
- Real-time deployment: streaming data integration for continuous monitoring.
- Explainable AI (XAI): use SHAP/feature attribution to explain flagged anomalies.
- Integration with IoT & smart meters: deploy directly in energy management systems.
- Actionable recommendations: beyond flagging anomalies, suggest corrective actions (e.g., check HVAC, reschedule equipment usage).
Built With
- github
- kaggle
- keras
- python
- scikit-learn
- streamlit
- tensorflow
- vs-code

Log in or sign up for Devpost to join the conversation.