-

Smart Saver
-
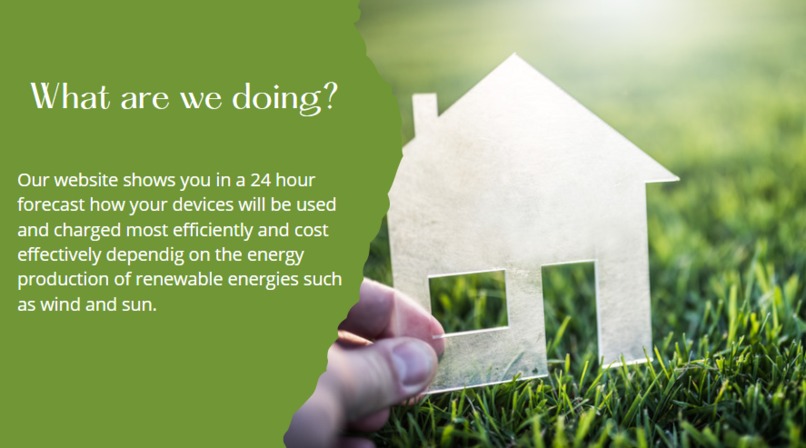
What Smart Saver does
-
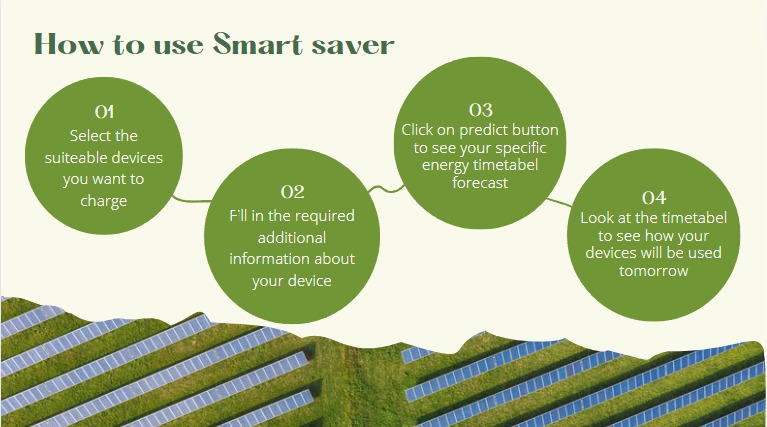
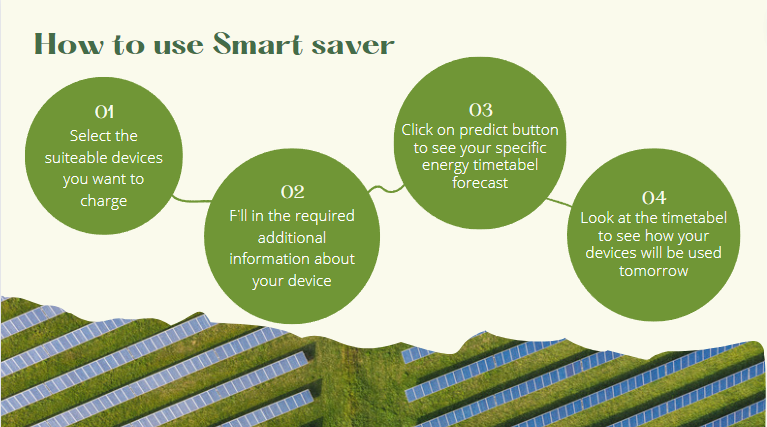
How to use Smart Saver
-

Inspiration
Our motivation is to efficiently use the fluctuating availability of renewable energy and help consumers save money. By using it smartly, we reduce our footprint in the future.
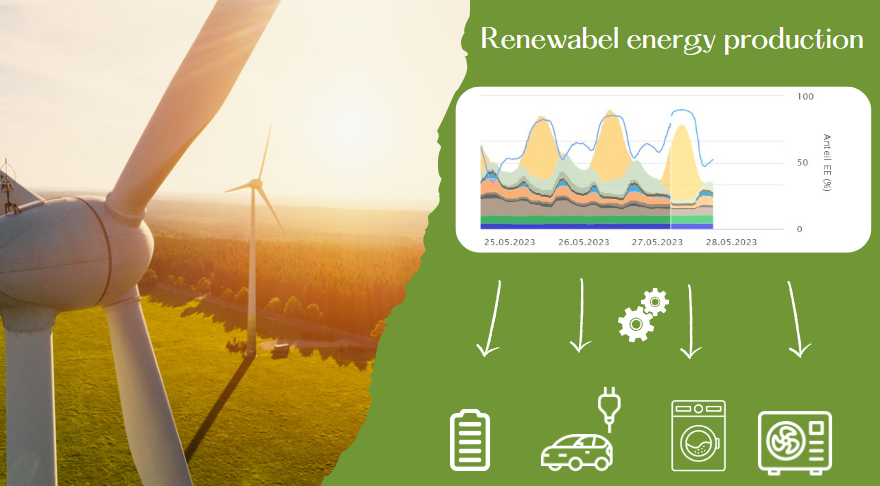
What it does
Smart Saver is a website that helps consumers save money and reduce your carbon footprint by showing individualy the best times to use renewable energy for each appliance. Our platform analyzes energy data and weather patterns to provide real-time information on when renewable energys like solar and wind power are most abundant. With Smart Saver, you get a specific timetabel for the next 24 hours about when to run your appliances, charge your electric car, heat pumps and more.
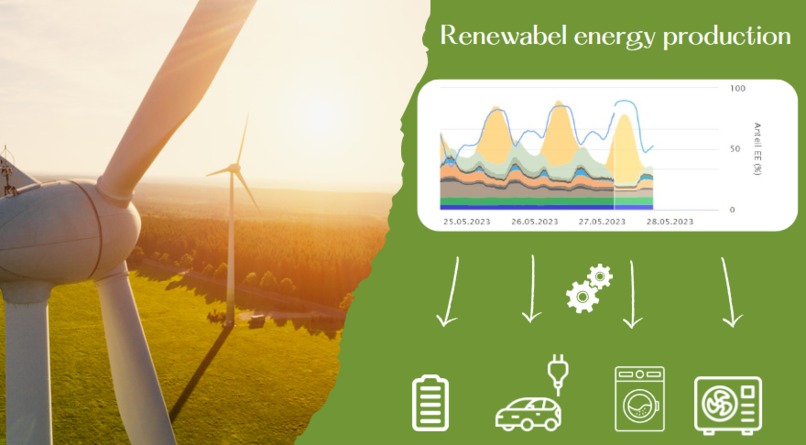
How we built it
The first step was to find data predicting the renewable energy availability in the future (within 24 hours). Using the data and our knowledge about household consumption patterns we developed a model describing the optimal consumption times. We developed a helpful website which is easy to use by anyone interested in optimizing their energy usage. For that we used the Blazor framework.
Challenges we ran into
Starting from scratch it was a huge challenge to define the problem and find a suitable mathematical solution. It was also a challenge to combine the different skills of our team members, who also had experience with very different programming languages and frameworks, into one joint code.
What we learned
First of all we all learned a lot about the field of renewable energies. Then, we learned to work a little outside of out comfort zone. We were a very interdisciplinary team and were able to learn a lot from each other through good communication.
How is Smart Savers future
We hope to be an inspiration for further work in this area. Tools like Smart Saver are a simple way to raise awareness of the possibilities that lie in renewable energy and sustainable energy consumption. It could be extended by making predictions for more than one day into the future, adding more details and connecting the tool directly to the devices.
Built With
- c#blazor
- https://api.energy-charts.info/#/
- https://open-meteo.com/en/docs
- python

Log in or sign up for Devpost to join the conversation.