-
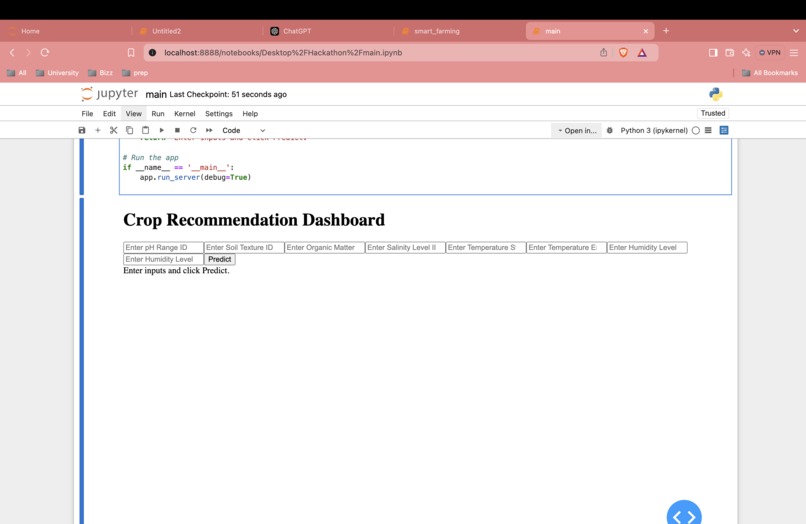
Dashboard
-
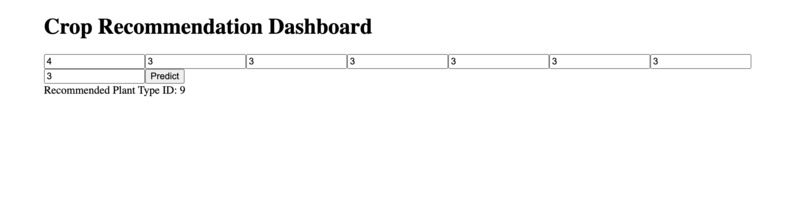
Results
-
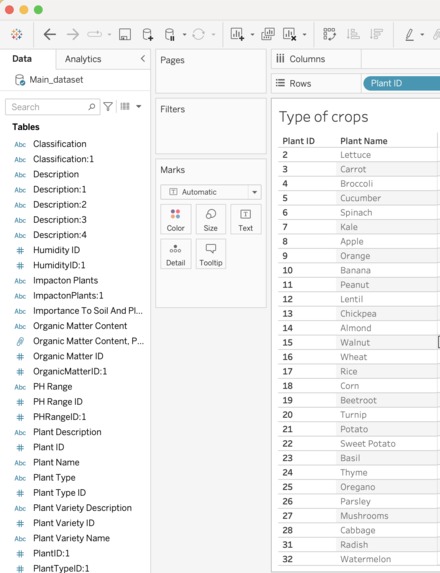
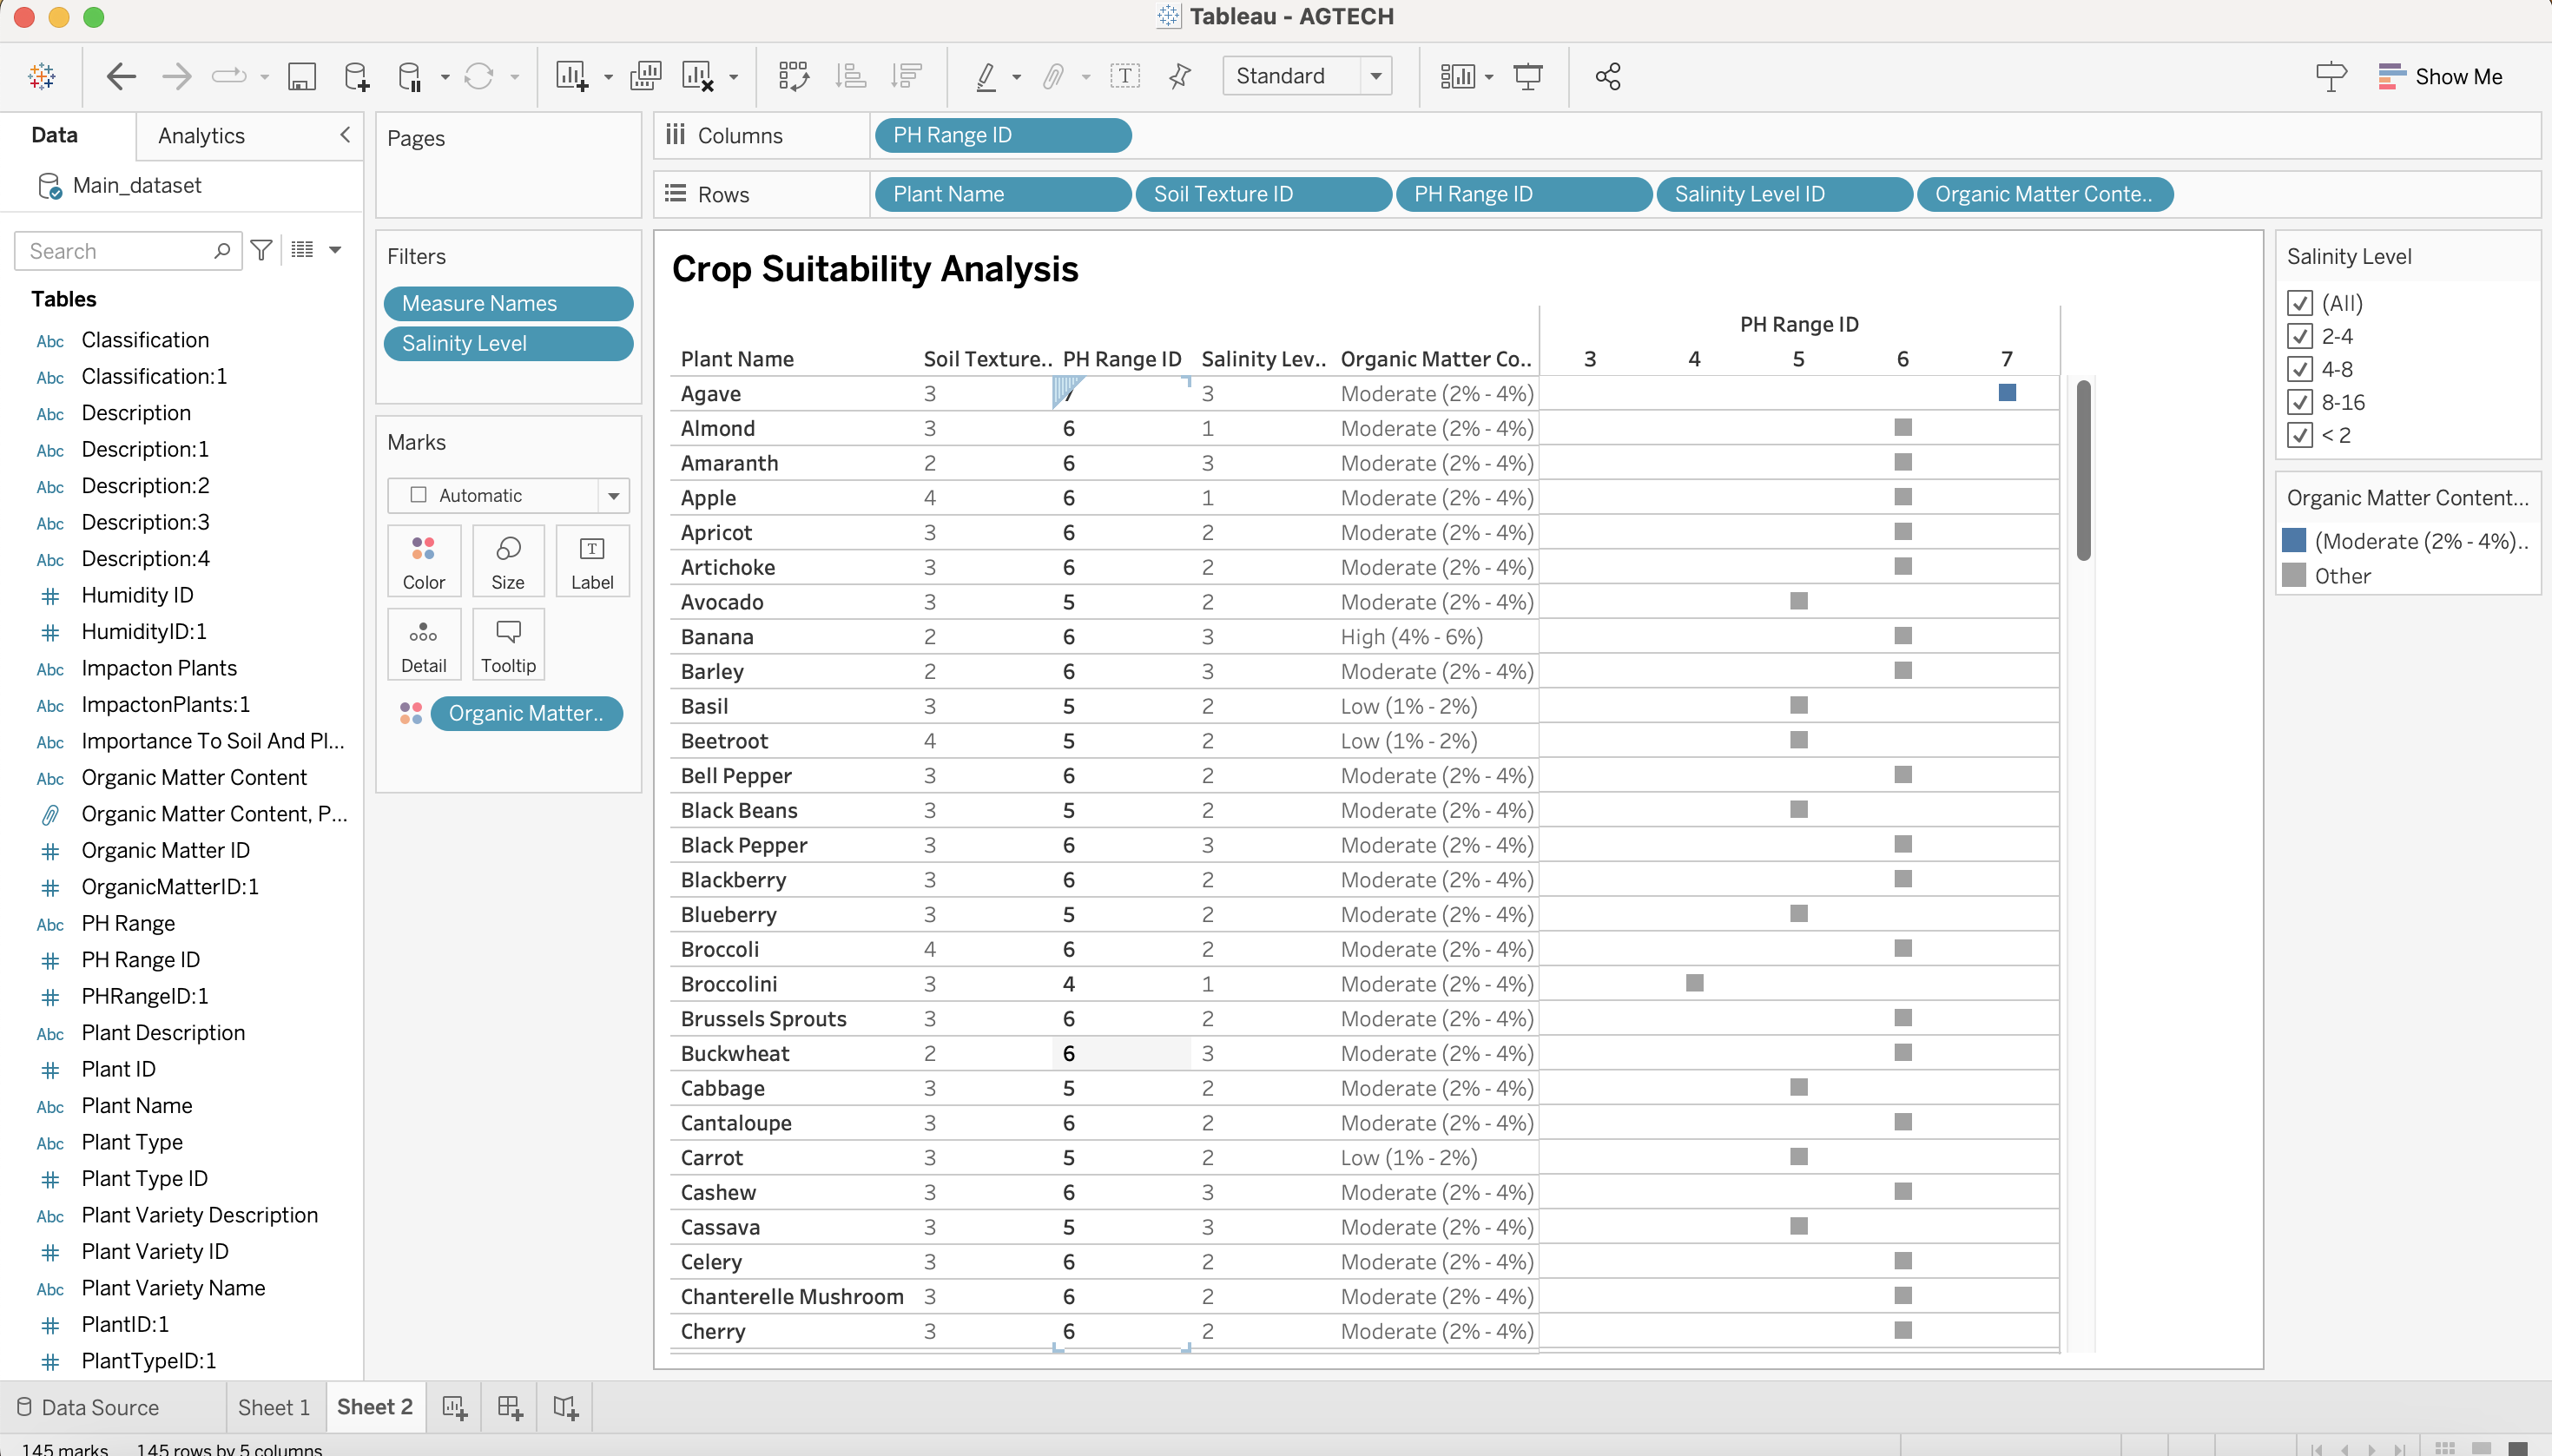
Crop names
-
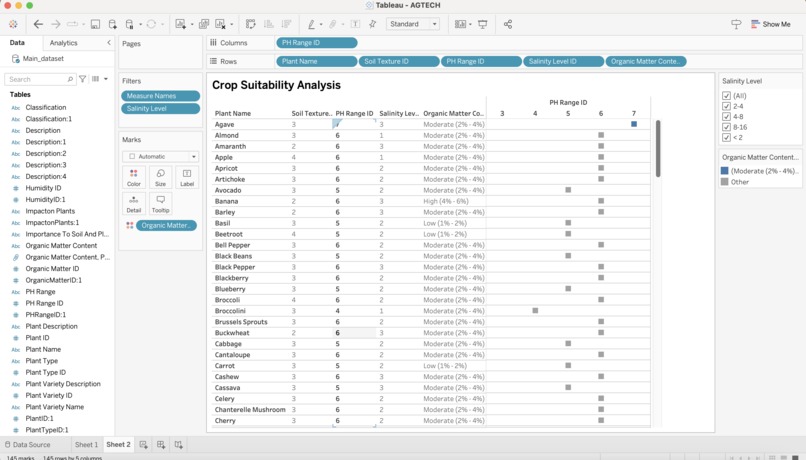
Crop recommendation stats


Inspiration The need for sustainable agriculture inspired us to create a data-driven tool to optimize crop yields and resource usage amidst climate challenges.
What It Does Our solution combines a Tableau dashboard and a Dash-based predictive tool to recommend crops based on soil and climate conditions, visualize critical factors, and provide actionable insights for smarter farming.
How We Built It
- Cleaned and prepared data in Python.
- Created an interactive Tableau dashboard for visualizing soil and crop suitability.
- Built a Dash app with a predictive model to recommend crops based on user inputs.
Challenges
- Cleaning and structuring messy data.
- Optimizing the prediction model for accuracy.
- Designing a user-friendly interface for non-technical users.
Accomplishments
- Developed an intuitive tool that combines analytics and visualization.
- Empowered farmers with actionable, data-driven insights.
What We Learned Clean data and intuitive design are key to delivering impactful solutions for non-technical users.
What's Next
- Integrate IoT for real-time updates.
- Add weather forecasting and mobile accessibility.
- Expand metrics for a holistic smart farming solution.
Built With
- database
- machine-learning
- python
- tableu

Log in or sign up for Devpost to join the conversation.