-
-
Thumbnail
-

Water Distribution Network
Inspiration
Our infrastructure networks determine our quality of life and right now we have the best opportunity to spend our dollars efficiently as we build and repair our water network, our roads and our electric networks.
What it does
It captures the relationships and knowledge within a water network and a road network. The data model will permit the additional integration between those two networks.
How we built it
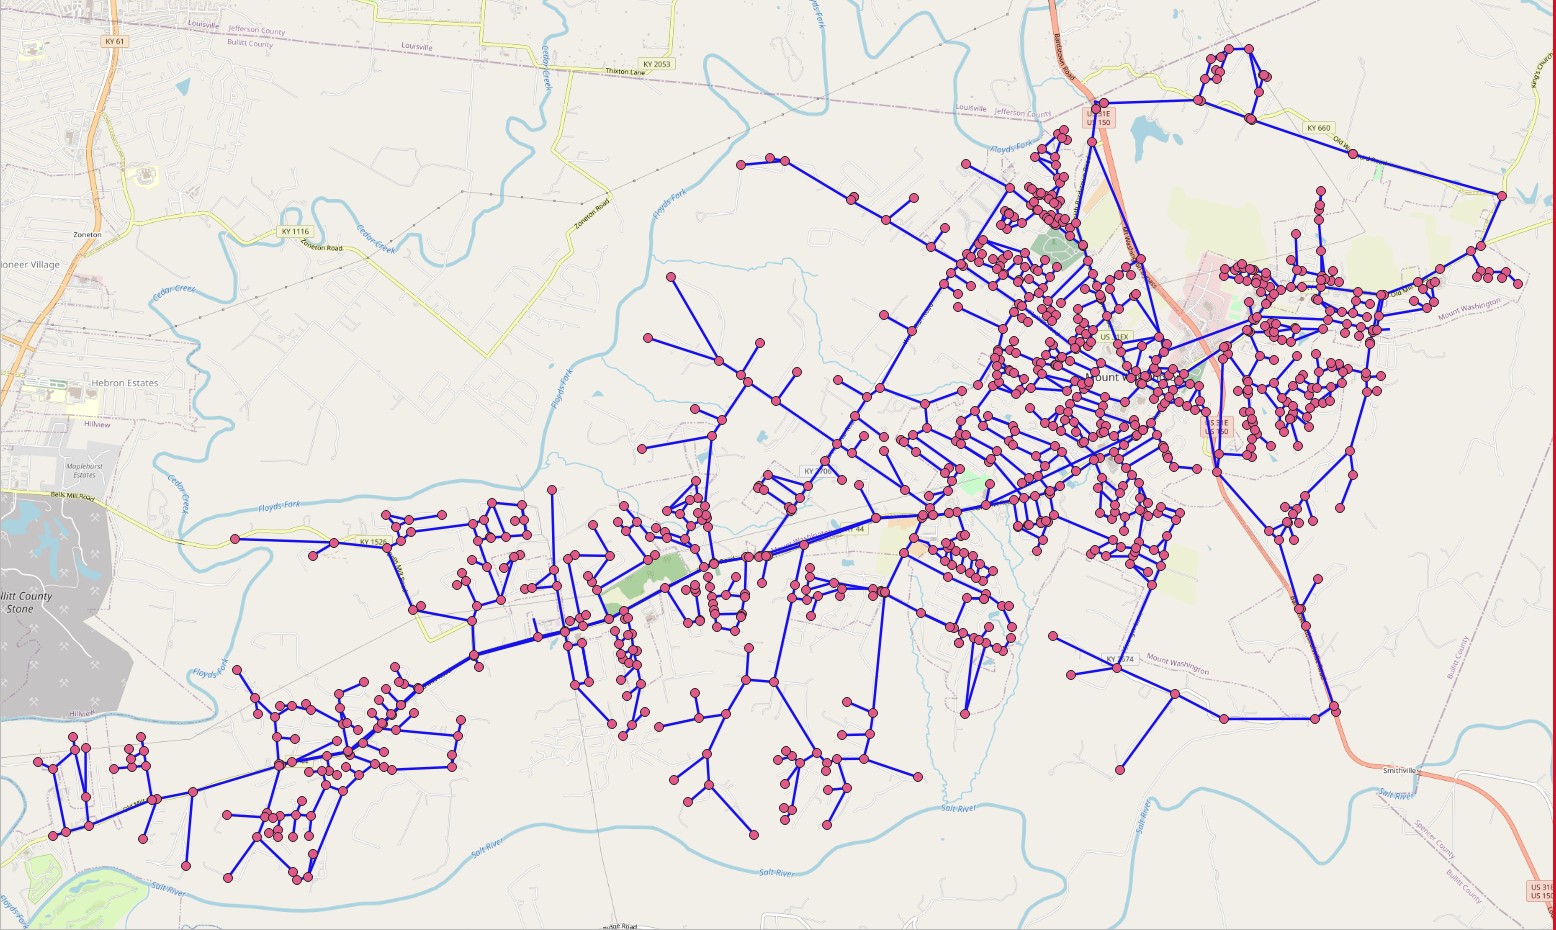
We used publicly available realistic water network data for a town in Kentucky and road network data for the entire state of Kentucky. We developed the graph data models using the Tigergraph Studio and loaded data into the Vertices and the edges. Then we developed GSQL queries to answer decision support related queries such as what the roads nearest to a point of interest and what are other nearby points of interest. For the water distribution network, we developed a query to find all routes between a tank and a consumer location.
Challenges we ran into
Our first data model for the water distribution network was incorrect. We modeled pipes as edges (relationships) at first because the physical network can be also drawn as a graph with pipes are edges. We then realized that such representation has nothing to do with graph database abstraction. We then modeled the tanks and pipes as vertices and redid all the queries.
Accomplishments that we're proud of
We loaded close to a thousand vertices in the water network graph, and many thousand vertices from the entire Kentucky road network.
What we learned
Using graph databases requires a different mindset but the payback is well worth the price.
What's next for Smart Connected Infrastructure
Our prototype provides a solid foundation for the creation of a new generation of spatial asset networks that were previously built on relational databases. Our approach will support the organization of both within-asset network hierarchies and between asset network relationships.
Built With
- gsql
- tigergraph

Log in or sign up for Devpost to join the conversation.