-
-
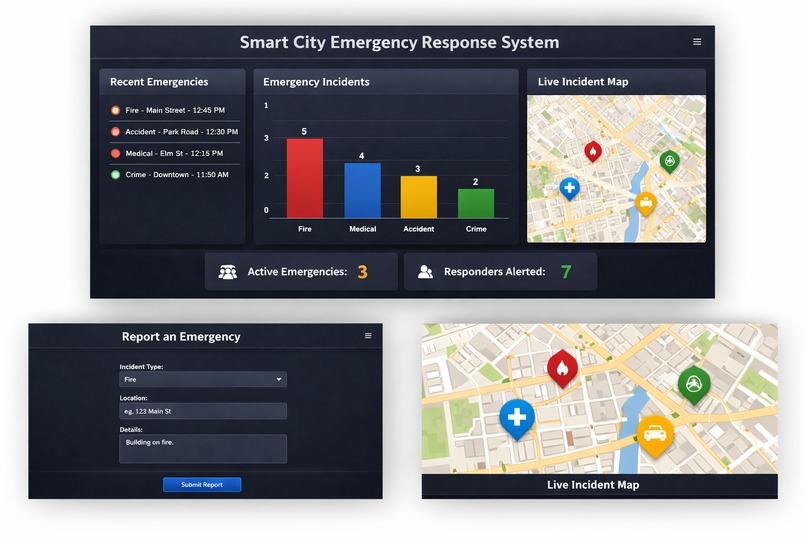
Real-time emergency reporting and dashboard with live map and analytics.”

Inspiration
Cities need faster emergency response systems. Many emergencies (fire, medical, accidents) waste critical time due to slow reporting. We wanted a system that instantly reports incidents, alerts responders, and visualizes data in real-time.
What it does
Allows users to report emergencies in real-time, automatically notifies nearest responders, and provides dashboards and maps to track incidents and improve city safety.
How we built it
Backend: FastAPI for REST API endpoints (/report-emergency, /recent-emergencies)
Frontend: Streamlit for interactive dashboards, graphs, and maps
Visualization: Matplotlib for graphs, PyDeck for maps
Data Storage: In-memory Python lists (can be upgraded to a database)
Challenges we ran into
Challenges we ran into
Integrating FastAPI backend with Streamlit frontend
Ensuring real-time updates in the dashboard
Handling map visualization and emergency type color coding
Accomplishments that we're proud of
Fully functional real-time emergency reporting system
Interactive dashboard and map visualization
Easy-to-use dark-themed UI
Works on both desktop and mobile
What we learned
How to connect a backend API with a frontend in Python
Real-time data visualization techniques
Designing a user-friendly emergency reporting system
What's next for Smart City Emergency Response System
Add database storage for historical data
Implement notification system for responders
Deploy to cloud for city-wide real-time monitoring
Built With
- amazon-web-services
- and
- apis:
- cloud)
- emergency
- endpoints
- fastapi
- for
- languages:-python-frameworks:-fastapi-(backend)
- or
- pydeck-database/storage:-in-memory-python-list-(can-be-replaced-with-any-db)-cloud/hosting:-localhost-(can-deploy-to-heroku
- reporting
- rest
- streamlit
- streamlit-(frontend)-data-visualization:-matplotlib

Log in or sign up for Devpost to join the conversation.