-
1
-
2
-
3.1
-
3.2
Inspiration
OCHA's Country-Based Pooled Funds have financed more than 17,500 humanitarian projects. Every proposal states a budget, how many people it will reach and how long it will run. But a reviewer has no quick way to tell whether that cost is reasonable compared with genuinely similar projects.
That matters in both directions. An unusually high cost per person may mean money that could have reached more people. An unusually low cost per person often signals a beneficiary-counting problem, such as double counting or indirect beneficiaries counted as direct. The OCHA briefing stayed with us: this data represents people, often in extremely vulnerable situations. So we wanted a tool that helps reviewers ask better questions, not one that hands out verdicts.
What it does
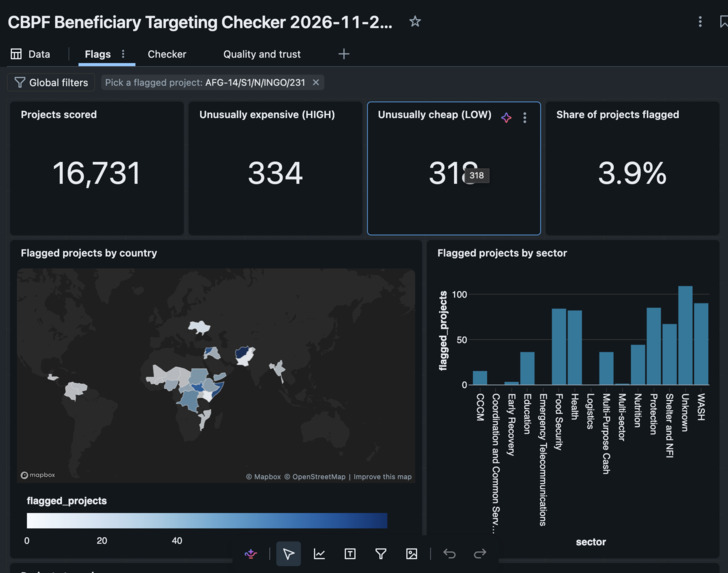
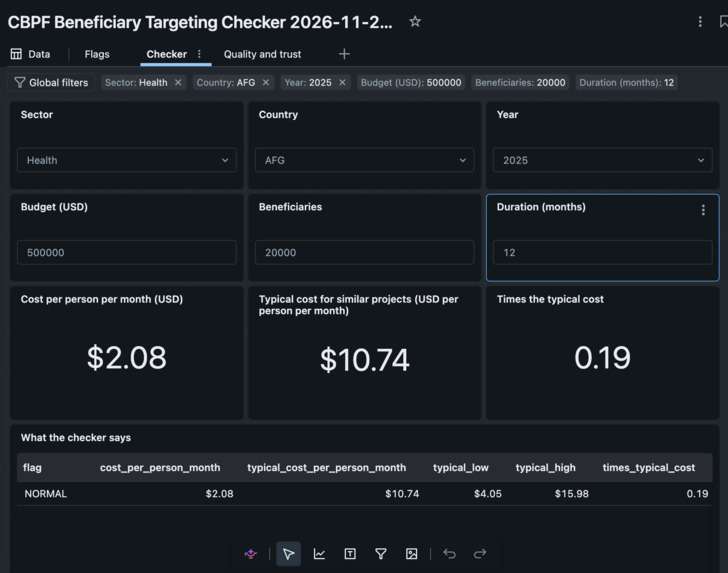
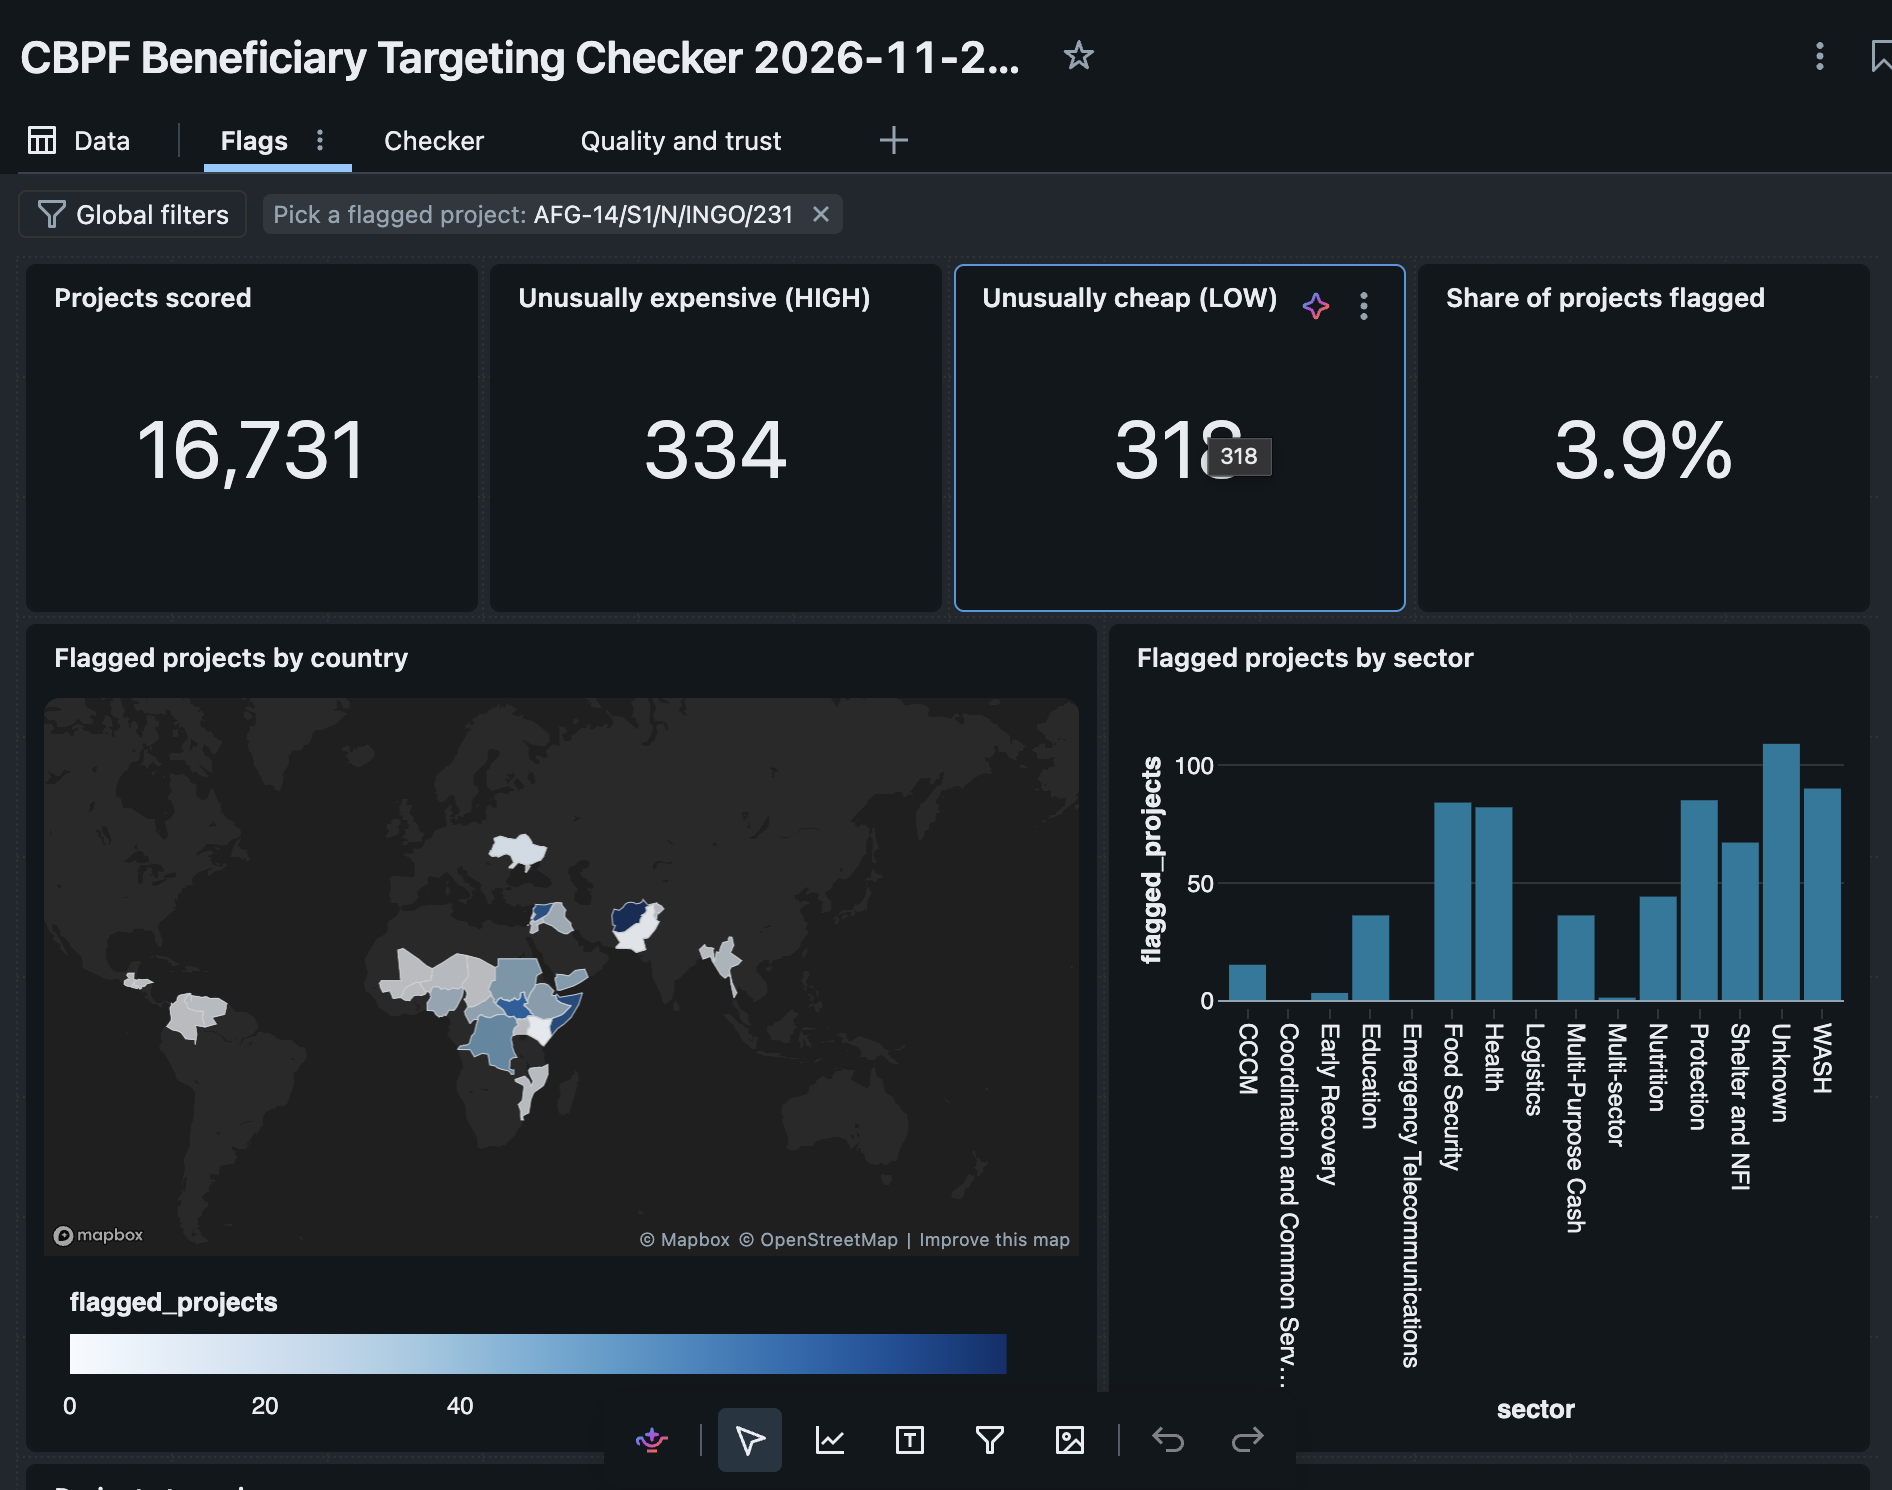
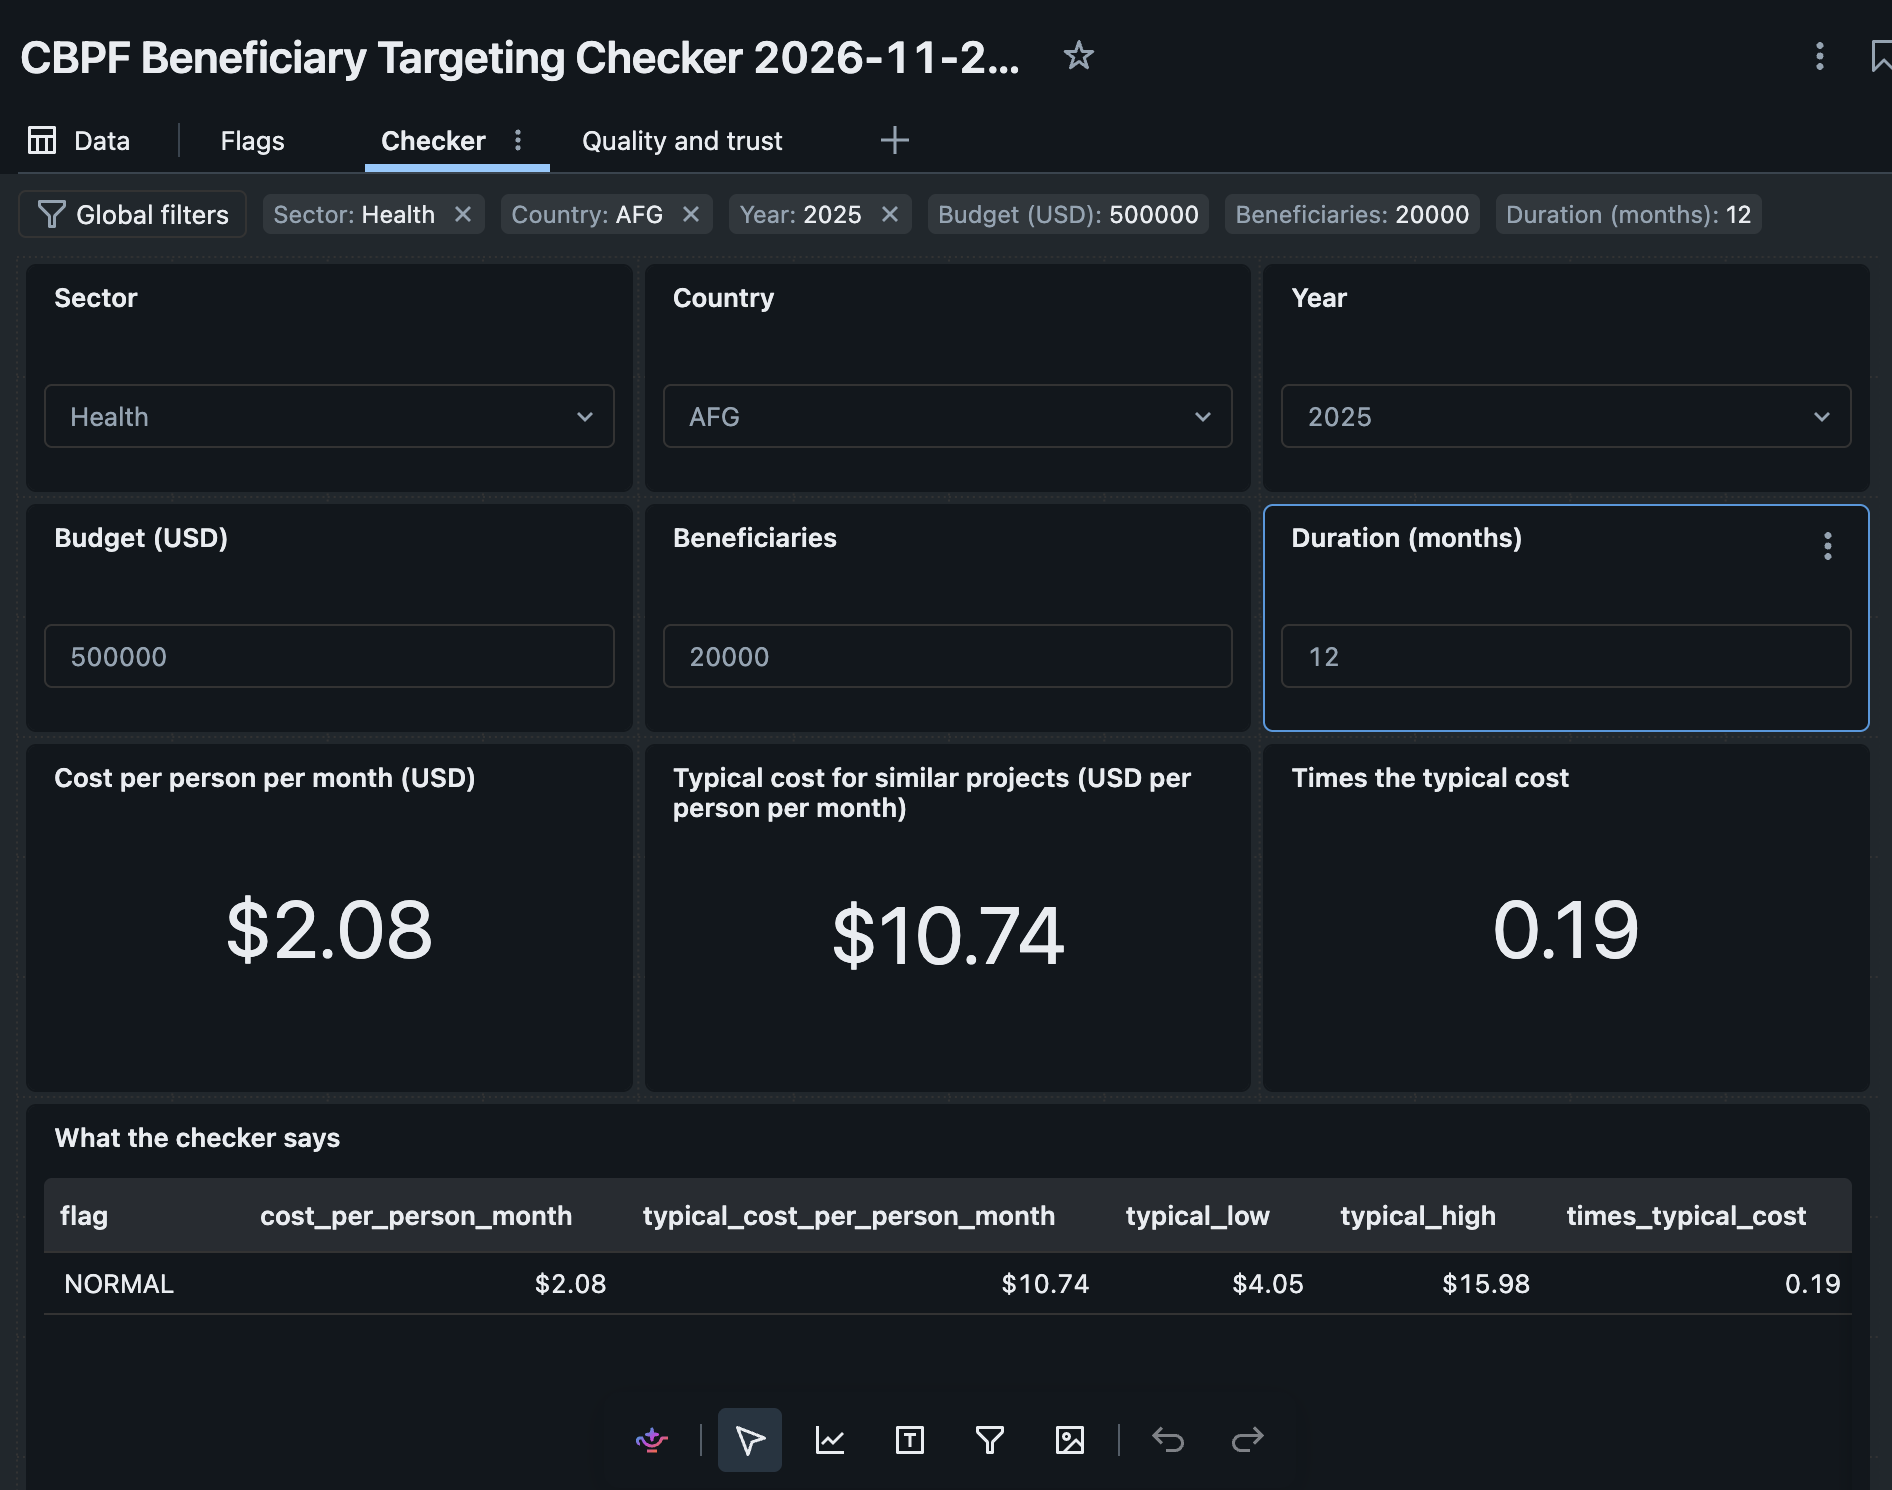
The CBPF Beneficiary Targeting Checker compares every project's cost per person per month with genuinely similar projects and flags the ones worth a second look.
$$\text{cost per person per month} = \frac{\text{budget}}{\text{planned beneficiaries} \times \text{months}}$$
For each project, a reviewer sees:
- a flag: HIGH (unusually expensive per person), LOW (unusually cheap per person, so check how beneficiaries were counted) or normal, with a confidence label and the reason for it
- answers in dollars: the typical budget, the typical range, and the budget band that would not have been flagged
- 5 comparable projects to benchmark against
- a plain-English explanation, used only if every number in it checks out against the source data
Reviewers can use an AI/BI dashboard with a proposal checker for new submissions, or ask questions in plain English through a Genie agent. An overlooked-crises view also shows where humanitarian need is high and funding coverage is low.
How we built it
We built a medallion pipeline on Databricks (bronze → silver → gold, all as Delta tables in Unity Catalog) using CBPF data from HDX, plus FTS funding, population and INFORM severity data for context.
- Like-for-like peer groups. Each project is compared only with peers in the same sector, country fund, year and partner type. When a group has fewer than 8 projects, the comparison widens step by step, and the confidence label drops with it.
- Robust scoring. We score with the median and MAD instead of the mean and standard deviation, so a few extreme projects can't distort what "typical" means: $$z = \frac{\log c - \operatorname{median}(\log c_{\text{peers}})}{1.4826 \cdot \operatorname{MAD}(\log c_{\text{peers}})}$$
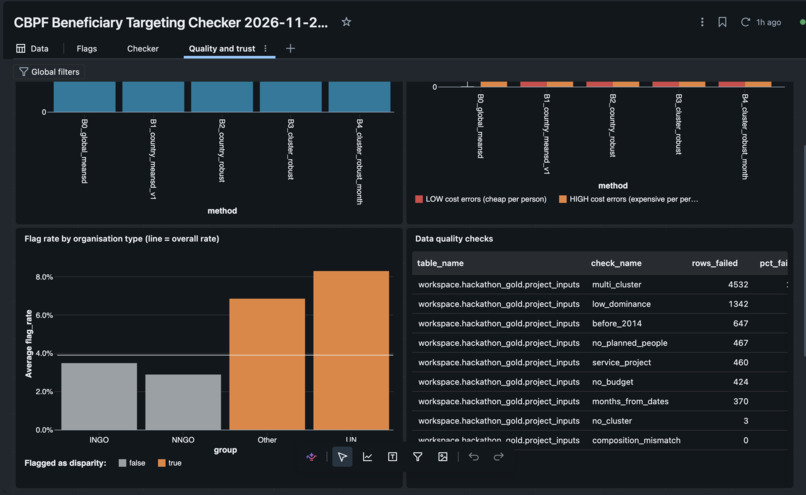
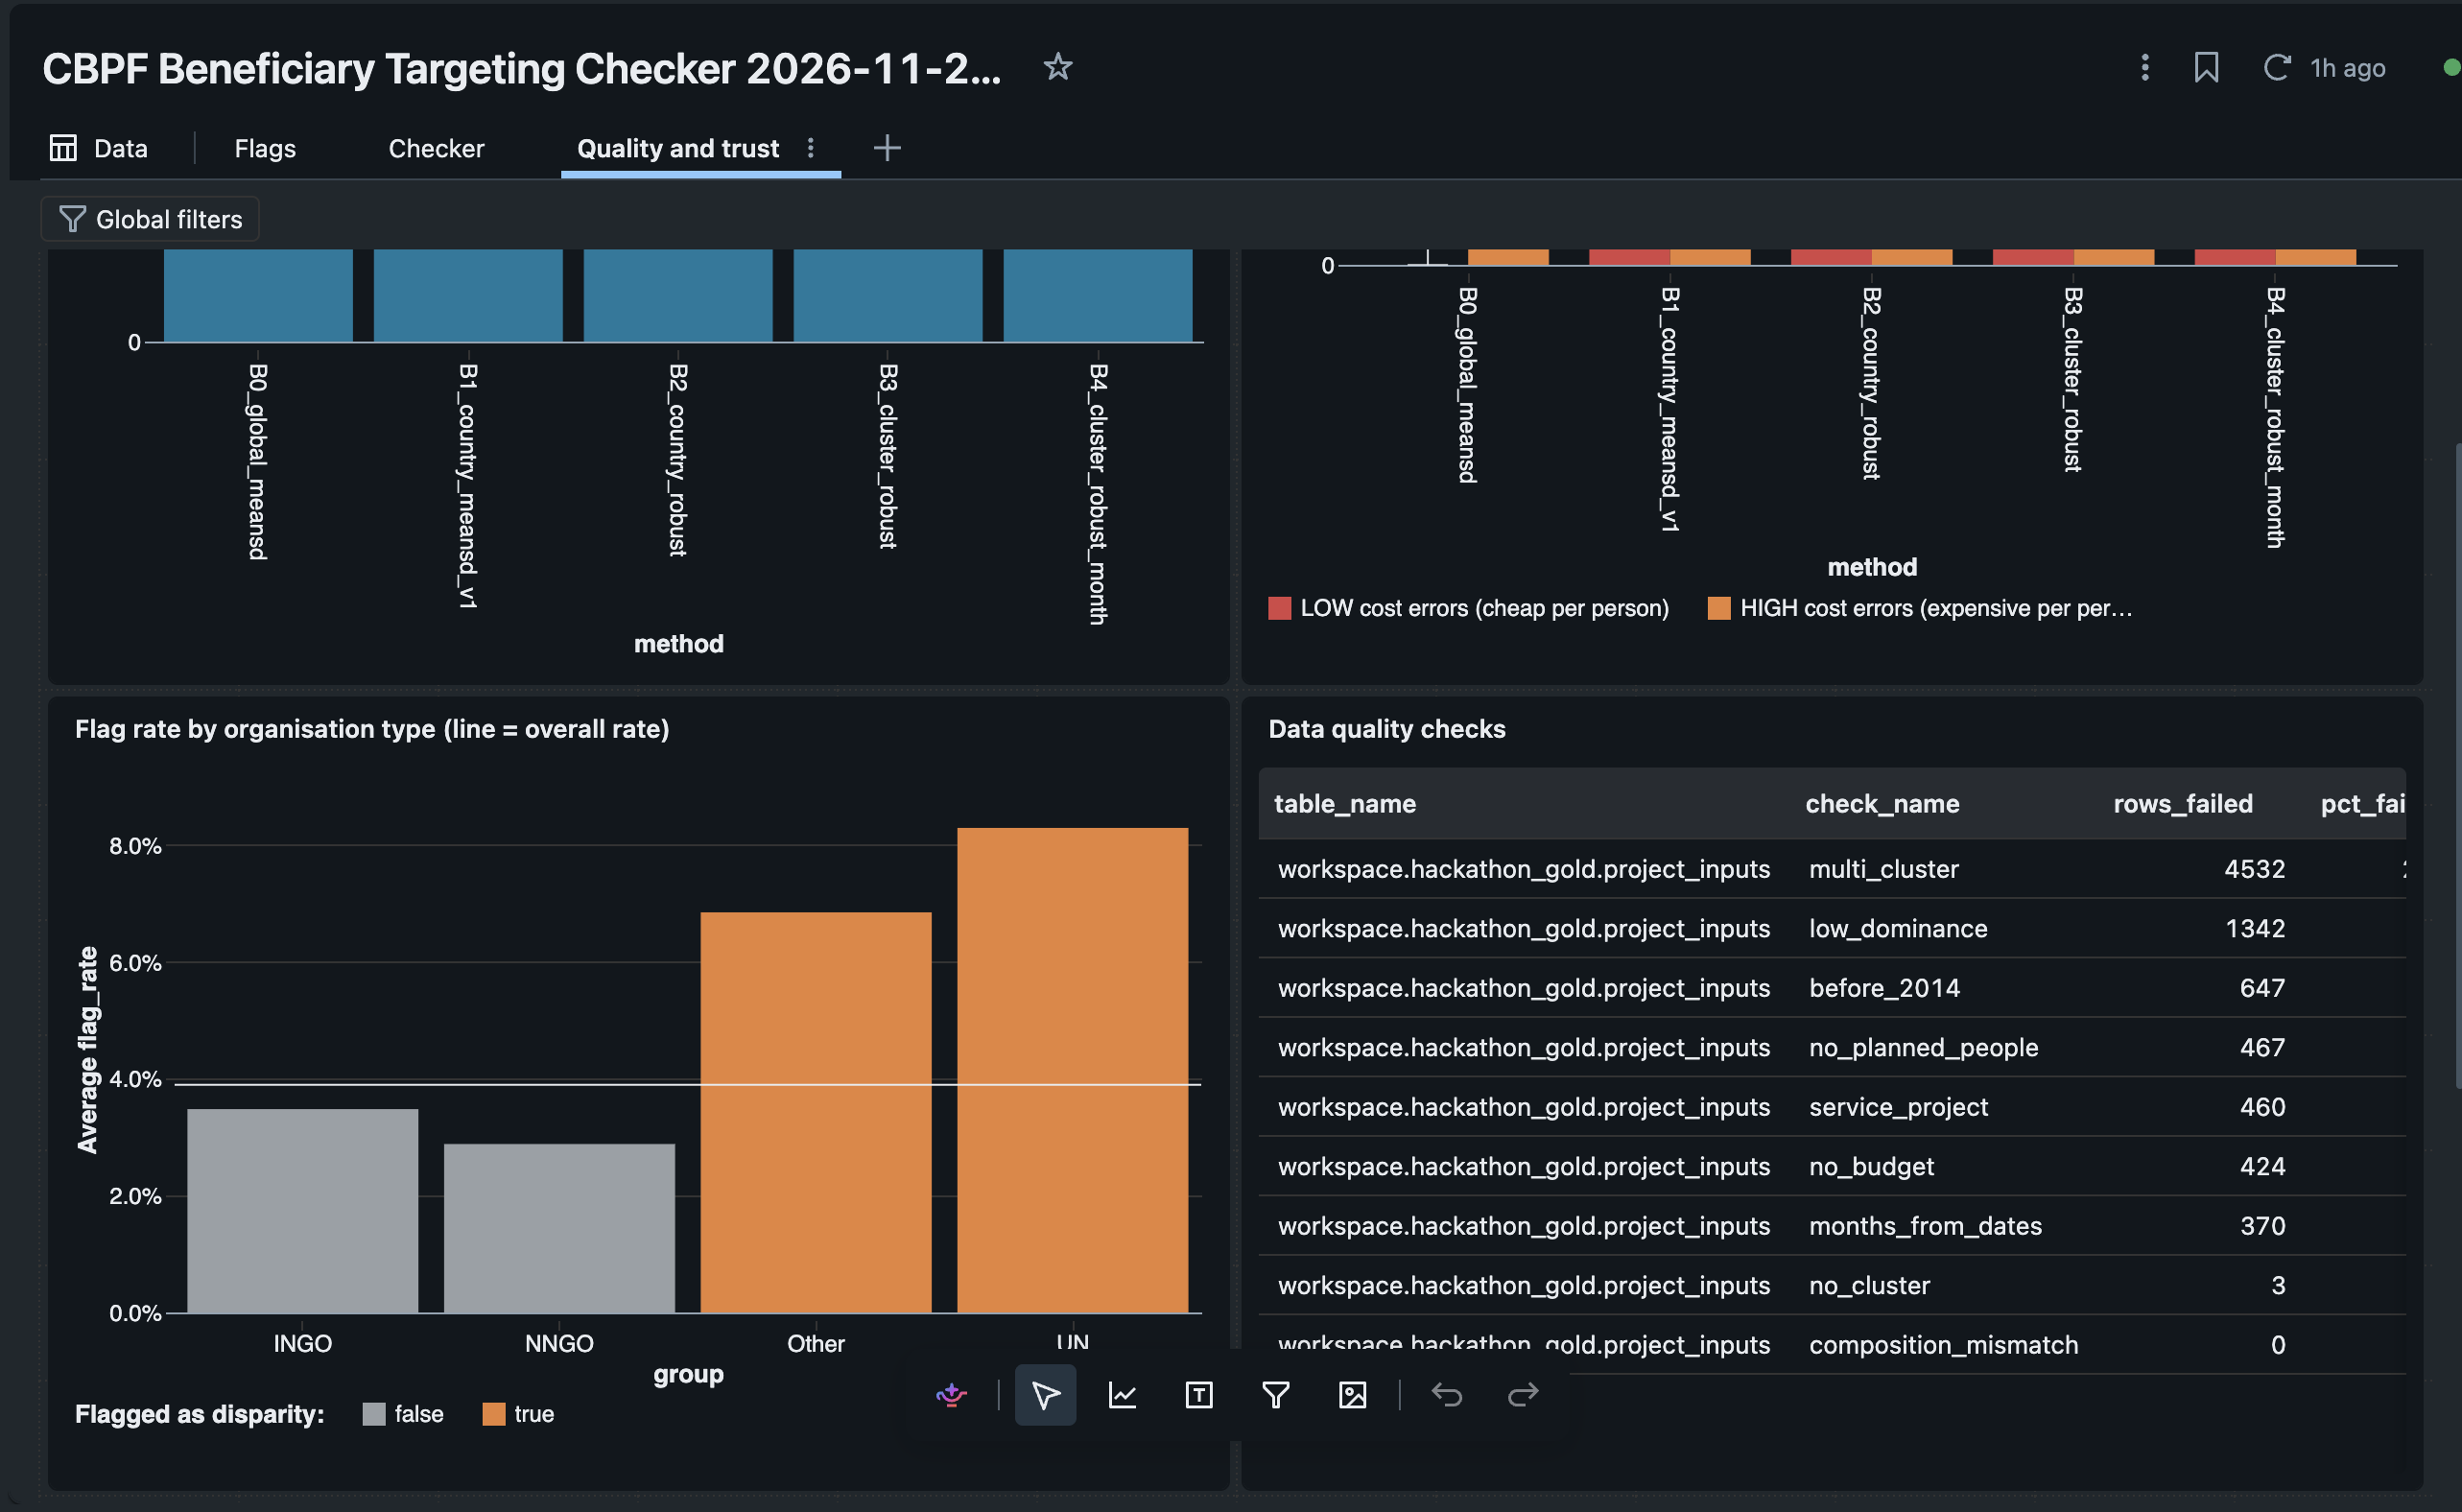
- Fair flag cutoffs. The cutoff is split-conformal per partner type. It promises that about 4% of typical projects in each partner type are sent for review, so local NGOs are not flagged disproportionately.
- Comparables. An exact kNN model chooses each project's neighbours by what the project is, and never uses budget to pick them. This keeps the benchmark from simply echoing the flag. It's registered as a model in Unity Catalog.
- Explanations. An LLM (Llama 3.3 70B via
ai_query) only writes the plain-English note, from a facts payload. A number check rejects any note that contains a figure not in the source data. - Gap index. Need vs funding coverage for each country × sector, to show which crises are overlooked.
- Serving it. We used an AI/BI dashboard, a Genie agent with a trusted
check_proposal()SQL function, MLflow tracking for every run, and Lakeflow to orchestrate the steps.
Challenges we ran into
- Messy real-world data. The CBPF files had column-shifted rows, duplicate project codes, no country codes (fund names like "oPt" or "Syria Cross border") and no sector column for most projects. Sector labels from other sources mixed English and French. We built mappings and fallbacks for each of these, and logged every cleaning step to a data-quality table.
- Our first outliers weren't real. The most extreme early outliers were logistics and coordination projects, whose "beneficiaries" are aid agencies, not people. We exclude those service clusters now, and comparing only within the same sector fixed the rest.
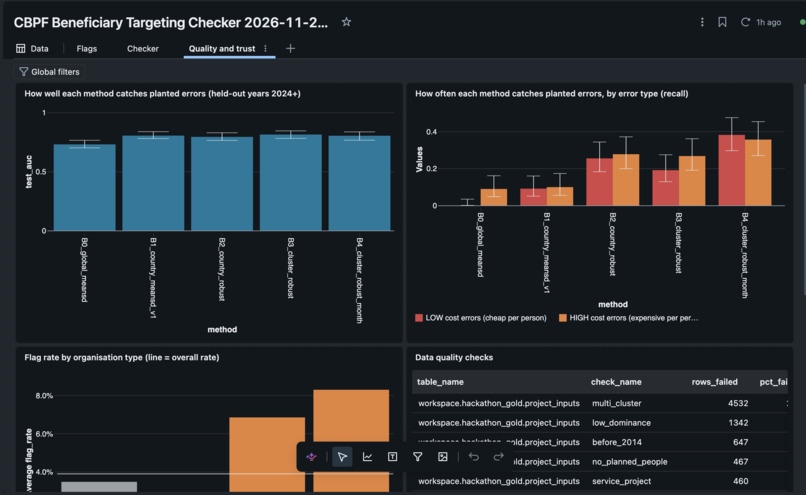
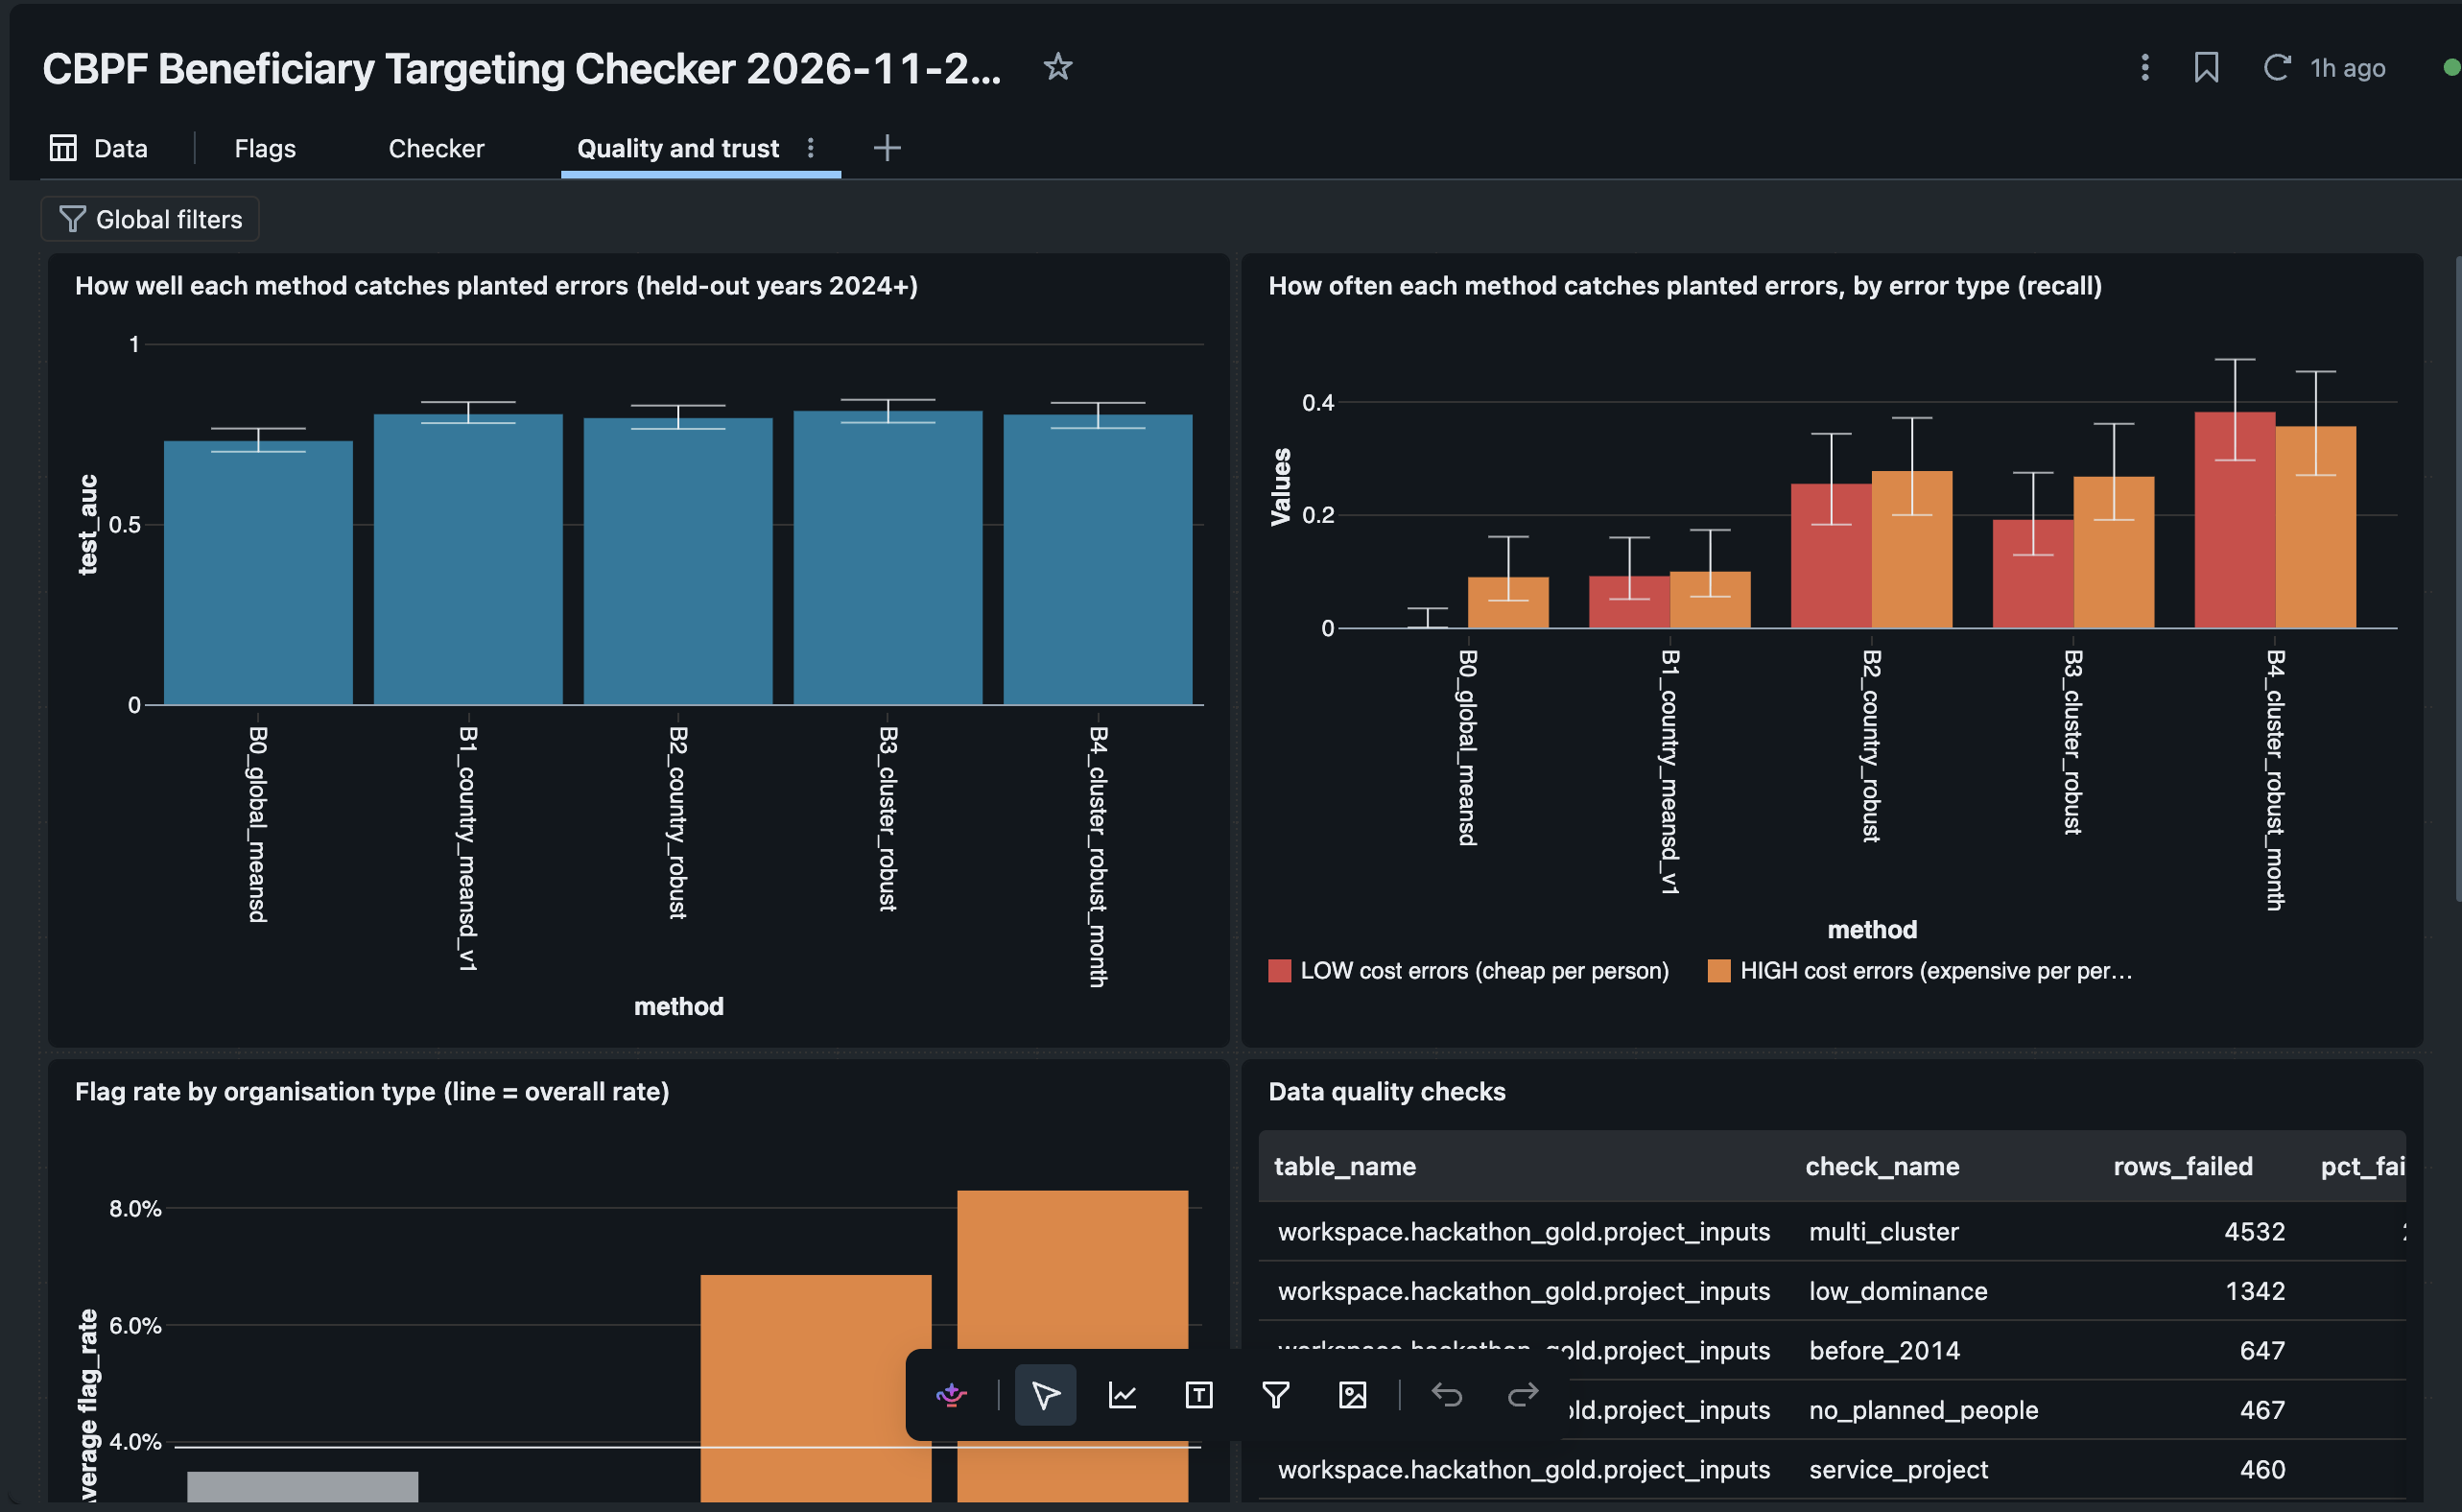
- No answer key. Nothing tells you which projects really are mis-costed. We validated in several ways: planned vs actual reach on closed projects, a held-out half for the flag rate, a leave-one-out baseline for the comparables, and a blind hand-check sheet.
- Fairness. One global cutoff flagged some partner types far more often than others. A per-partner-type conformal cutoff fixed that without hiding the flags that matter.
- Keeping the LLM honest. Early explanations sometimes included numbers that weren't in the data. Building the notes only from a facts payload, and rejecting any note that fails the number check, solved it.
- Teamwork on shared tables. Several notebooks wrote to the same gold tables, so we had to agree on a table contract and a run order.
Accomplishments that we're proud of
- 15,580 projects scored, with 601 (3.9%) flagged as worth a second look.
- On the held-out half, the flag rate is 3.8% against the 4% target, with similar rates across partner types.
- The kNN comparables cut cost-prediction error by 54% compared with a sector-and-year baseline.
- Every answer is shown in dollars, which is the language fund managers actually work in.
- The overlooked-crises view marks 88 of 933 country × sector cells (2024–26) as high need and low funding.
- A full Databricks stack, end to end: Delta and Unity Catalog, MLflow, a UC-registered model, an AI/BI dashboard, a Genie agent and
ai_query.
What we learned
- Defining "similar" is most of the work. The statistics only became useful once peer groups compared like with like.
- Robust statistics matter for outlier detection. With means and standard deviations, the worst outliers hide the others.
- Fairness has to be designed in, not checked afterwards. Conformal cutoffs per partner type gave us a guarantee we could explain.
- LLMs are good at wording, not at numbers. Give them only verified facts, then check what they write.
- Responsible design is a product decision. The tool says "worth a second look", never shows organisation names, and states its limits on screen: thin peer groups, sectors we had to infer, and LLM notes that failed the number check.
What's next for Smart Beneficiary Targeting Validation
- Feedback from real reviewers. Have OCHA fund managers label a sample of flags, so we can measure real-world precision and tune the cutoff.
- Better sector coverage. Use more of the official CBPF cluster data and fewer inferred sectors.
- Live use during allocation rounds. Check proposals as they're submitted, through the
check_proposal()checker in the app. - Time-varying context. Replace the single INFORM severity snapshot with monthly data, and add access constraints (conflict, insecurity) as reasons a project may legitimately cost more.
- More funds. Extend to CERF and other pooled funds, and link flagged projects to the overlooked-crises view, so reviewers see cost questions and coverage gaps together.
Built With
- databricks
