Inspiration
"Save energy" and "use less water" are easy to agree with and hard to act on. Most students I know want to live more sustainably but can't answer basic questions: Does a shorter shower actually matter? Is it worth switching bulbs? How much does one person change anything?
Without numbers, good intentions stay vague. I wanted a tool that makes small switches concrete, measurable, and worth sticking with.
What it does
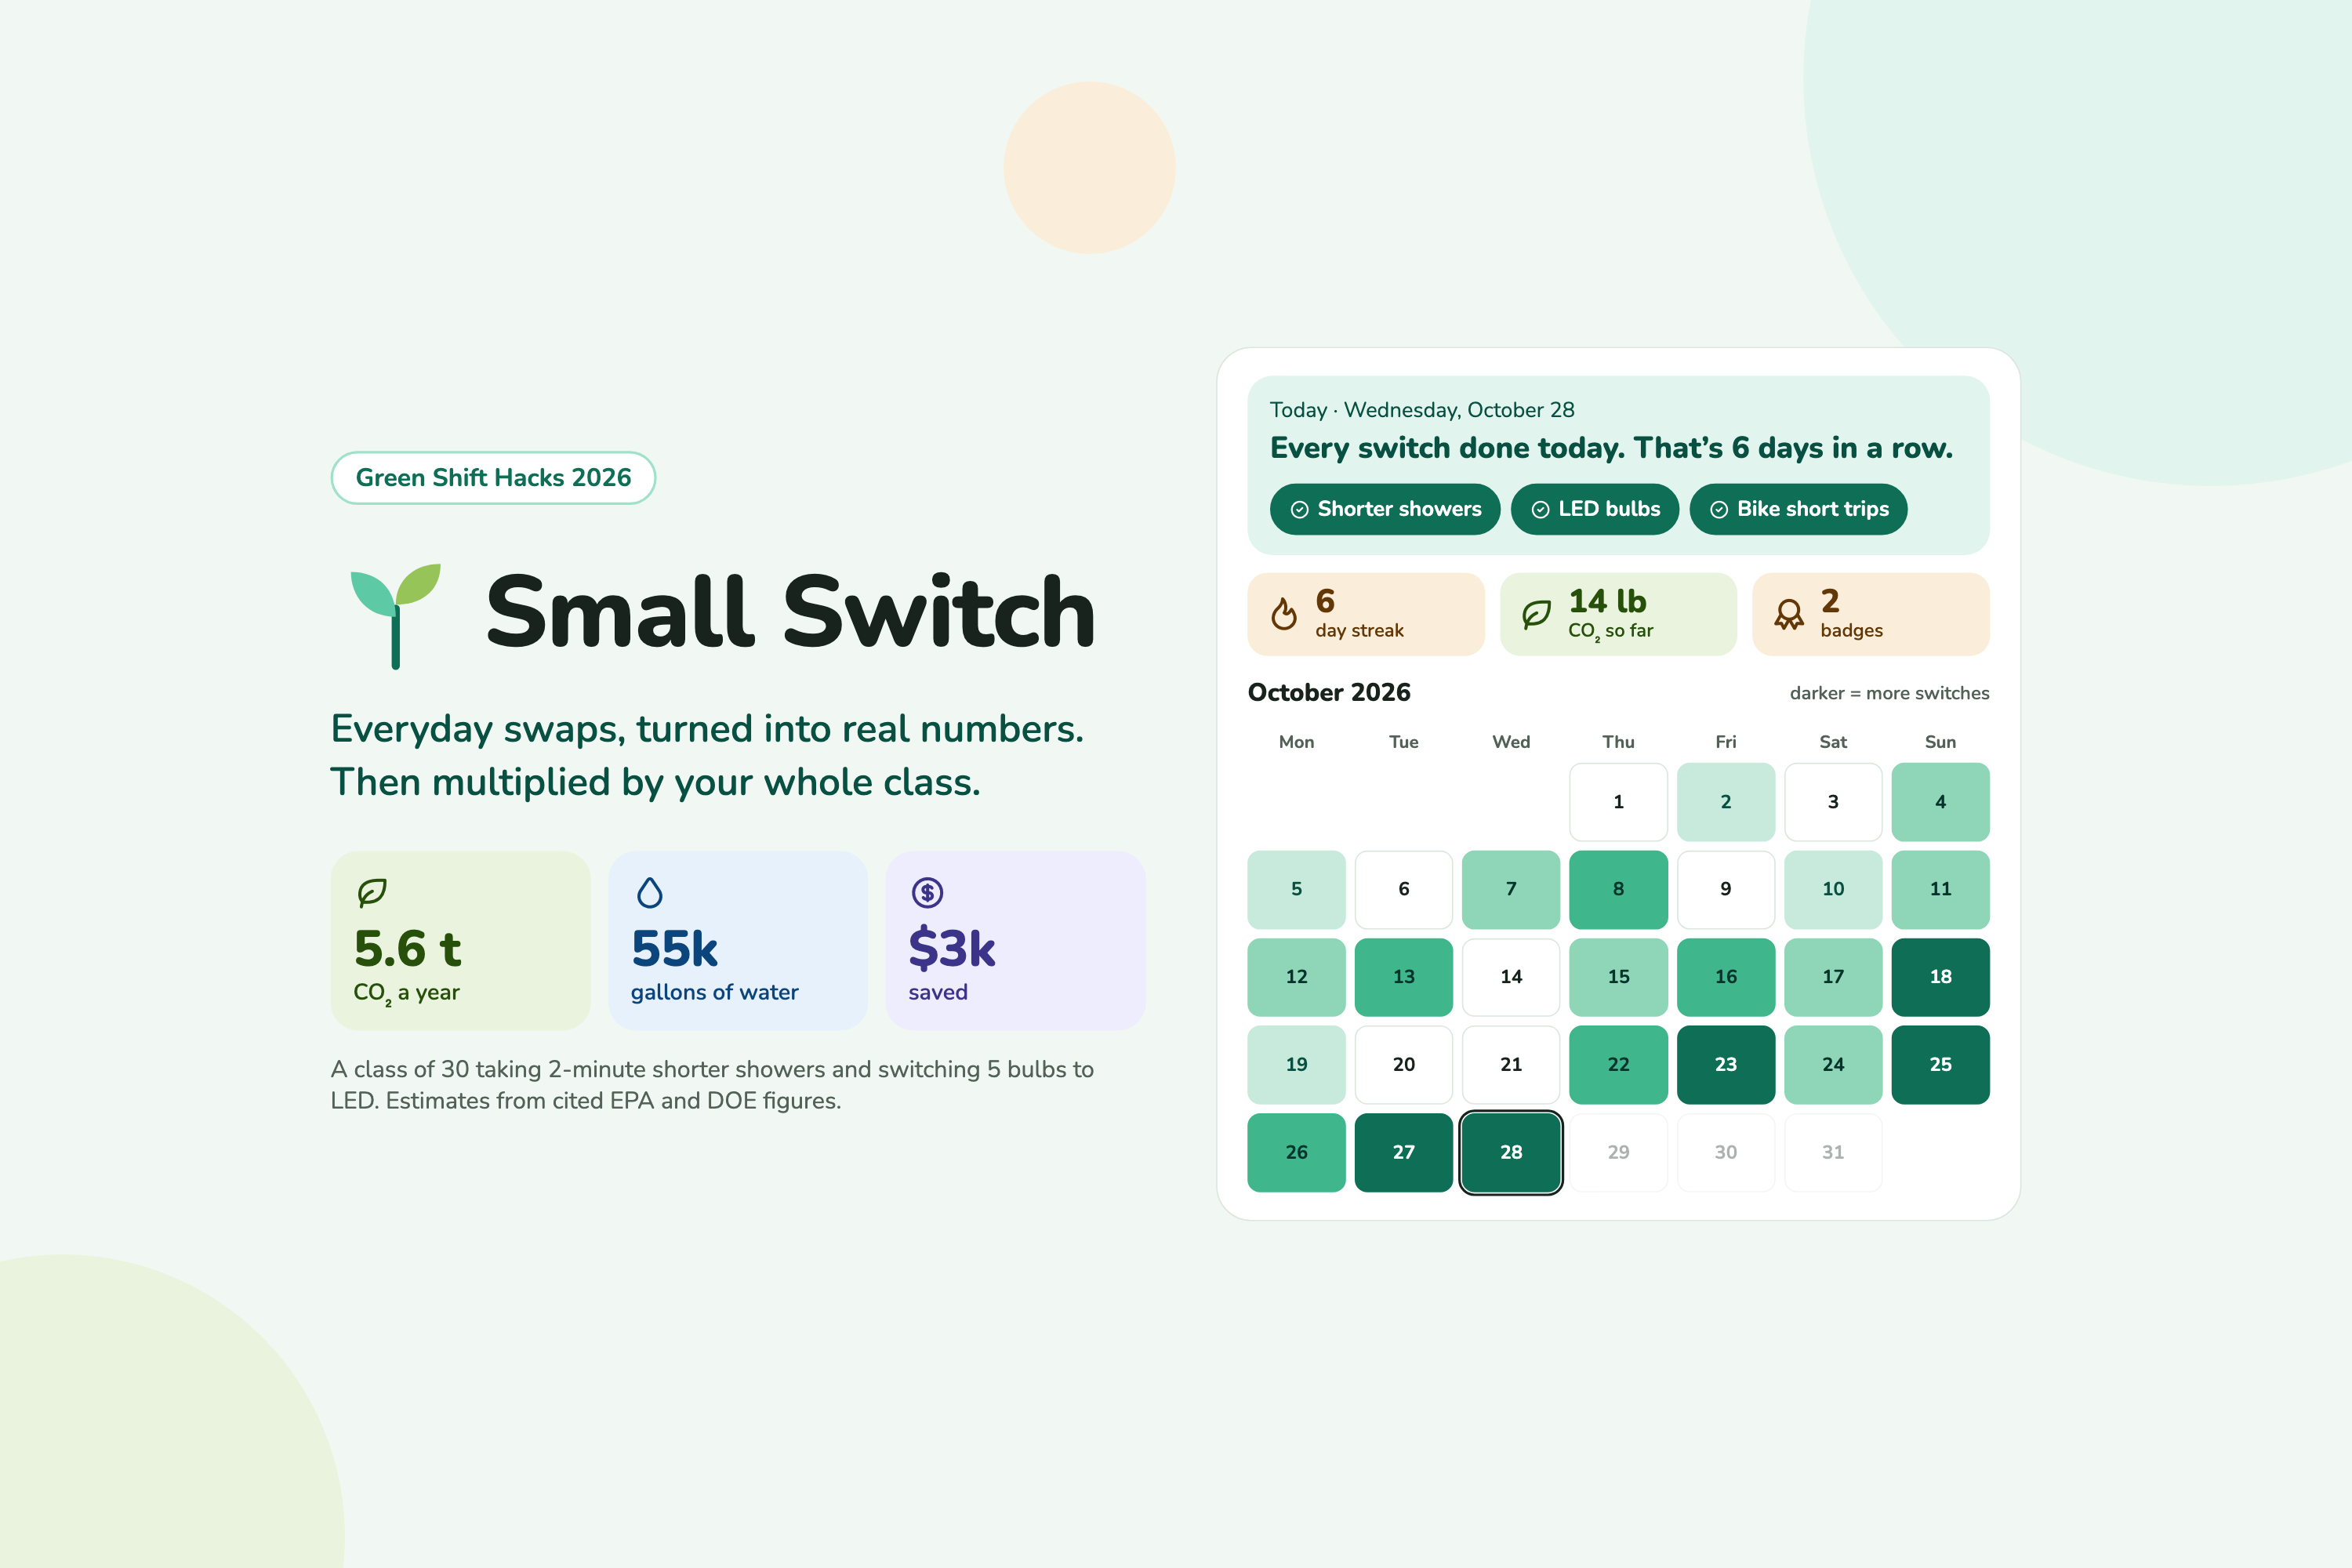
Small Switch turns everyday swaps into real numbers, then helps you keep them up.
- Pick your switches: shorter showers, washing clothes in cold, air-drying laundry, LED bulbs, walking or biking short trips, and carrying a reusable bottle.
- Match your real habits with sliders (minutes cut, loads per week, bulbs swapped, distance) and see what each switch saves per year in CO₂, water, energy, money and plastic bottles.
- Scale it up: count the savings for just you, your household, your class (30), your school (500), or any number.
- Track it: a habit tracker with a daily check-in, a month calendar shaded by how many switches you did each day, streaks, badges, and the savings your logged days actually add up to.
- Trust it: every formula is shown, every source is linked, and every factor (electricity price, your local grid's CO₂, gas vs. electric water heater) can be changed.
Intended users: students, families and classrooms who want to cut their footprint and see proof it's working. It's especially useful for teachers running a class challenge.
How we built it
- Frontend: plain HTML, CSS and JavaScript with no framework, no backend, no account and no API key. It loads fast, costs nothing to run, and can't break during judging.
- The math: each switch is a short, transparent formula. Shorter showers, for example:
$$ \text{water saved} = \text{minutes cut} \times \text{showers per week} \times 52 \times \text{flow rate} $$
With the defaults (2 minutes, 7 showers a week, 2.5 gal/min) that's 1,820 gallons a year. Two-thirds of that water is hot, and heating it takes
$$ \frac{1{,}213 \text{ gal} \times 8.34 \times 60^\circ\text{F}}{3{,}412 \times 0.92} \approx 193 \text{ kWh} $$
which is about 76 kg of CO₂ on the average US grid.
- Data sources: US EPA (CO₂ per gallon of gasoline, per therm, per kWh from eGRID 2022, and per car per year), EPA WaterSense, DOE Energy Saver, ENERGY STAR and EIA. All are linked inside the app.
- Habit tracker: history is stored only in the browser (localStorage), so there are no accounts and no data collection.
- Hosting: Vercel, with the code on GitHub.
I built it with Claude Code as an AI coding assistant.
Expected environmental benefit
With the default settings, one student who takes 2-minute shorter showers and swaps 5 bulbs to LED saves each year:
| Per student | Class of 30 | |
|---|---|---|
| CO₂ | 186 kg (411 lb) | 5.6 t |
| Water | 1,820 gal | 54,600 gal |
| Electricity | 473 kWh | 14,190 kWh |
| Money | $102 | about $3,060 |
A class of 30 doing just those two switches avoids about as much CO₂ as 1.2 cars produce in a year (EPA: about 4.6 t per car).
Challenges we ran into
- Getting numbers people can trust. It would be easy to show impressive-looking figures with no basis. I used only published factors (mostly EPA), checked them against the source, showed every formula, and made every assumption editable.
- Not overclaiming. CO₂ per plastic bottle varies too much by source to state confidently, so the bottle switch counts bottles and money only. The grid factor is the US average, and users can change it to their local grid.
- Keeping it encouraging. A calculator alone doesn't change behavior. The habit tracker gives streaks and badges, lets you fill in days you forgot, and keeps a streak alive until the end of the day, so people aren't punished for logging late.
Accomplishments that we're proud of
- Every number in the app can be traced to a formula and a source.
- One tap scales personal savings to a class or school, which makes the impact feel real.
- It works with no account, no backend and no cost to run, so any school can use it.
What we learned
- Showing the formula builds more trust than a polished number.
- Small habits add up fast at class scale. Two simple switches across 30 students is several tonnes of CO₂ a year.
- Measurement and motivation work best together: the calculator says why, and the tracker helps with keeping it up.
Limitations
- Results are estimates built from averages, not measurements of a specific home.
- The default electricity CO₂ factor is the US average. Cleaner or dirtier local grids change the result.
- Rebound effects (spending the money saved on something carbon-intensive) aren't modeled.
- Tracker savings use a daily average of each switch's yearly figure.
What's next for Small Switch
- Add a class challenge view where a teacher shares one link and sees the class total.
- Add regional grid factors chosen by zip code.
- Add more switches (thermostat setbacks, meal planning to cut food waste).
- Test with a real classroom over a month and report the actual results.
Built With
- css3
- github
- html5
- javascript
- localstorage
- tabler-icons
- vercel

Log in or sign up for Devpost to join the conversation.