-
-

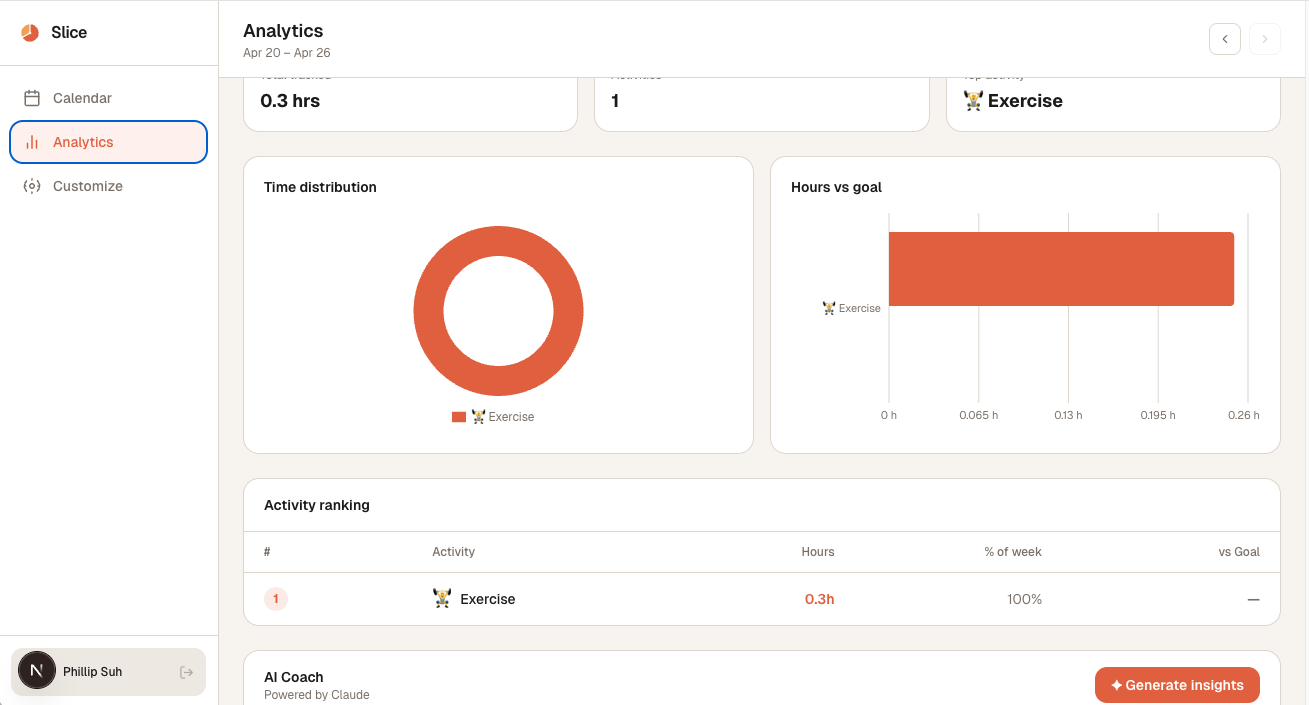
Analytics Page
-

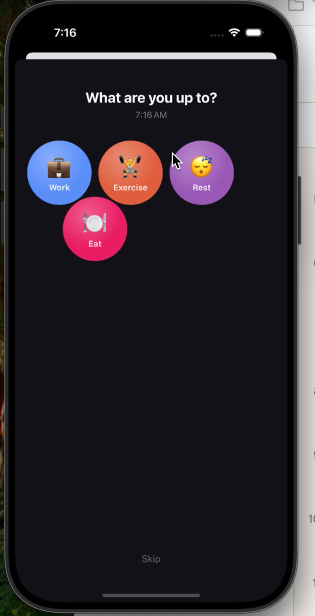
Activities Mobile Page After Tapping Notification
-
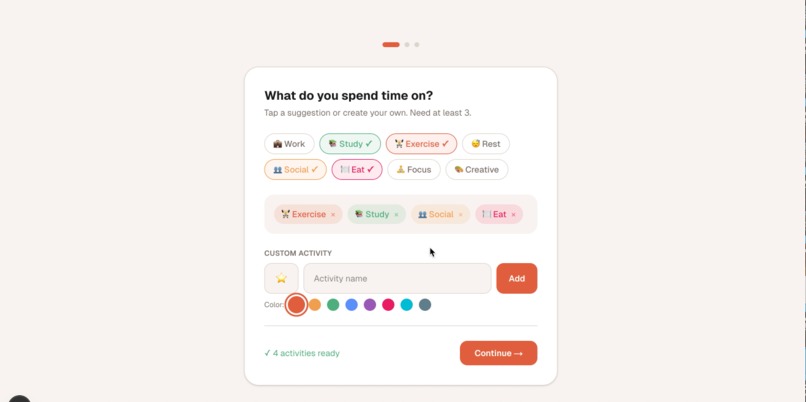
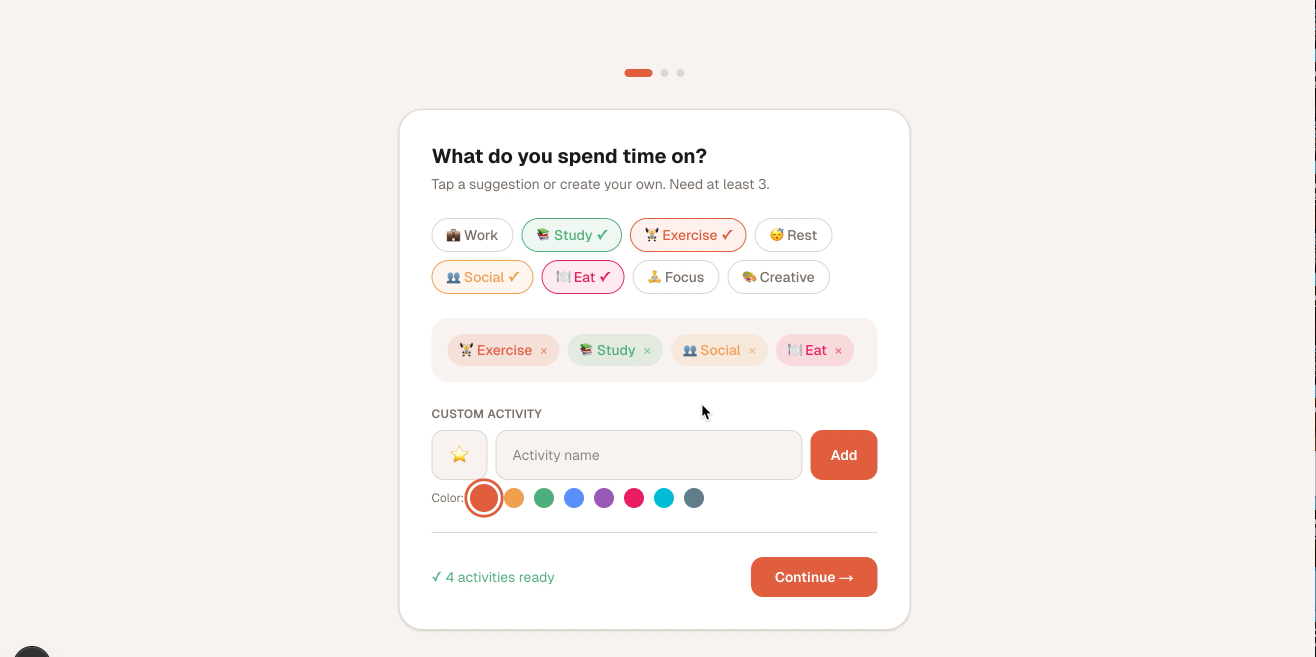
Onboarding Page
Inspiration We kept reaching Sunday night with no idea where the week went. Meetings that felt like an hour had swallowed four. Deep work that felt productive barely registered when we tried to recall it. Every productivity app we tried asked us to be disciplined — start a timer, remember to stop it, build a new habit. We never stuck with any of them.
The insight behind Slice is simple: instead of asking people to track their time, ask them what they're doing right now — randomly, a few times a day. It takes one tap. There's nothing to remember. And over a week, those snapshots add up to a surprisingly accurate picture of how you actually spend your time.
How We Built It Design — Figma Make
Before writing any code, we used Figma Make to prototype the iOS app screens and the web dashboard. Starting in Figma let us lock in the visual language — the honeycomb bubble picker, the color chip system, the donut chart layout — and iterate on UX without touching Xcode or VS Code. The designs translated almost directly into the final product.
Backend — Supabase
A single Supabase project (Postgres + Row Level Security) powers both the iOS app and the web dashboard. Core tables: activities, activity_logs, user_settings, and weekly_goals. The same auth session works across both clients.
iOS App — SwiftUI
The notification layer uses UNUserNotificationCenter with a repeating UNTimeIntervalNotificationTrigger. The activity picker is a custom honeycomb grid built with alternating-row offsets and negative vertical spacing to achieve true hex packing — no third-party layout libraries. Tapping a bubble triggers a full-screen confirmation view with a spring press animation and a radial vignette.
Web Dashboard — Next.js 16
The dashboard has three main views: a scrollable calendar showing every logged ping, an analytics page with charts built in Recharts, and a customize page for managing activities and goals. The calendar uses 100dvh height to ensure reliable scrolling across all screen sizes.
AI Insights — Claude API
The /api/insights route sends a week's aggregated activity hours to claude-haiku-4-5-20251001 and asks for exactly three insights grounded in those hours, plus one call-to-action for next week. The response comes back as structured JSON:
{ "insights": ["...", "...", "..."], "cta": "..." } If you logged $H$ total hours across $n$ activities, the prompt includes each activity's share:
$$\text{share}_i = \frac{h_i}{H} \times 100%$$
Claude uses those percentages to write observations that are specific and accurate rather than generic.
Challenges We Faced Getting the AI to behave
Early versions of the prompt included the raw ping interval, which caused Claude to calculate things like "you were pinged 10,080 times this week" (7 days × 24 hours × 60 minutes, for a 1-minute test interval). The fix was removing ping metadata from the prompt entirely and sending only summarized hours — giving the model only what it needs to reason correctly.
iOS notification → SwiftUI state
Making a notification tap open the log sheet (not just foreground the app) required bridging UNUserNotificationCenterDelegate from AppDelegate into SwiftUI's @Observable state model via NotificationCenter.default.post. Getting that handoff clean took a few iterations.
Scroll containers in Next.js
Using height: 100% on nested flex children doesn't reliably produce a bounded scroll container in Next.js App Router — the percentage chain breaks. Switching to height: 100dvh on the outermost div fixed the calendar and analytics pages instantly.
Honeycomb layout from scratch
SwiftUI has no native hex grid. We built one manually: rows of three bubbles, with odd-indexed rows offset by half a bubble width, and a negative spacing on the outer VStack equal to the vertical overlap for true hexagonal packing.
What We Learned Prompt discipline matters as much as model choice. Sending only the data Claude needs — and nothing it could misinterpret — produces dramatically better output than trying to correct hallucinations after the fact.
Figma Make is a genuinely fast way to converge on a design before writing code. We saved hours by not rebuilding the iOS UI three times in Xcode.
And perhaps most importantly: passive data collection beats active tracking every time. The best habit is the one you don't have to remember.
Built With
- claudeapi
- figma
- next.js
- recharts
- supabase
- swift
- swiftui
- typescript

Log in or sign up for Devpost to join the conversation.