-
-
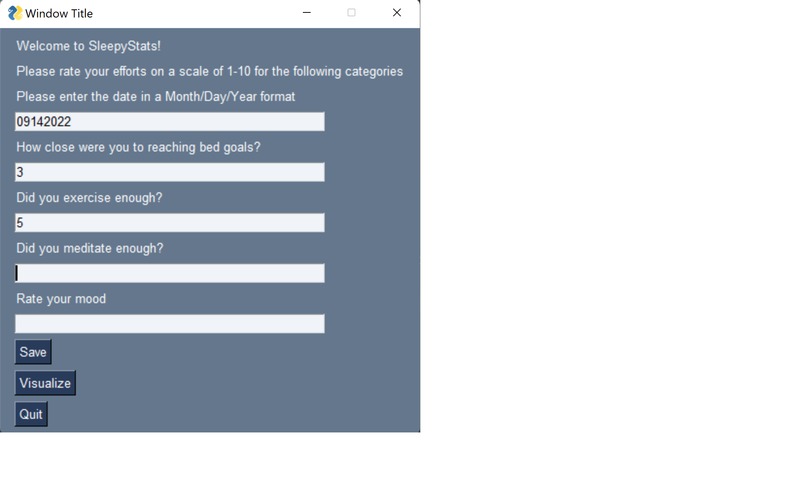
General Menu
-
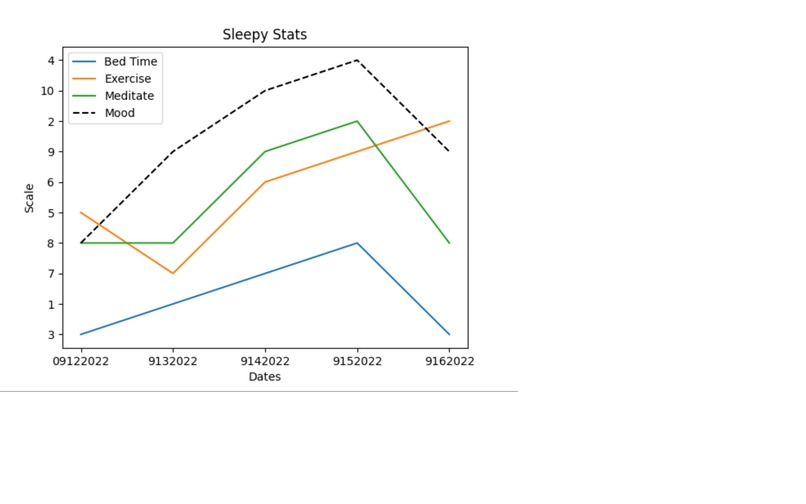
Image Output

Inspiration
I was inspired to write this program because I find that it's easier to change habits when we track them, more so when we can visualize their effects on our well-being and health.
What it does
Taking our sleep seriously is the first step in gaining health. With an increasingly stressful world, it's important to 'control the controlalbles', and the first step in doing that is being aware of the relationships between our actions and our mood. With this application, you can put in your Sleepy Stats which will allow you to see correlations between your daily activity goals you've set for yourself and how they relate to your general mood. Seeing this visualization will empower users to take control of their habits and live more proactively. The application output is a graph you can save to your desktop.
How we built it
This is the first project I've made that uses a formal GUI, so I went and researched the best GUI to use for beginners. I then thought it would be really cool to have the data visualized, so I looked up what tool to best do that, then went ahead and started hacking away.
Challenges we ran into
A huge challenge I ran into was getting the information to the user. I had everything debugged and ready to go, but there was something wrong with the way the stack interacted. After a few hours of research, I found that it was a rare interaction, but one that would require me to spend an inordinate amount of time to do what I initially envisioned. While researching the problem, I read through the documentation and found an alternative that better suited the diary-format idea I had for the application. Now, users can save their graph images and have a folder of information spanning as far back as they desire.
Accomplishments that we're proud of
What we learned
What's next for Sleepy Stats
Built With
- matplotlib
- pyplot
- python

Log in or sign up for Devpost to join the conversation.