-
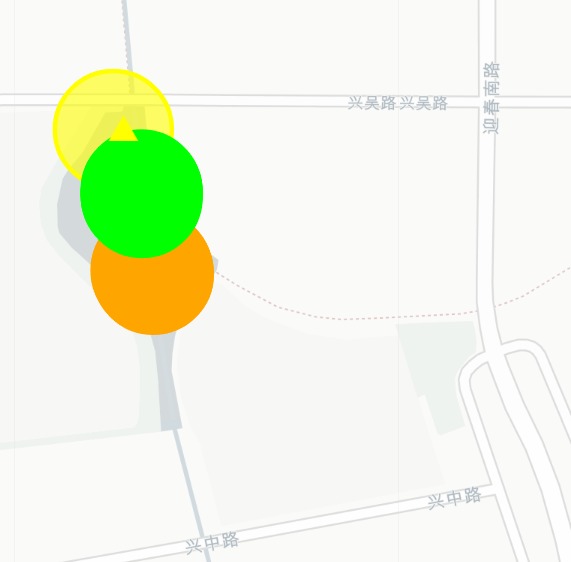
An upward-pointing arrow indicates an increase in pollution
-
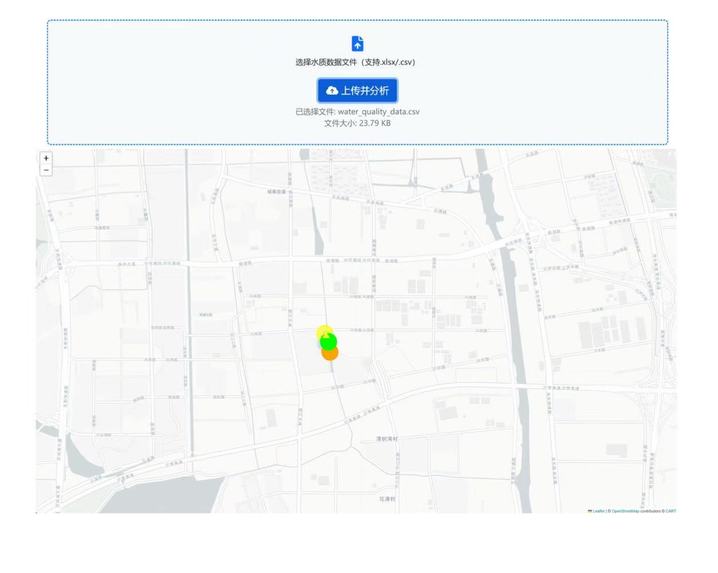
Webpage graph for water quality analysis


Inspiration The inspiration for this project stems from the growing need to monitor and understand water quality efficiently. With increasing environmental concerns, there is a demand for a system that can process raw water quality data, predict trends, and visualize results intuitively, enabling stakeholders to make informed decisions for water resource management and pollution control.
What it does This system is designed to analyze and visualize water quality data through a series of automated processes. Data Preprocessing: Cleans and normalizes raw data (e.g., removing invalid entries, standardizing time formats, and rounding coordinates). Trend Prediction: Uses linear regression to forecast the trend of pollutants (e.g., COD) at each monitoring point. Clustering Analysis: Identifies spatial patterns in water quality by clustering monitoring points based on selected features using the K-Means algorithm and the elbow method for optimal cluster number determination. Dynamic Visualization: Generates interactive HTML maps with color-coded pollution levels and trend arrows to visualize results dynamically. How we built it Technical Stack Libraries: pandas/numpy: For data loading, cleaning, and preprocessing. scikit-learn: For linear regression (trend prediction) and K-Means clustering. folium: For creating dynamic maps with interactive markers. matplotlib: For visualizing the elbow method curve to determine optimal clusters. Workflow: Data Input: Read CSV files containing water quality data (with specific column formats and time series). Preprocessing: Clean data, handle time formats, and validate data integrity. Trend Prediction: Group data by coordinates, train linear regression models for each group, and predict pollutant trends. Clustering: Standardize features, apply the elbow method to select cluster numbers, and perform K-Means clustering. Visualization: Use folium to create maps with p


