-

Nine groups from twenty TV shows. Three outliers marked, and the pairs you could drop without losing coverage.
-

The agent rebuilt the lineup with every candidate and kept none of them. Refusing is the point.
-
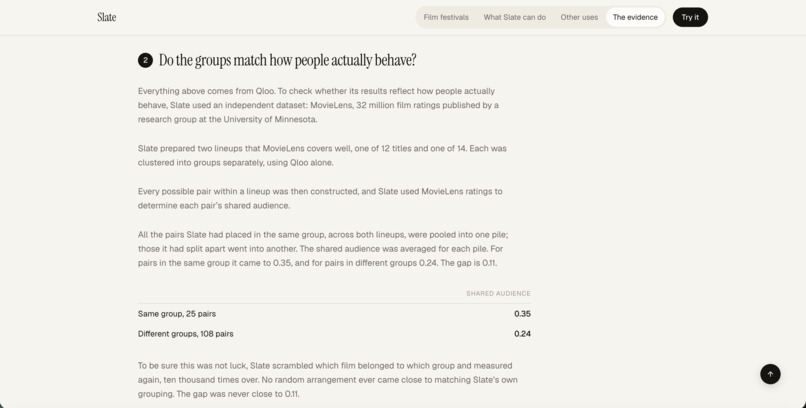
Titles Slate groups together share more audience than titles it separates. Ten thousand random groupings never matched it.


Inspiration
Choosing a small set from a large pool is a decision made in many industries, and film programming shows it clearly. A festival programmer reads four hundred films and picks twenty, judging each one on its own merits. But looking at the films individually does not show what the twenty do together. Several can appeal to the same crowd while other tastes receive little attention.
The same problem appears when a broadcaster fills a schedule, an airline selects an entertainment catalogue, or a bookshop chooses a display. The overlap is a property of the selection, not of any one title.
There is also another starting point: knowing something about the audience before choosing the lineup. An organisation may have survey answers, preference totals or a description of what its customers enjoy. That information still needs to become a decision about which candidates deserve the available slots.
Slate supports both starting points. Bring an existing lineup to understand and refine, or provide audience evidence and let Slate select a lineup around it.
Qloo supplies the taste relationships behind both: affinities between titles and connections across films, music artists, books, podcasts and TV shows.
What it does
Analyse an existing lineup
Give Slate four to twenty-four titles. It asks Qloo how each one relates to the others, builds a distance between every pair, and finds the groups.
Then it marks two things:
Bridges. Titles close in taste to more than one group. They connect parts of the lineup that would otherwise sit apart.
Outliers. Titles that stand apart from the surrounding lineup. They may contribute a taste that the other titles do not cover.
These are interpretations of affinity relationships within a particular lineup. A group is not a permanent label attached to a film, artist or book.
Slate has been tested on films, music artists, books, podcasts and TV shows.
Build for an audience
Start with what you know about your audience. Slate accepts three forms of evidence:
- A written description containing specific titles or artists the audience likes.
- A CSV of free-text survey questions and answers.
- A CSV of named items with aggregated liked and disliked counts.
DeepSeek extracts explicitly named references and interprets positive and negative mentions in descriptions and survey answers. Aggregated preference names and counts are parsed directly. DeepSeek suggests a media type for each name before Qloo resolves it. The counts come from the file, not the model.
Qloo then resolves the references. Users review what Slate understood and can remove unwanted matches before continuing. Unresolved references and names mentioned only negatively are excluded from the positive interests used for selection.
Next, provide the candidate pool and the number of slots. Audience references can span media types: an interest in musical artists and books can help inform a film selection through Qloo’s cross-domain affinities.
The candidate pool can also contain different types. Slate separates the matched candidates by type, and the user chooses one type for the final lineup. The result contains four to twenty-four titles, subject to the candidates available.
Users choose how Slate should select:
Balanced. Give different tastes equal consideration, so less common tastes receive as much consideration as popular ones.
Demand-led. Prioritise preferences with the strongest support, so popular tastes have more influence on the lineup.
These choices affect selection. Slate then clusters the chosen titles to show the structure of the resulting lineup.
Refine either result
Both paths lead to the same workspace, where users can ask four things:
Fit it into fewer slots. Reduce the number of slots and find the best set to keep.
Find a title that adds a new group. Search for a title that contributes something the lineup is missing.
Check a new title against the lineup. Propose a title and see where it sits and what it changes.
Compare titles before adding. Compare several candidates for a limited number of slots and see which combination contributes most.
Each action produces a brief users can download.
Users can also lock titles that must remain. Those titles are protected when Slate reduces the set or proposes replacements.
Inspect the audience evidence
Audience-built workspaces include an Audience tab. It combines each audience reference, its closest match in the selected lineup and the evidence behind it.
Descriptions have expandable supporting excerpts. Surveys show positive mention totals with expandable excerpts. Aggregated preference files show their liked and disliked counts directly.
References that were not used appear in a collapsed section with their reasons. This keeps the initial view compact while preserving the evidence behind the selection.
The agent
The search for a title that adds a new group runs an observe–act–measure loop. It runs up to two rounds, and each round does five things:
- Looks at the lineup’s current shape.
- Identifies an unlocked title the lineup would miss least.
- Asks Qloo for replacement candidates.
- Tests candidates in the full lineup and works the groups out again, so nothing is judged in isolation.
- Keeps a swap only if the result is measurably better.
Round two starts from the lineup round one produced. If nothing clears the improvement threshold, Slate reports no change.
Every step is recorded, so users can inspect what was considered, what was rejected and why before applying the proposal.
Why Qloo
Qloo supplies the taste relationships that drive both entry paths.
For lineup analysis, Slate builds pairwise distances from Qloo’s affinity rankings: ask about each title, see where it places the others, and average the two directions. Those distances drive the grouping, bridge and outlier calculations, along with the structural comparisons used by the agent.
For audience-guided selection, Slate uses rankings between audience references and candidate titles. Cross-domain affinity allows evidence from several supported media types to inform a selection in one category.
DeepSeek makes supplied prose usable as structured input. Qloo resolves the references and provides the relationships used to evaluate the candidates. Selection and clustering are calculated in code.
What we checked
Qloo’s rankings describe taste relationships. To compare Slate’s film analysis with independent audience behaviour, we used MovieLens: 32 million film ratings from GroupLens at the University of Minnesota.
Group separation. Slate tested two lineups with sufficient MovieLens coverage, evaluating 11 films in one and 12 in the other. The 23 pairs within groups averaged an audience-overlap score of 0.35; the 98 pairs across groups averaged 0.24. This measures which users rated both films, rather than whether they liked them. Slate randomly moved films between groups, keeping the same number of films in each group, and measured again ten thousand times. None produced a gap as large as Slate’s.
Distance and audience overlap. Across 55 film pairs, Slate’s distance had a Spearman correlation of −0.650 with audience overlap, measured using co-rating association (phi).
Could the result simply reflect how widely rated the films are? Slate checked this using the number of MovieLens ratings for the less-rated film in each pair. Its relationship with audience overlap scored +0.251.
Slate also checked whether films released closer together tend to share an audience. That relationship scored −0.596. Slate’s distance showed the strongest absolute relationship among these comparisons, at −0.650.
Comparison with metadata. Slate’s distance had a correlation of −0.498 with rating agreement. Shared genres scored +0.038, release-year difference −0.139 and the difference in Qloo popularity scores +0.060. Shared genres uses Jaccard similarity between the complete genre sets. The affinity-derived distance showed the strongest absolute association among these measures in this sample.
Stability when a title leaves. Removing one title at a time, reranking the stored Qloo results and repeating the grouping produced adjusted Rand index scores of approximately 0.97, 0.86, 0.76 and 0.74 across four sample lineups.
Bridge centrality and popularity. Across 62 films, structural centrality had a correlation of +0.08 with popularity, a weak association in this sample.
These checks are reproducible from the repository’s scripts. The evidence section of the site presents the measurements and methods.
The samples are limited, and film pairs sharing a title are not independent observations. The title-level permutation test preserves those relationships when testing group separation.
These results evaluate aspects of the distance and grouping analysis. They do not independently validate the new audience-selection workflow or establish attendance, purchase intent or revenue.
How we built it
The stack
Slate uses Python and FastAPI on the server and vanilla JavaScript on the client, without a frontend framework. Hosted workspaces persist in Postgres, while local development can use SQLite.
Qloo responses are cached server-side. Cached examples can reuse existing responses; new inputs can require live requests.
DeepSeek reads audience descriptions and free-text survey answers. The extraction pipeline retains supporting excerpts and checks structured output against the supplied text before entity resolution. Aggregated preference names and counts are parsed directly; DeepSeek suggests media types for the names, and Qloo resolves them. The model does not generate the counts.
Printable briefs are rendered from the same HTML used for the on-page preview, so the preview and downloaded document use the same content.
The project has 323 automated tests, split into focused modules covering the engine, audience processing, selection, persistence, interface contracts and documentation. The full suite runs with python3 -m pytest.
The maths
The core analysis is implemented directly rather than through scikit-learn. Slate starts from ordinal affinity rankings rather than coordinates or embeddings, so the distance construction and the methods built on top of it are explicit.
Distance. Qloo is queried about each title and returns the others ranked by affinity. Rank position is treated as a dissimilarity. Because the two directions can disagree, Slate averages them:
$$d(A,B)=\frac{r_A(B)+r_B(A)}{2}$$
where \(r_A(B)\) is the position of B in the ranking returned for A.
If A places B third while B places A seventh, the distance between them is 5. These values remain rank-derived dissimilarities rather than distances measured in an embedding space.
When Qloo returns fewer results than requested, missing titles are neither assigned rank zero nor discarded. Each missing title receives the midpoint of the range of positions it could have occupied: halfway between one past the last returned result and the total number of possible positions.
For example, with three results returned out of nine possible positions, the remaining range runs from 4 to 9. A missing title receives rank 6.5.
This treats an unreturned title as relatively distant without automatically assigning it the maximum possible distance.
Groups. Slate applies average-linkage agglomerative clustering directly to the distance matrix. The distance between two clusters is the average of all pairwise distances crossing between them.
The number of groups is selected using silhouette score, also computed from the rank distances. Slate evaluates group counts from 2 through one fewer than the number of titles. When several counts score within 0.03 of the best result, it chooses the smallest count rather than claiming finer structure that the score does not clearly support.
Outliers. Outliers are identified with Local Outlier Factor, evaluated at three neighbourhood sizes. A title qualifies only if it ranks among the top three outliers at every setting, so the result does not depend on a single neighbourhood choice.
The measure compares a title’s local density with the density around each of its neighbours, averaged over them. A score above 1 means the title lies in a lower-density region than its neighbours. In practical terms, it has fewer close neighbours than titles in the surrounding part of the lineup.
Bridges. Bridges are found using betweenness centrality with Brandes’ algorithm on an undirected k-nearest-neighbour graph. Each title is connected to its nearest neighbours, and those connections are made undirected.
The graph is built three times, using 2, 3 and 4 nearest neighbours. A title qualifies only if it remains among the top three at every setting. A title that appears central for one neighbourhood size but disappears at another is not treated as a stable connector.
Choosing a smaller subset. When Slate is asked to fit a lineup into fewer slots under the structural objective, candidate subsets are compared using lexicographic maximin.
Every pairwise distance in a candidate set is sorted from smallest to largest, and the resulting sequences are compared in order. The closest pair therefore decides first; if those tie, the second-closest pair decides, and so on.
This makes the first priority explicit: avoid retaining a pair of titles that are extremely close while a less redundant choice is available.
Slate evaluates subsets exhaustively when the number of combinations is within its 200,000-combination threshold. Beyond that, it switches to greedy removal. The exhaustive result is optimal under the chosen objective; the greedy result is an approximation.
Comparing candidates. Candidate additions use the same lexicographic maximin principle, but only over pairs changed by that choice.
Those pairs include each candidate against the existing lineup and the candidates against one another. Pairs already present in the lineup are excluded from this particular comparison.
Including every existing pair caused candidates to inherit the lineup’s already-existing closest pair. That made the comparison insensitive to what the candidate itself contributed.
Stability. Group stability is measured in two ways.
First, Slate removes one title, reranks the remaining titles using the stored Qloo results and reclusters. It compares the new grouping with the original grouping restricted to those remaining titles using adjusted Rand index. Each sample lineup receives its own score.
Second, each group’s Jaccard overlap is compared with a baseline generated from shuffled rankings. Groups of different sizes are therefore judged against the amount of overlap expected from noise, rather than against one common raw threshold.
Audience-guided selection
The audience path answers a different question from structural redundancy reduction. It asks which candidates fit the supplied references, rather than simply which candidates are furthest apart.
Rank-to-utility conversion. For each audience reference, Qloo ranks candidates within the chosen media type. Slate converts the returned rank into a relative utility between 0 and 1, decreasing linearly with rank across the candidate pool.
The first-ranked candidate receives 1, and the last position in a complete ranking receives 0. An unreturned candidate receives 0.
This differs from the midpoint treatment used for missing pairwise distances. In selection, an unreturned candidate receives no positive contribution from that reference. In clustering, every pair still needs a dissimilarity.
The utility is a relative rank score. A value of 1 does not mean a perfect taste match or a 100% probability that someone will like the title.
Let \(R\) be the audience references, \(S\) the selected lineup and \(u_r(c)\) the utility of candidate \(c\) for reference \(r\).
Balanced. Each reference contributes the utility of its strongest match in the selected lineup. Those contributions are summed with equal reference weights:
$$F_{\mathrm{Balanced}}(S)=\sum_{r\in R}\max_{c\in S}u_r(c)$$
Once a reference has a strong match, another title serving only that same reference adds little or no additional value. Improving a weakly served reference can contribute more.
This encourages breadth across the supplied references. It does not identify separate customer segments or guarantee equal cluster sizes.
Demand-led. Each reference contributes the combined utility of the selected titles, multiplied by its positive-support weight \(w_r\):
$$F_{\mathrm{Demand}}(S)=\sum_{r\in R}w_r\sum_{c\in S}u_r(c)$$
Stronger support therefore has greater influence, and several appealing options for a strongly supported reference can all contribute.
Aggregated files supply positive response totals; survey inputs supply positive mentions. A mention is not necessarily a unique person, and descriptions do not establish reliable audience sizes.
Search and locks. Slate searches candidate combinations exhaustively when the number of combinations is within the configured threshold. For larger searches, it uses greedy addition, choosing the next title that gives the largest improvement under the selected objective.
Where locks apply, required titles are included before filling the remaining slots. A request is infeasible if the number of required titles exceeds the available slots.
The selected set then passes through the same rank-distance clustering analysis used by the original entry path.
Challenges we ran into
Two definitions of “best” running at once. Ask Slate to cut a lineup from twelve titles to nine and it does two things: it searches for the strongest set of nine, then prints a line telling you how that set compares with every other nine you could have picked.
Those two stages were using different measures. The search scored a set on how many groups it made and how crowded they were. The set it selected was then handed to a comparison that ignored group count and ranked by how far apart the two most alike titles ended up.
On one test lineup, the set the search called “best” came 480th out of 495 under the measure printed beneath it. We changed the search to rank the same way as the comparison and added a test that fails if they drift apart again.
A column that could never change. Slate lets users compare several candidate titles for a limited number of slots. Give it five candidates and two slots and it tests all ten combinations. Each combination is added to the lineup and the groups are worked out again.
The comparison initially measured the closest pair in the resulting lineup. But the smallest rank distance Slate can report is 1, and a lineup often already contains a pair at 1 before anything is added.
Adding a title cannot separate a pair that is already there. That pair therefore kept deciding the score, making different candidates look identical.
We fixed it by measuring only the pairs each choice creates: candidates against one another and each candidate against the existing titles.
Qloo’s replies are asymmetric and sometimes partial. Slate asks Qloo about each title in turn and uses the positions of the others in the reply. Two properties of those replies shaped the distance construction.
First, the two directions disagree. Ask about A and it puts B third; ask about B and it puts A seventh. Both answers are used, so Slate averages them.
Second, some requests return fewer ranked titles than requested. On one lineup, we asked for nine rankings per title. Four of ten requests returned three results; the remaining six returned everything.
The missing titles still need a distance because the clustering requires a value for every pair. Treating them as the top rank would make them the closest titles in the lineup, while dropping them would lose the pair.
Slate instead takes the middle of the remaining rank range. With three returned out of nine, the missing positions run from 4 to 9, giving an assigned rank of 6.5.
Before settling on that approach, we repeated the same request three times and compared the replies. The same titles were missing every time in that experiment. Varying omissions would have required investigating transient failures and retry behaviour instead.
Turning audience evidence into usable references. A description, a survey and an aggregated preference table do not carry the same information.
A survey mention is not necessarily a unique person. A written description does not establish audience sizes. A bare title can also be ambiguous across media types.
We kept those sources distinguishable, retained supporting excerpts, resolved names through Qloo and added a review step before selection. Structured preference names and totals are parsed directly, with DeepSeek suggesting the media types for Qloo to resolve.
Keeping audience fit separate from diversity. A structurally diverse lineup can still be a poor fit for a particular audience. Conversely, several similar titles may be justified when the available evidence strongly supports that taste.
We made audience selection a separate objective, then brought its result into the same workspace so users can inspect both its fit to the references and its internal structure.
Accomplishments that we’re proud of
Working out which measure answers which question. Almost none of this was settled at the start. We tried several ways of turning rankings into distances, deciding how many groups a lineup has and comparing candidate sets.
Many failures only appeared when we examined the output. A composite score produced a set that came 480th out of 495 by the measure printed beneath it. A closest-pair comparison gave every candidate option the same number. A group-overlap baseline penalised small groups for being small.
Each problem required understanding the decision a user was trying to make, choosing an appropriate measure and presenting the result in a way they could use.
Completing the audience-to-lineup workflow. Slate now accepts descriptions, surveys and preference totals, resolves references across five media types, selects from a candidate pool and brings the result into the analysis workspace.
The source evidence remains inspectable. Users can see the supporting excerpts or counts, remove unwanted references during review and protect titles that must remain.
Using Qloo throughout the decision. Its affinities drive the pairwise distances, cross-domain audience matching and candidate evaluation. The language model makes unstructured input usable, while the resulting choices depend on Qloo’s relationships and explicit calculations.
Checking the analysis against independent behaviour. MovieLens gave us a way to compare film distances and groups with shared audiences and rating agreement. Separate perturbation tests examined stability when titles leave the lineup.
The findings support specific claims in the tested samples, and the scripts make those measurements reproducible.
What we learned
Release year can look more useful than it really is. People often watch films from the same era, so release year also correlates with shared viewing.
Against audience overlap, release-year difference scored −0.596 compared with Slate’s −0.650, making the two look relatively close. Against rating agreement, release year fell to −0.139 while Qloo remained at −0.498.
The first outcome made metadata look competitive; the second showed a clearer difference. Choosing the evaluation outcome is part of deciding what the tool is supposed to explain.
Audience overlap is affected by popularity. Two widely watched films can share many viewers without being especially close in taste.
We first measured overlap with Jaccard, and some popular pairs appeared unusually close even where Qloo placed them far apart. Comparing this with phi, which accounts for the films’ marginal viewing frequencies, changed how we interpreted the association between audience behaviour and taste distance.
Groups only make sense inside a lineup. Four titles grouped together in a twenty-title lineup may separate when analysed alone. The group describes their relationship to the rest of that specific selection.
Audience evidence has different levels of precision. An aggregated count can express recorded support. A survey mention provides a different signal, and a description may provide no reliable quantities at all.
Those differences matter particularly under Demand-led selection. The interface needs to show the basis for the preference weights without presenting mentions as unique customers.
A relative score needs a relative explanation. A candidate ranked first for a reference receives the highest utility in that comparison. That does not establish that the reference and candidate are a perfect match.
We removed numerical fit displays that could suggest more certainty than a rank-based score supports and kept the reference-to-title relationship inspectable.
Sometimes the right answer is no change. Slate does not force the agent to recommend a swap. It tests proposals in the full lineup and returns no swap when none clears the improvement threshold.
What’s next for Slate
Evaluate audience-guided selection. The existing MovieLens checks concern film distances and group structure. The new selection path needs its own evaluation against preference data, alternative selection strategies and user decisions.
Scale beyond a single lineup. The final workspace is designed around four to twenty-four titles. Supporting much larger candidate catalogues efficiently would require stronger search strategies and careful control of API calls.
Match an audience to an existing group. The implemented feature starts with audience evidence and selects a lineup. A complementary direction would hold an existing lineup fixed, identify which of its groups best matches a supplied audience and show where the fit is weak.
Built With
- css
- deepseek
- fastapi
- html5
- javascript
- postgresql
- python
- qloo
- render
- uvicorn
- weasyprint
