-
-
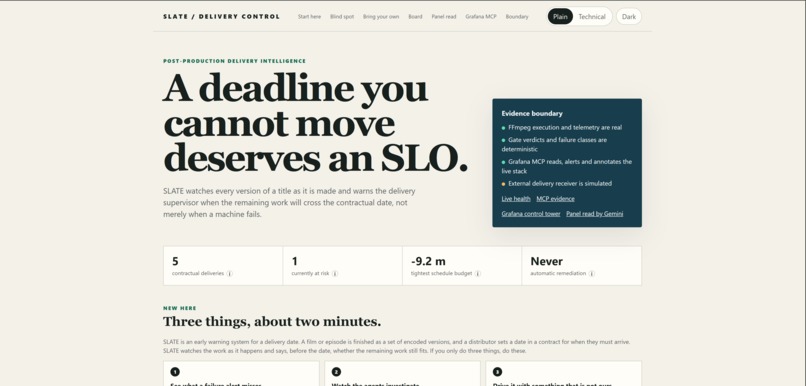
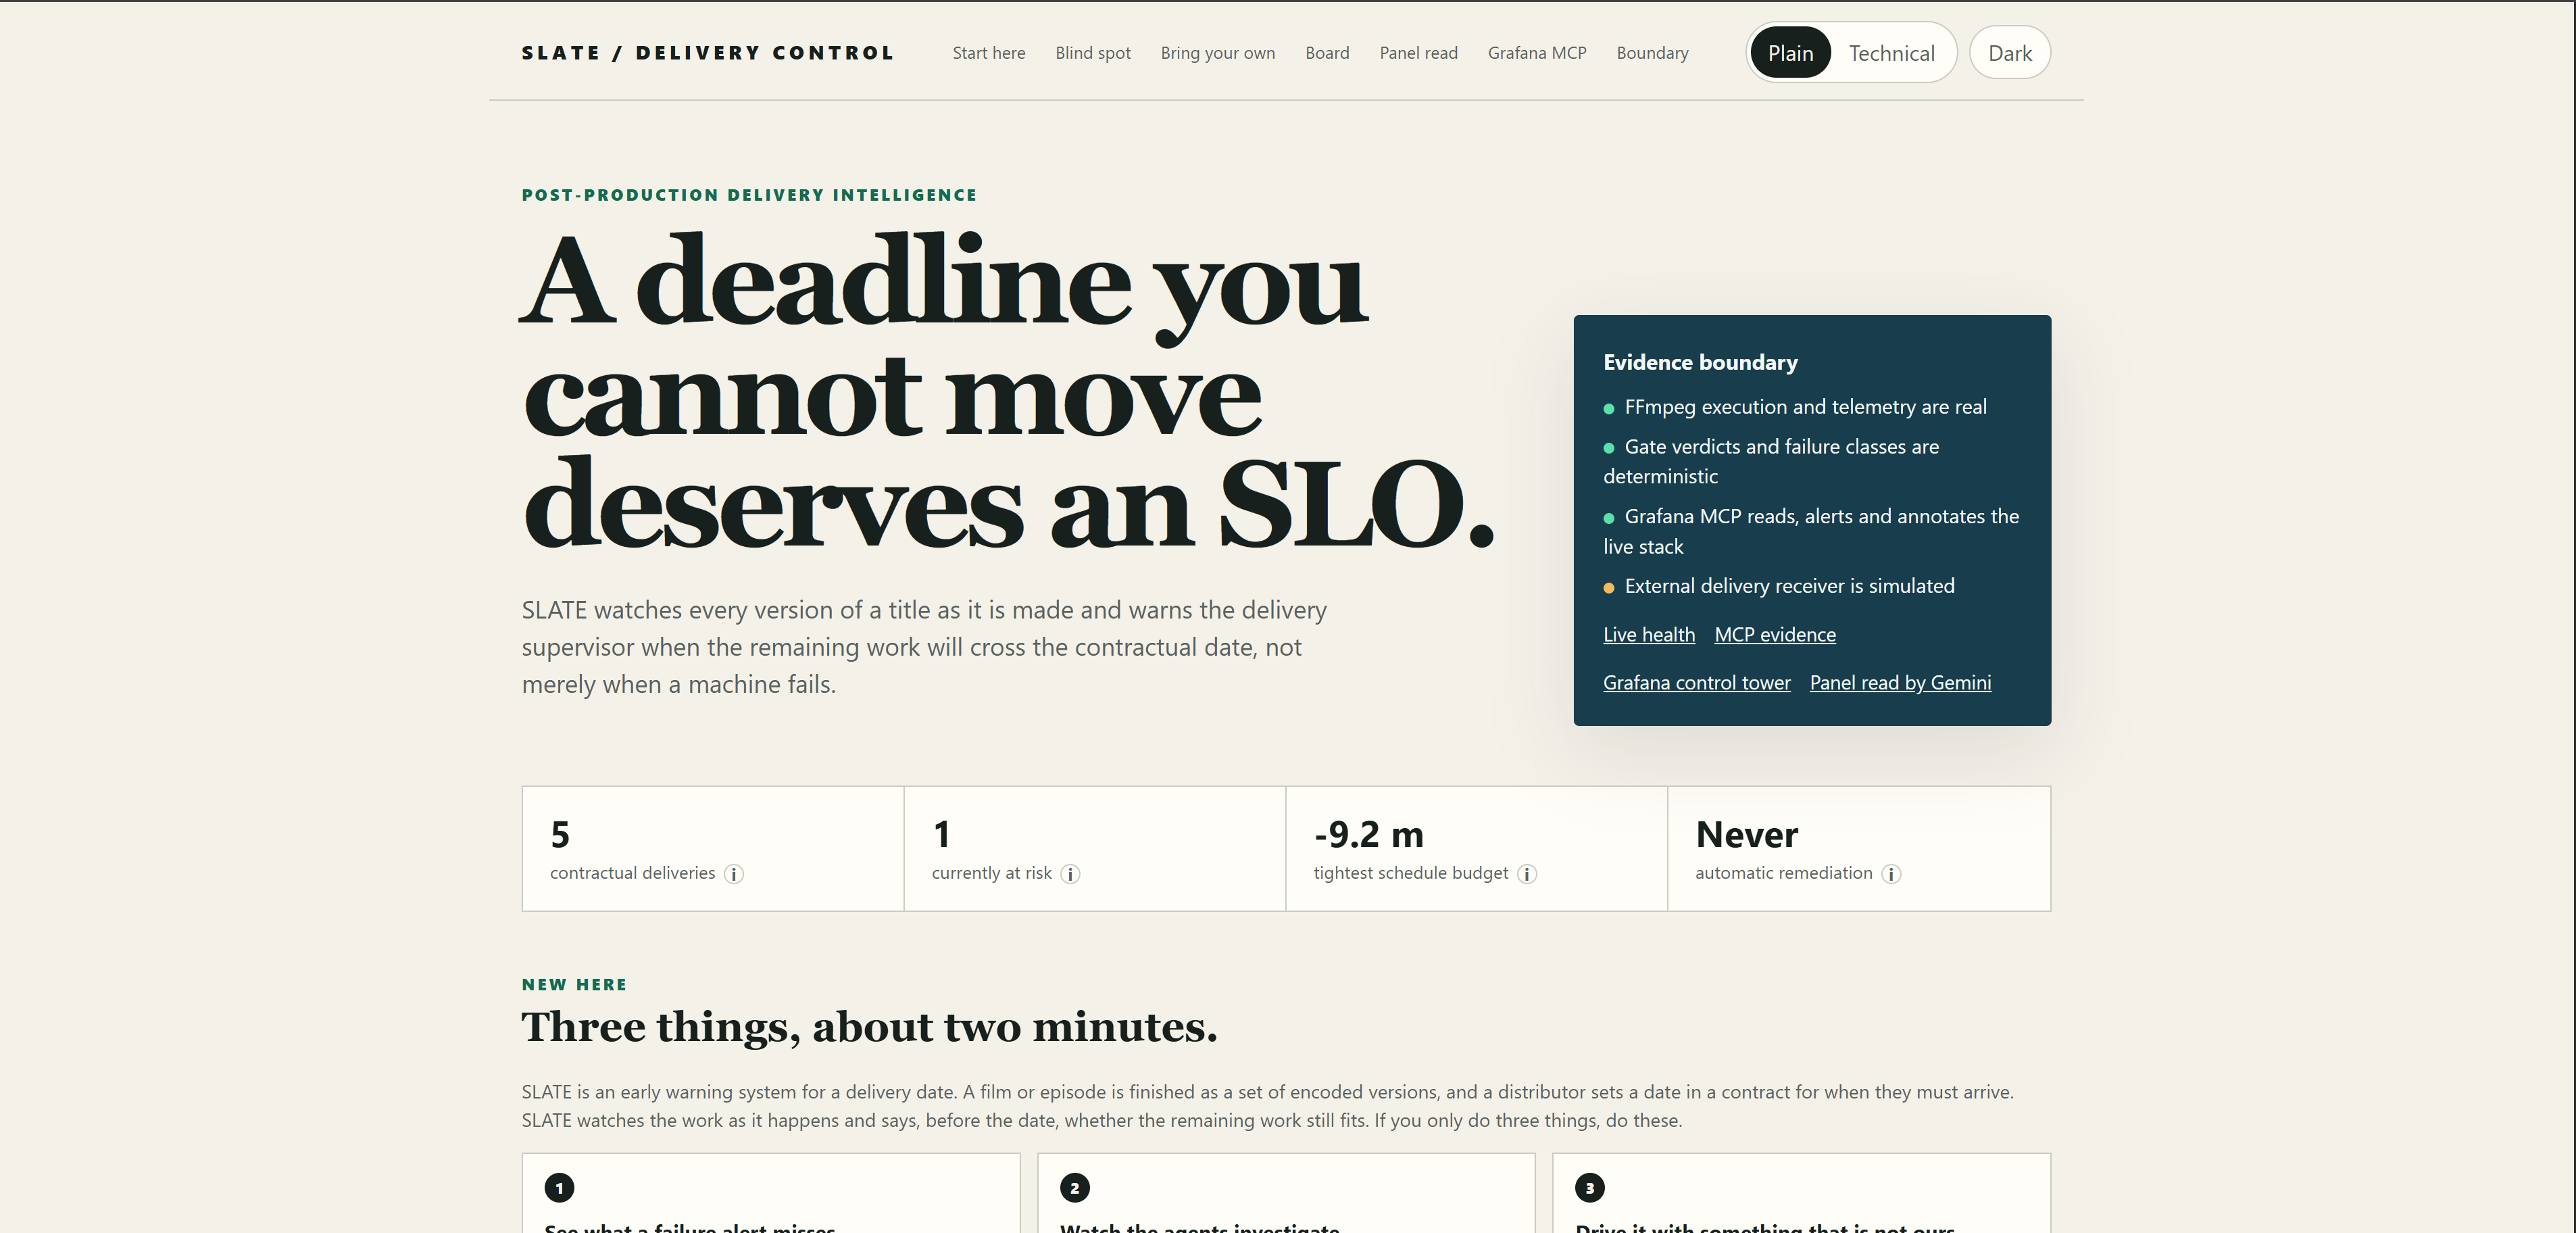
The whole pitch in one line, over a live board.Five contracted titles, one already projected to miss, and automatic remediation set to never
-
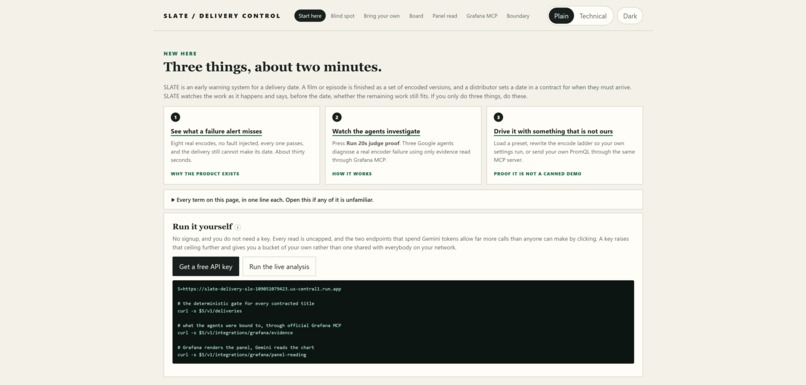
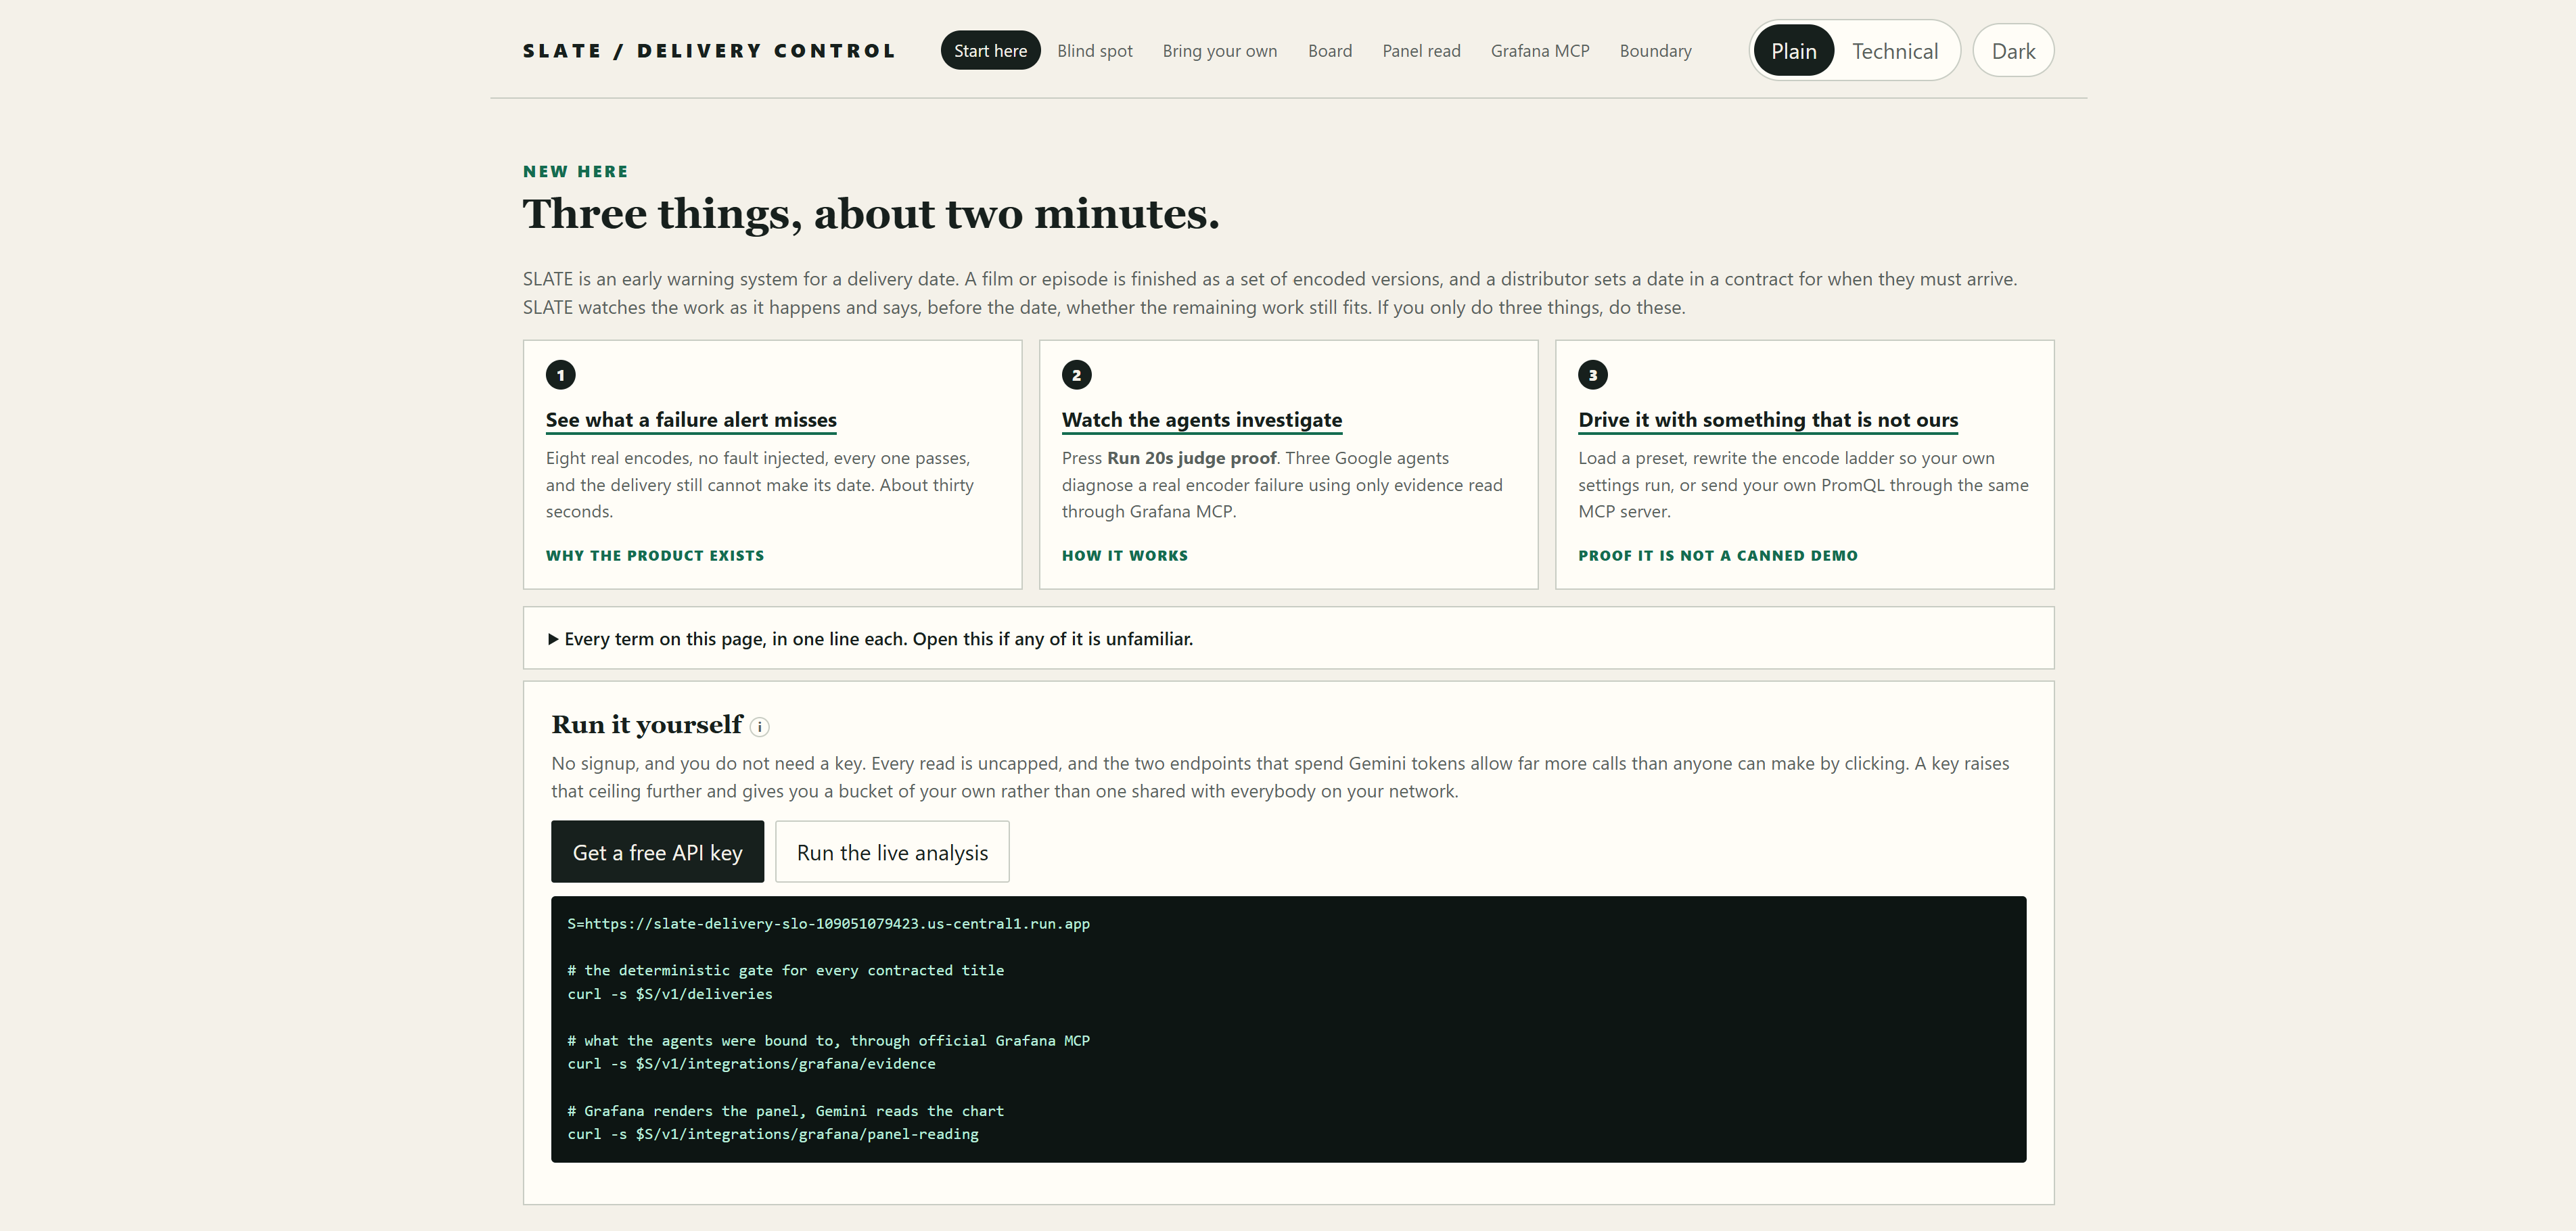
A two minute on-ramp for anyone new. Three things to try, a glossary for every term, and curl commands if you would rather use the API.
-
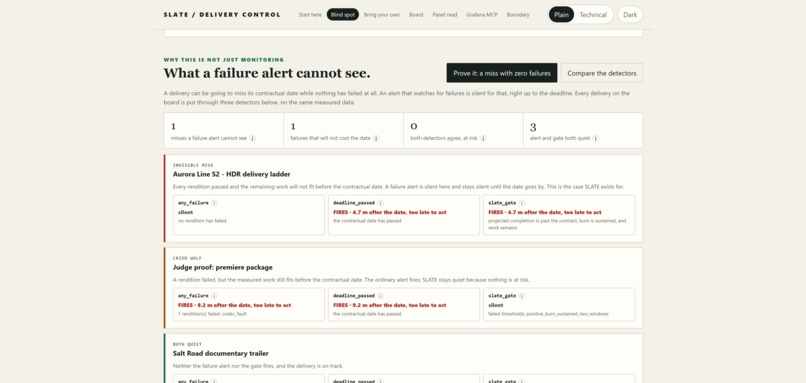
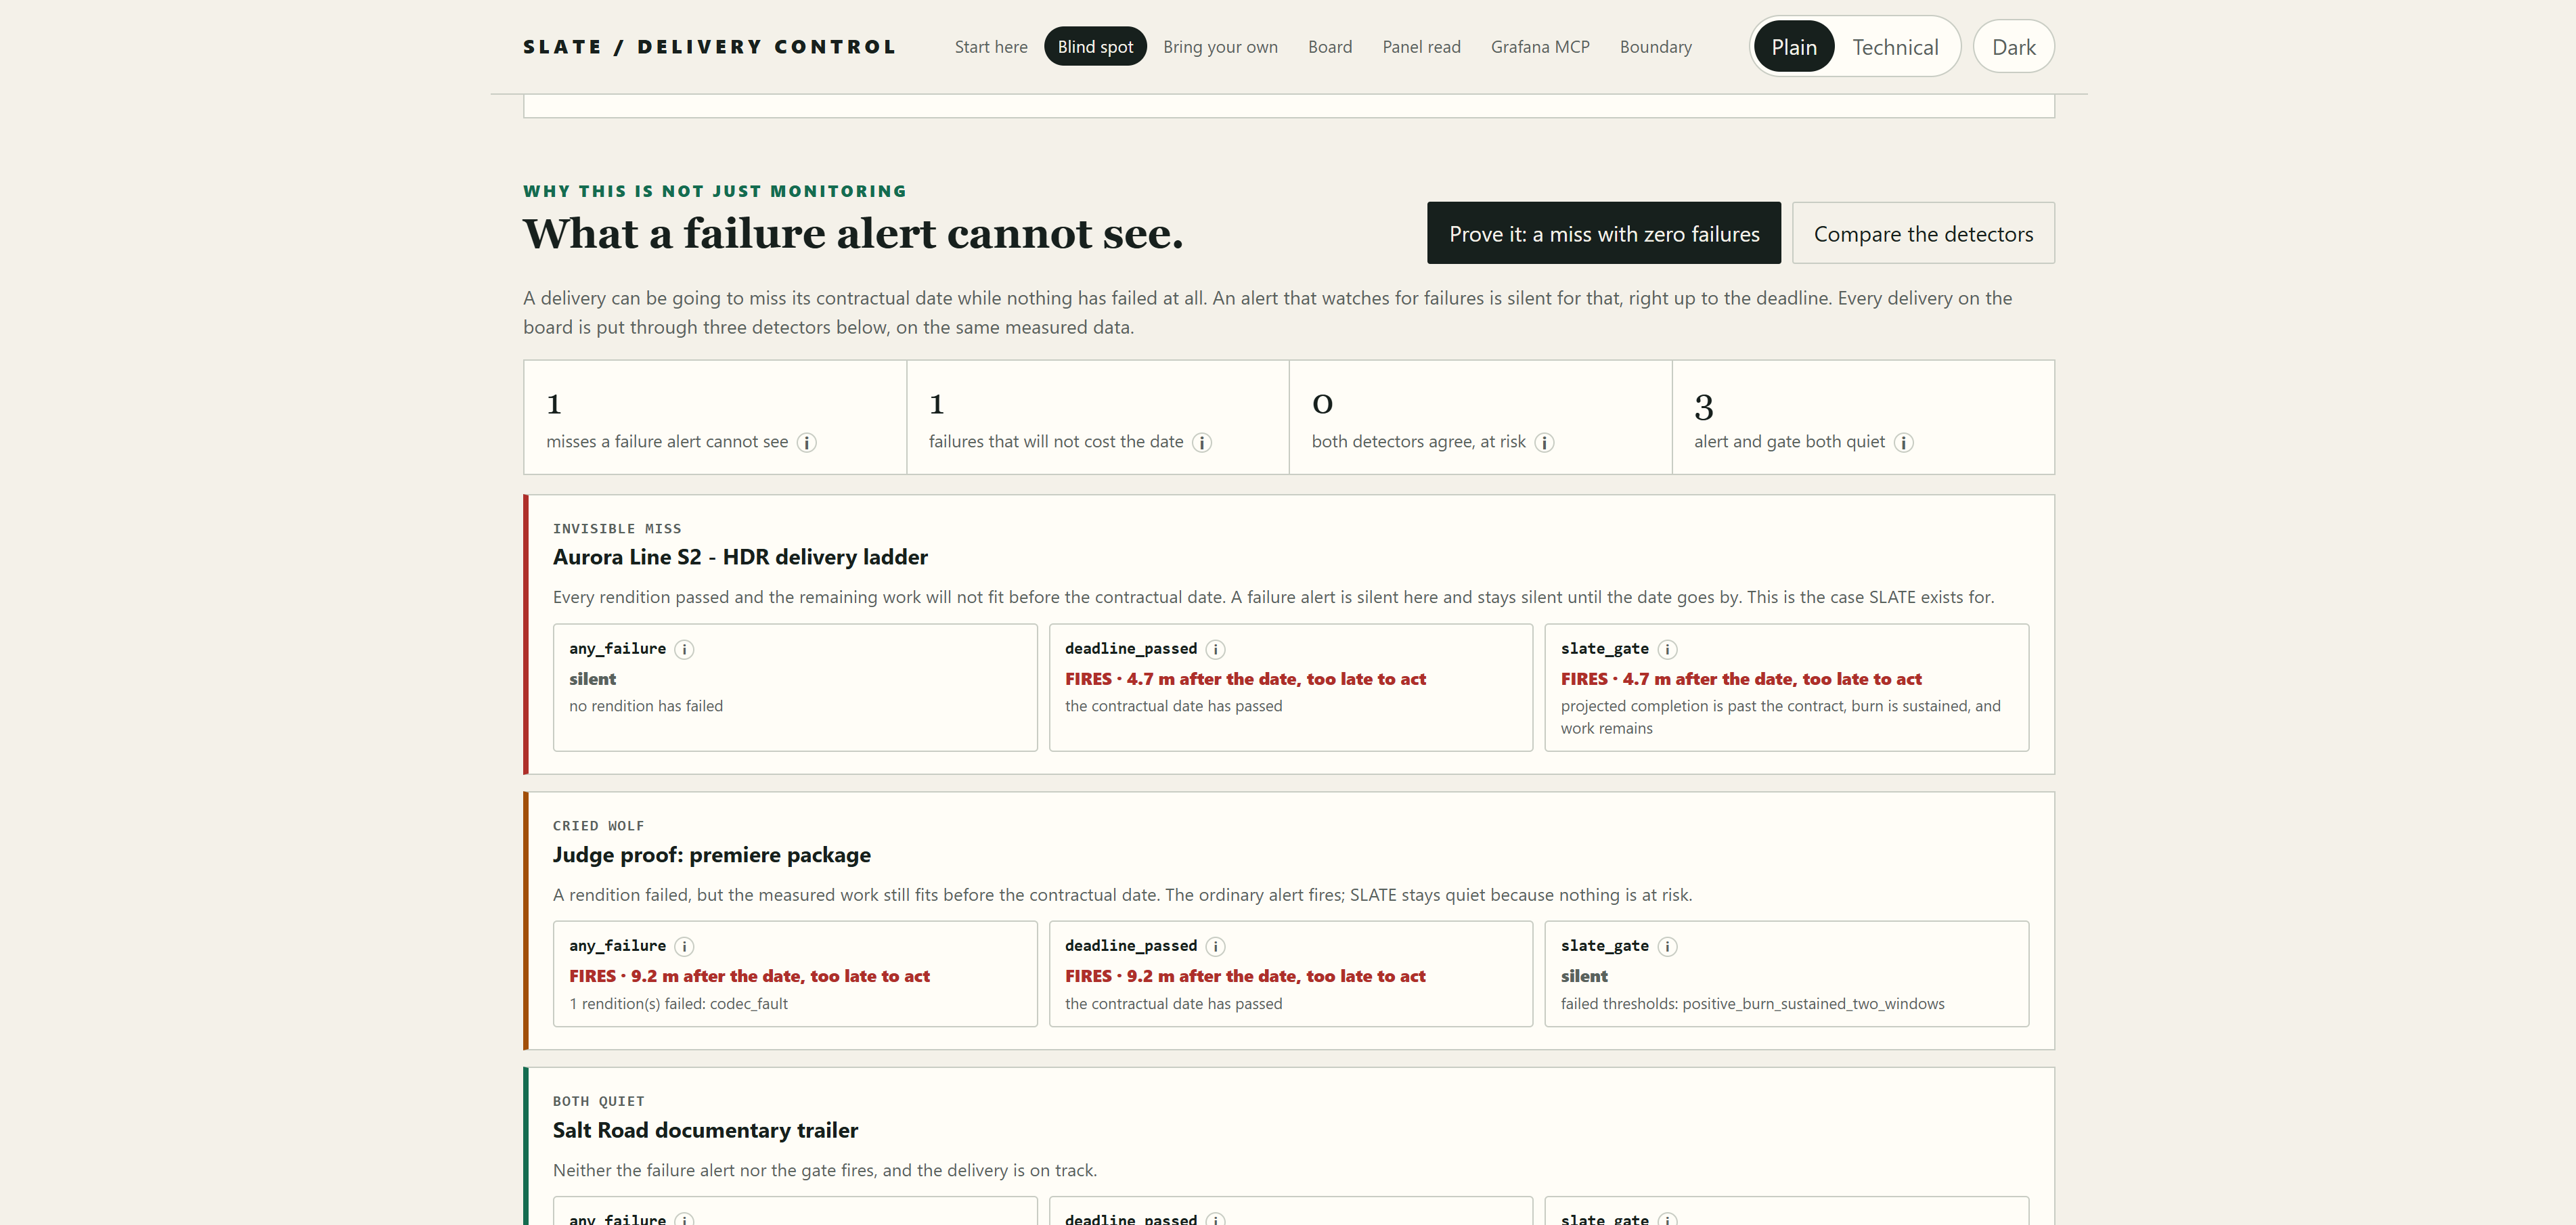
Three detectors, one set of measured data. Nothing failed, the failure alert is silent, and only SLATE says this delivery is going to miss.
-
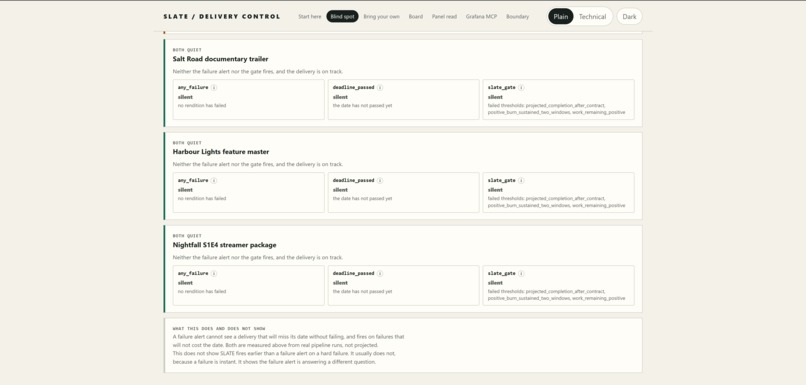
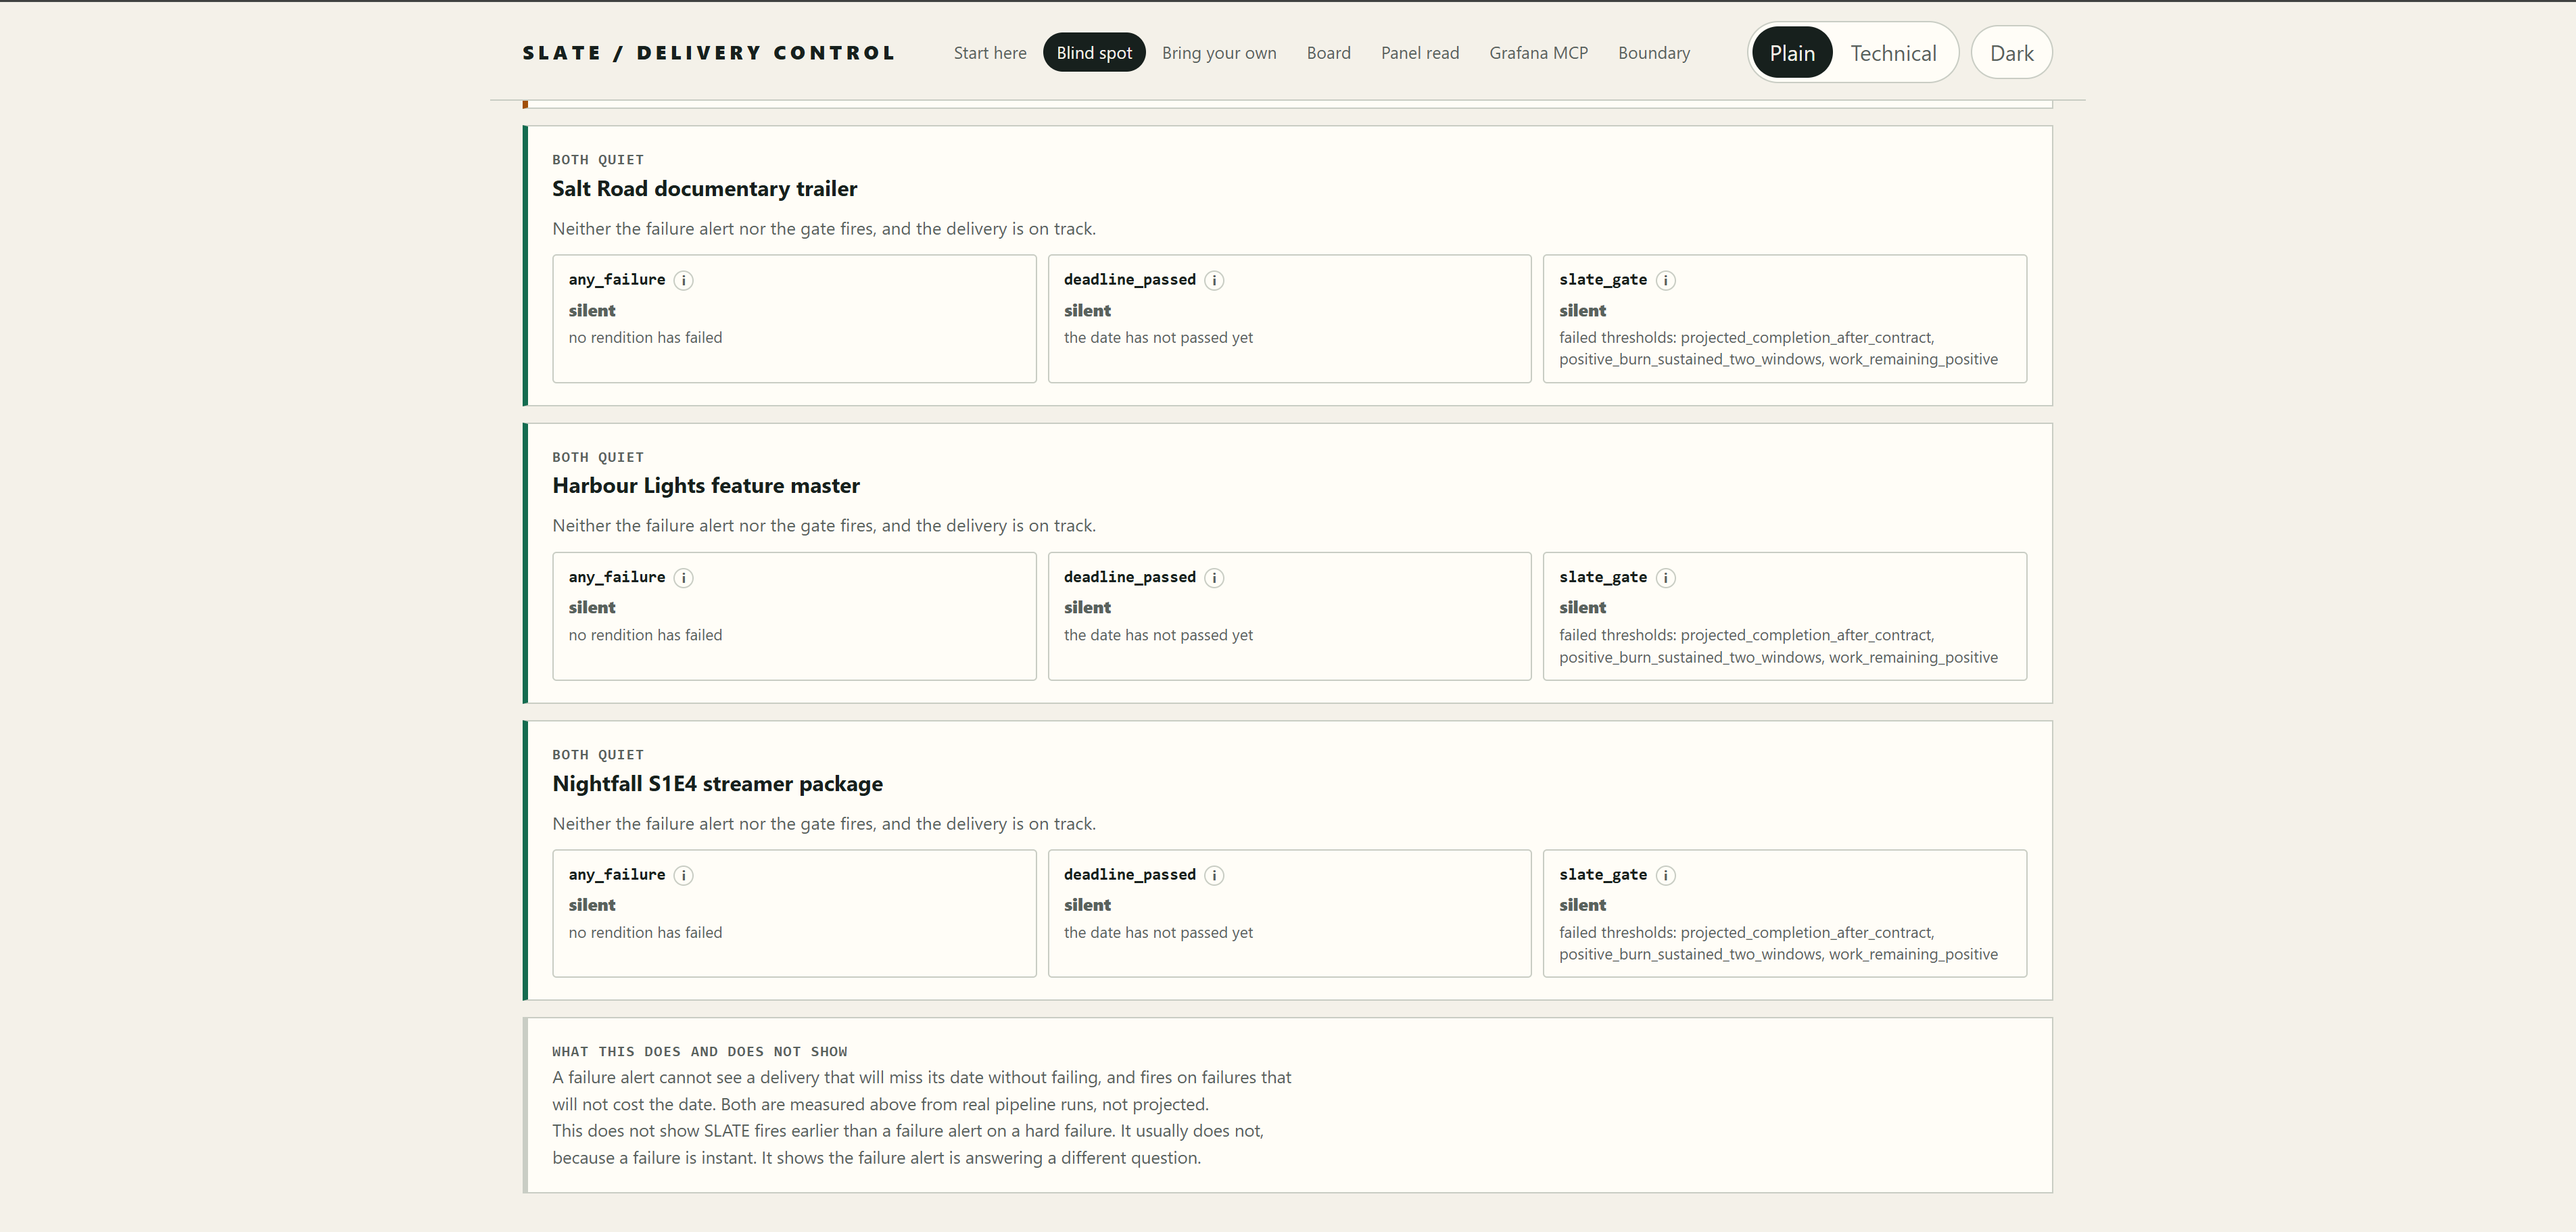
Every title on the board put through the same three detectors, including the quiet ones. Being silent when nothing is wrong is also a result
-
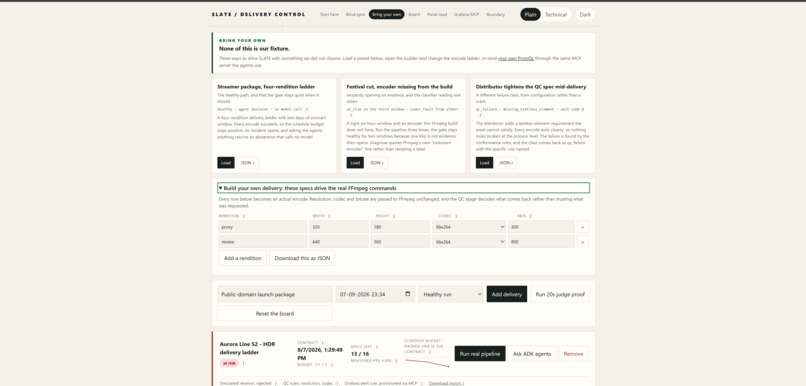
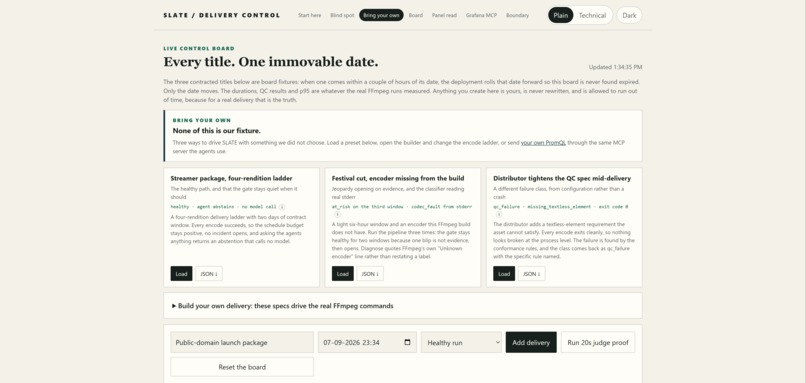
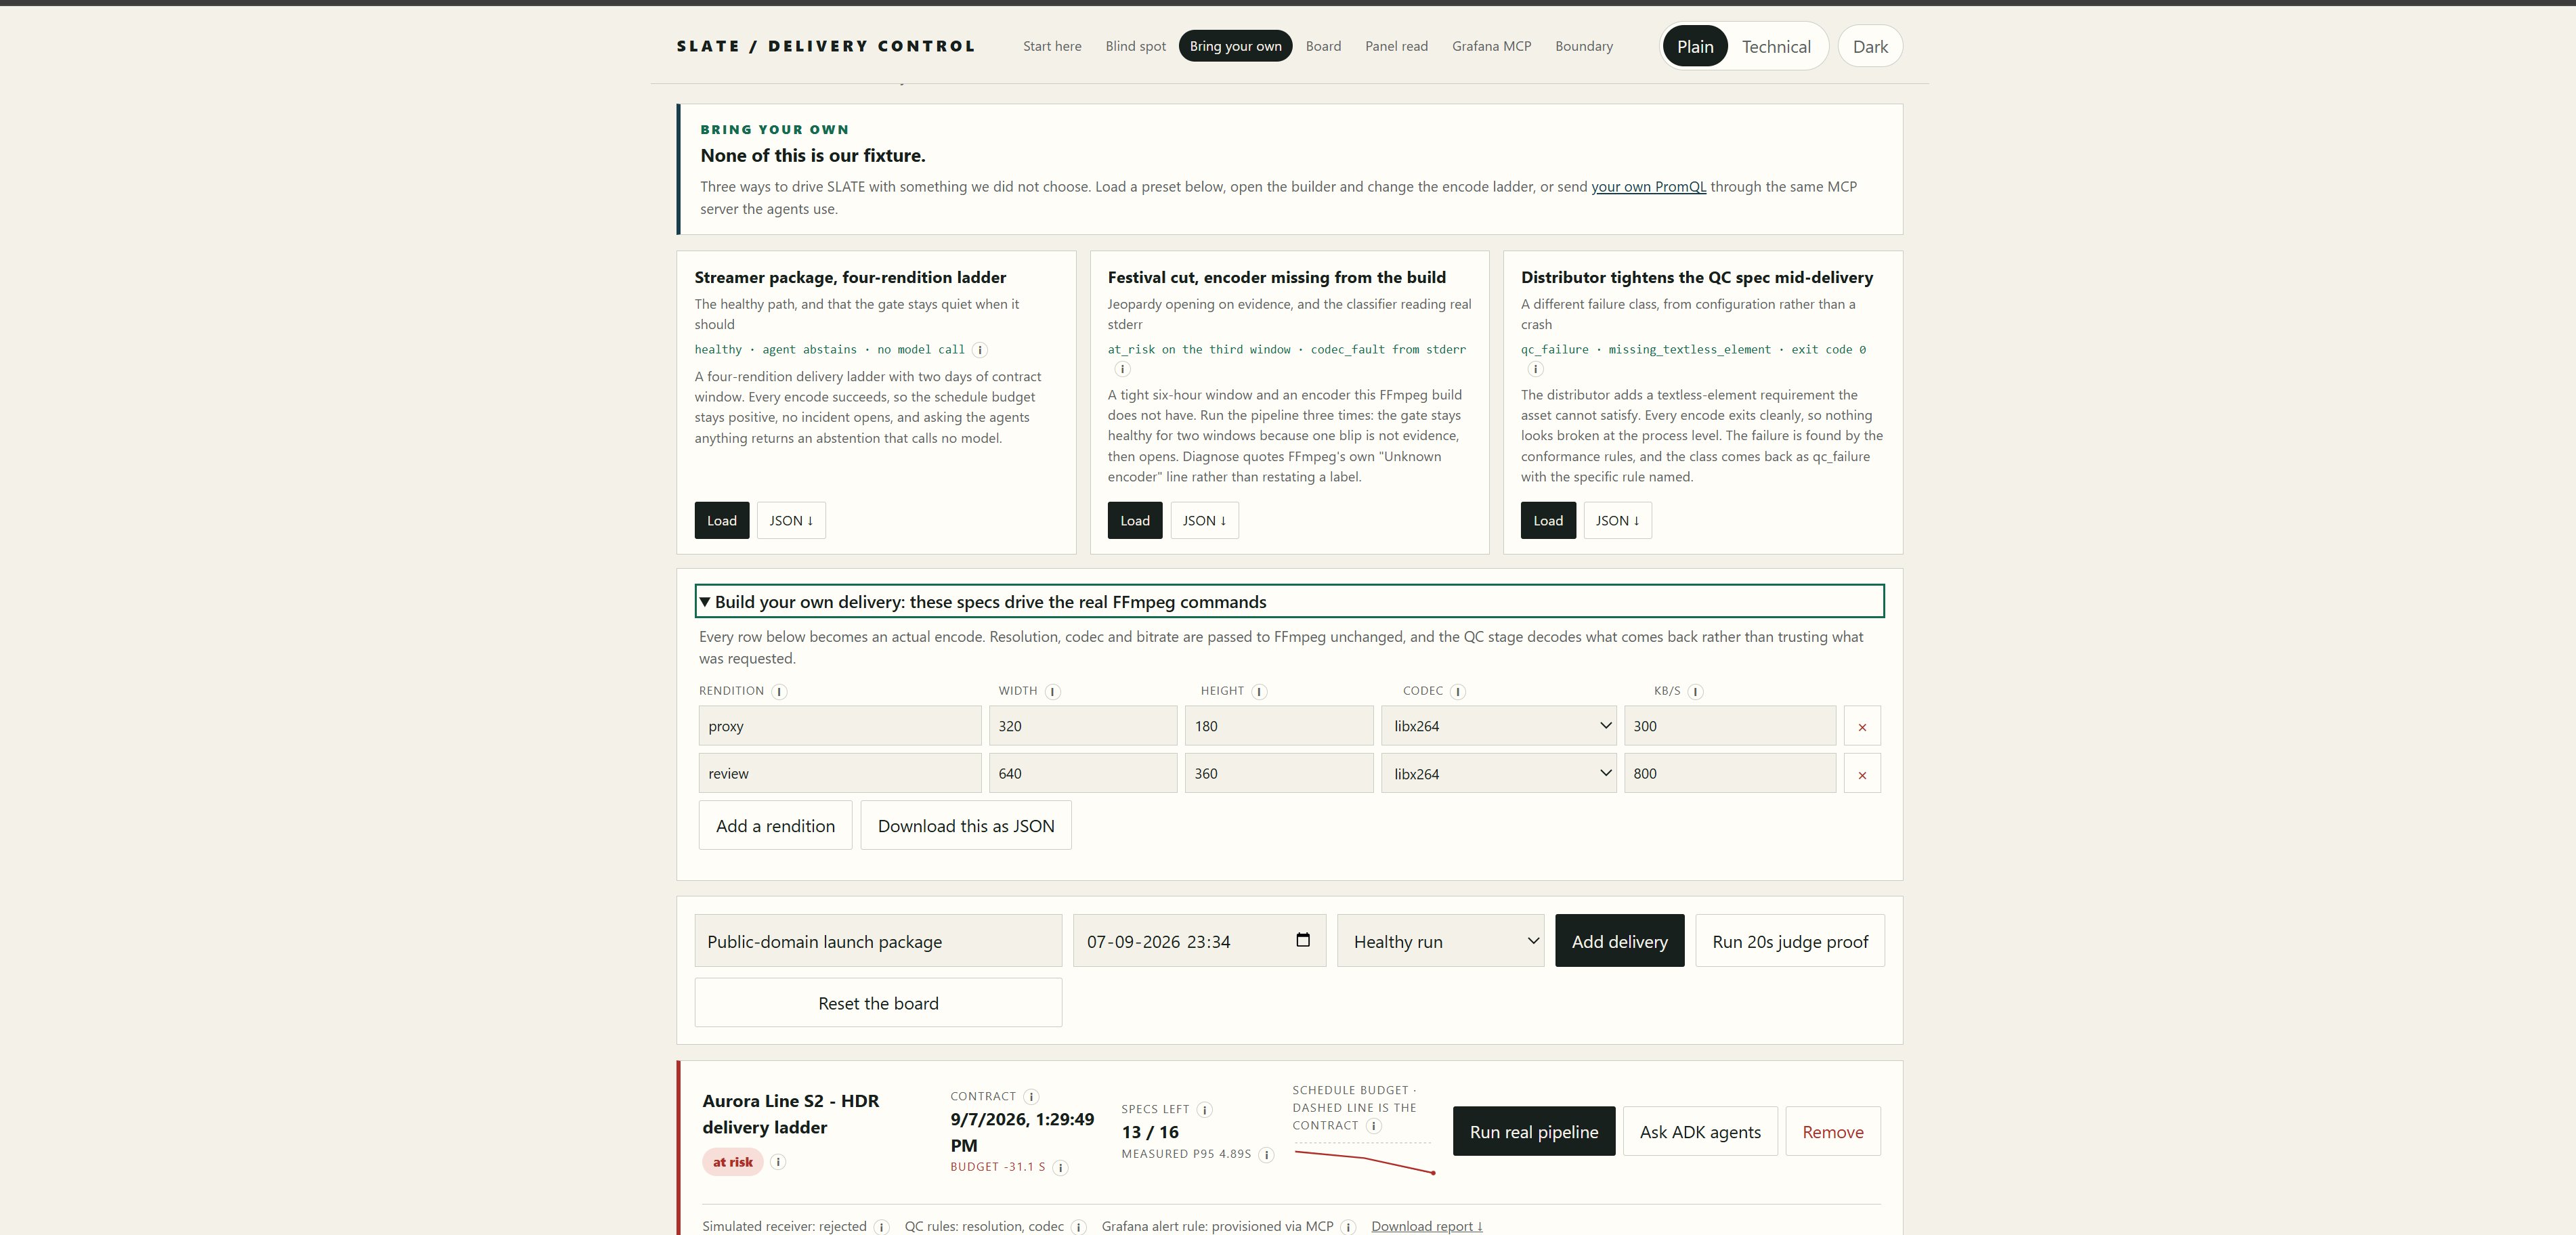
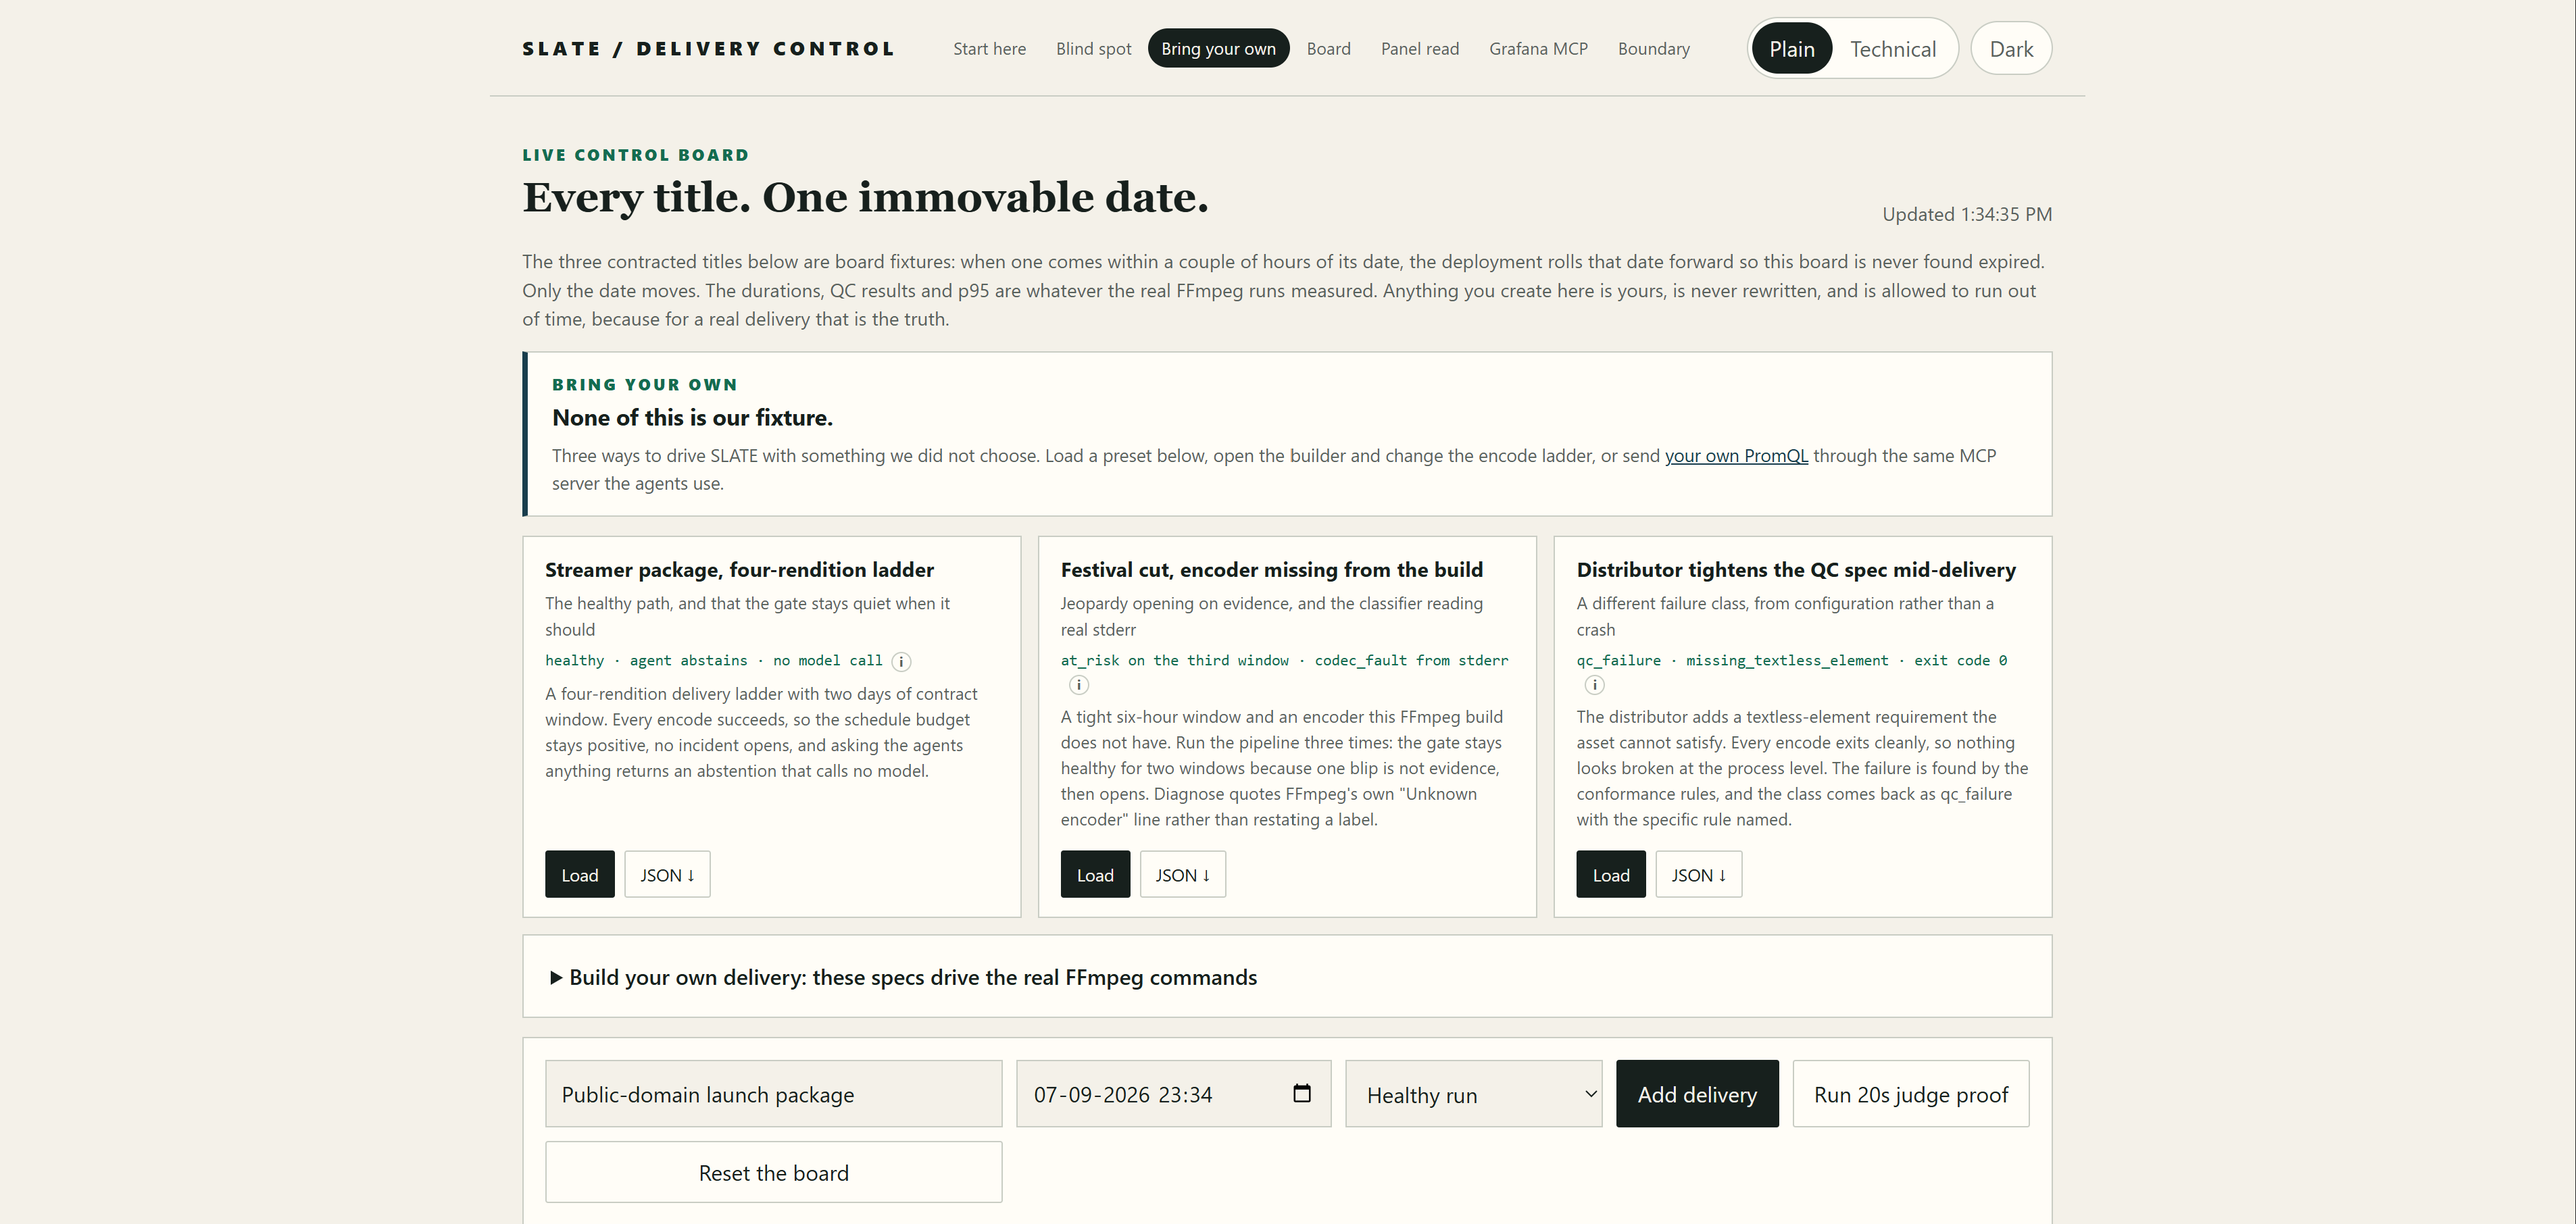
None of this is our fixture. Load a preset, rewrite the encode ladder row by row, or send your own PromQL through the same MCP server.
-
Every row here becomes a real FFmpeg argument. Ask for something out of range and you get a 422 back, never a silent clamp.
-
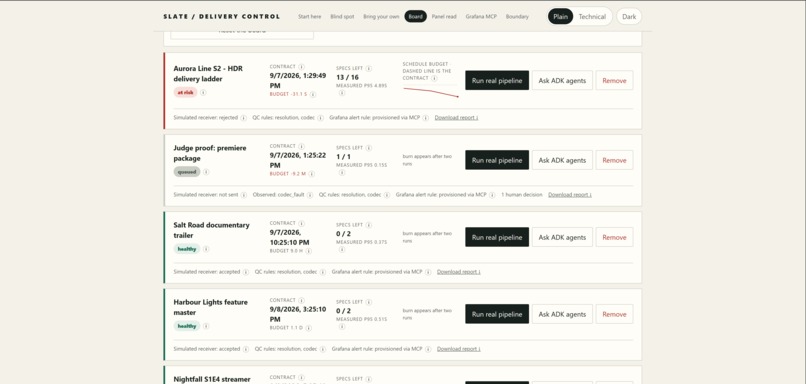
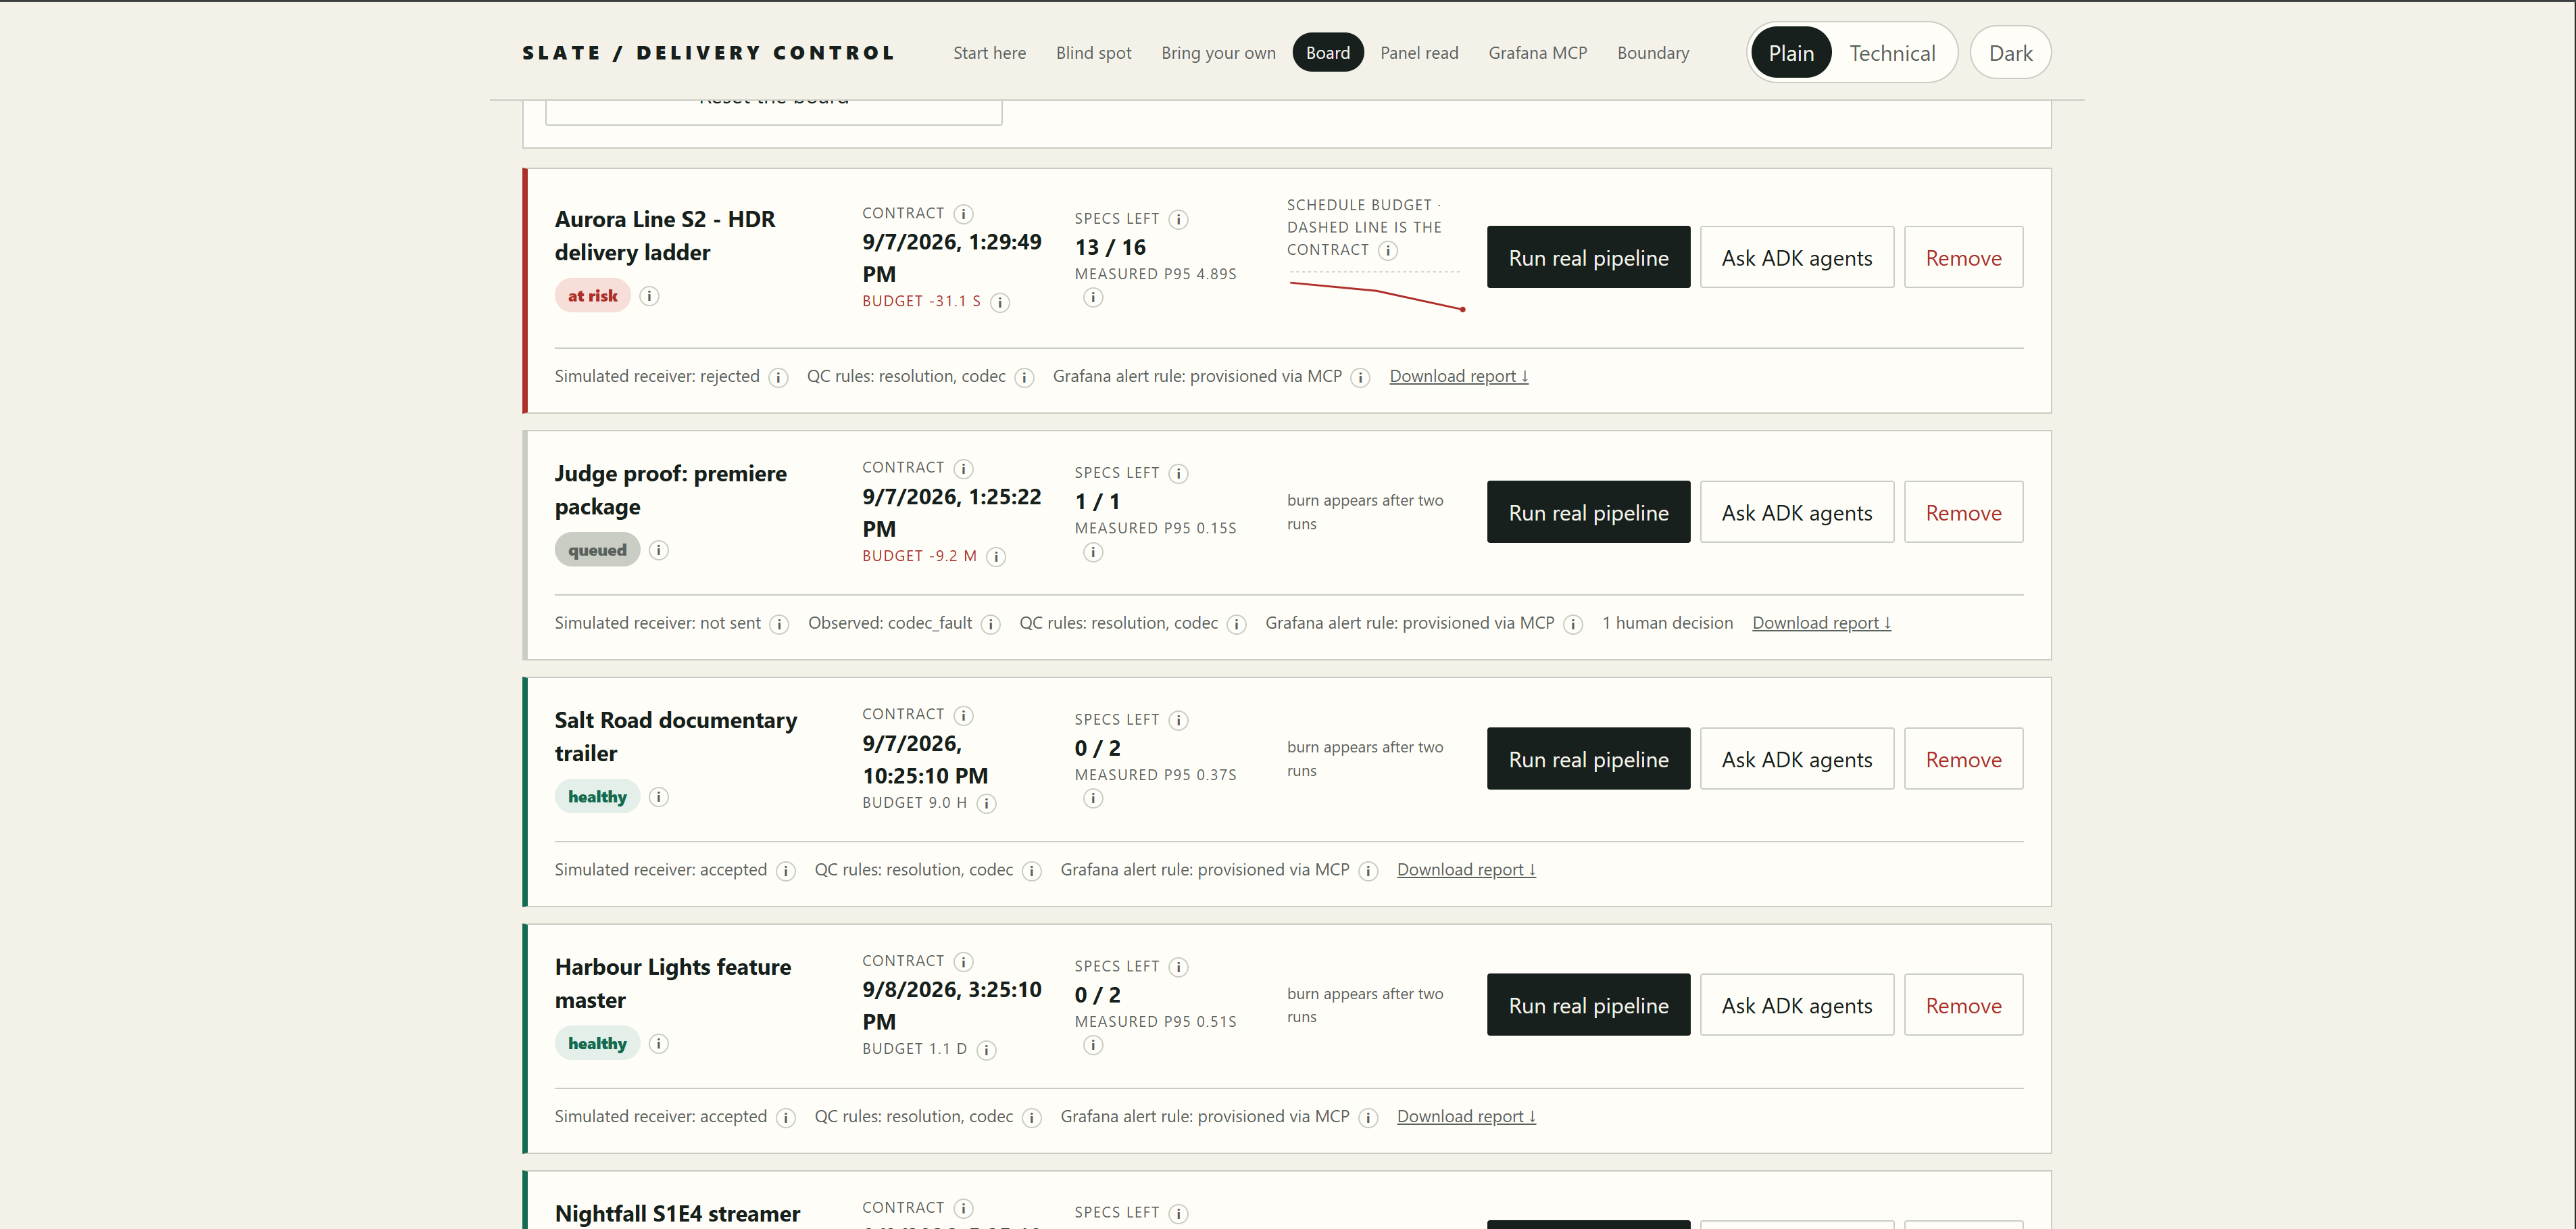
The live board. Contract date, versions left, measured p95, and the schedule budget burning down toward the dashed contract line.
-
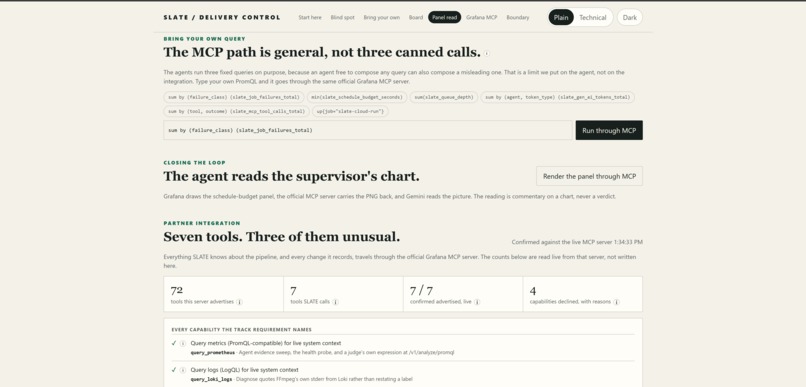
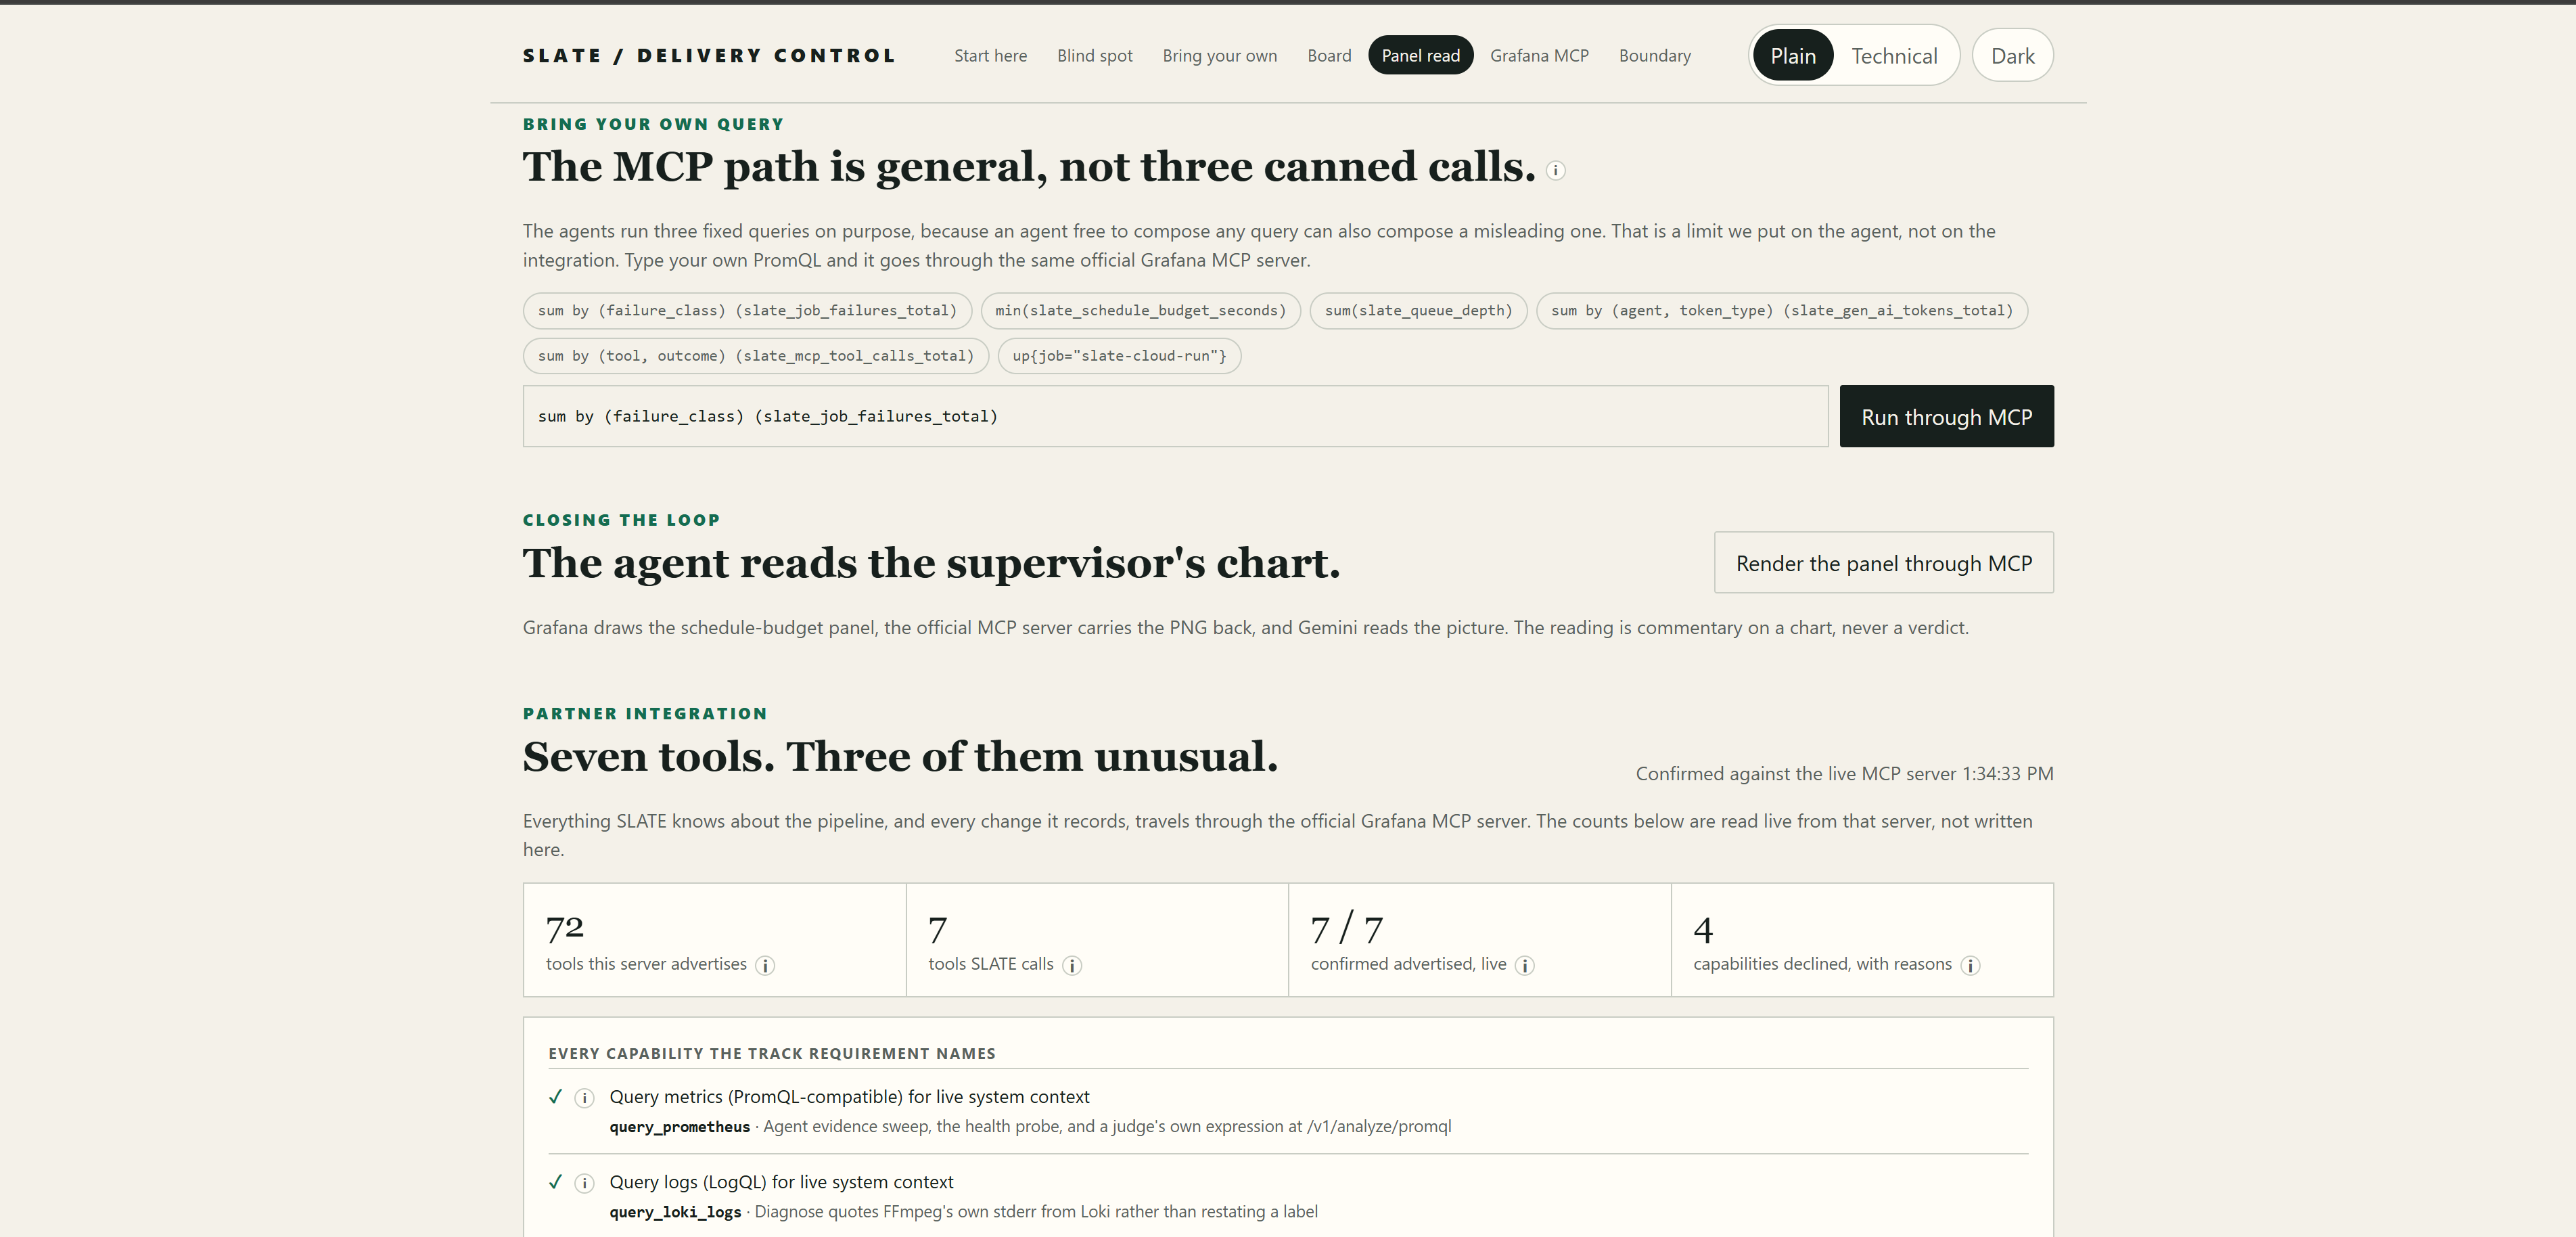
Type your own PromQL and watch it travel through the official Grafana MCP server, the same path the three agents are limited to.
-
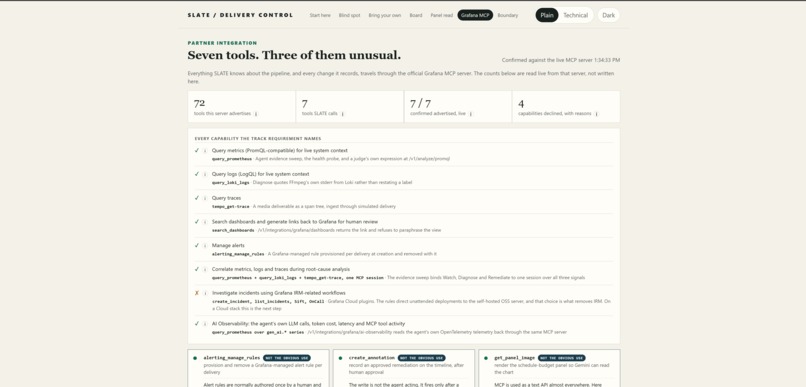
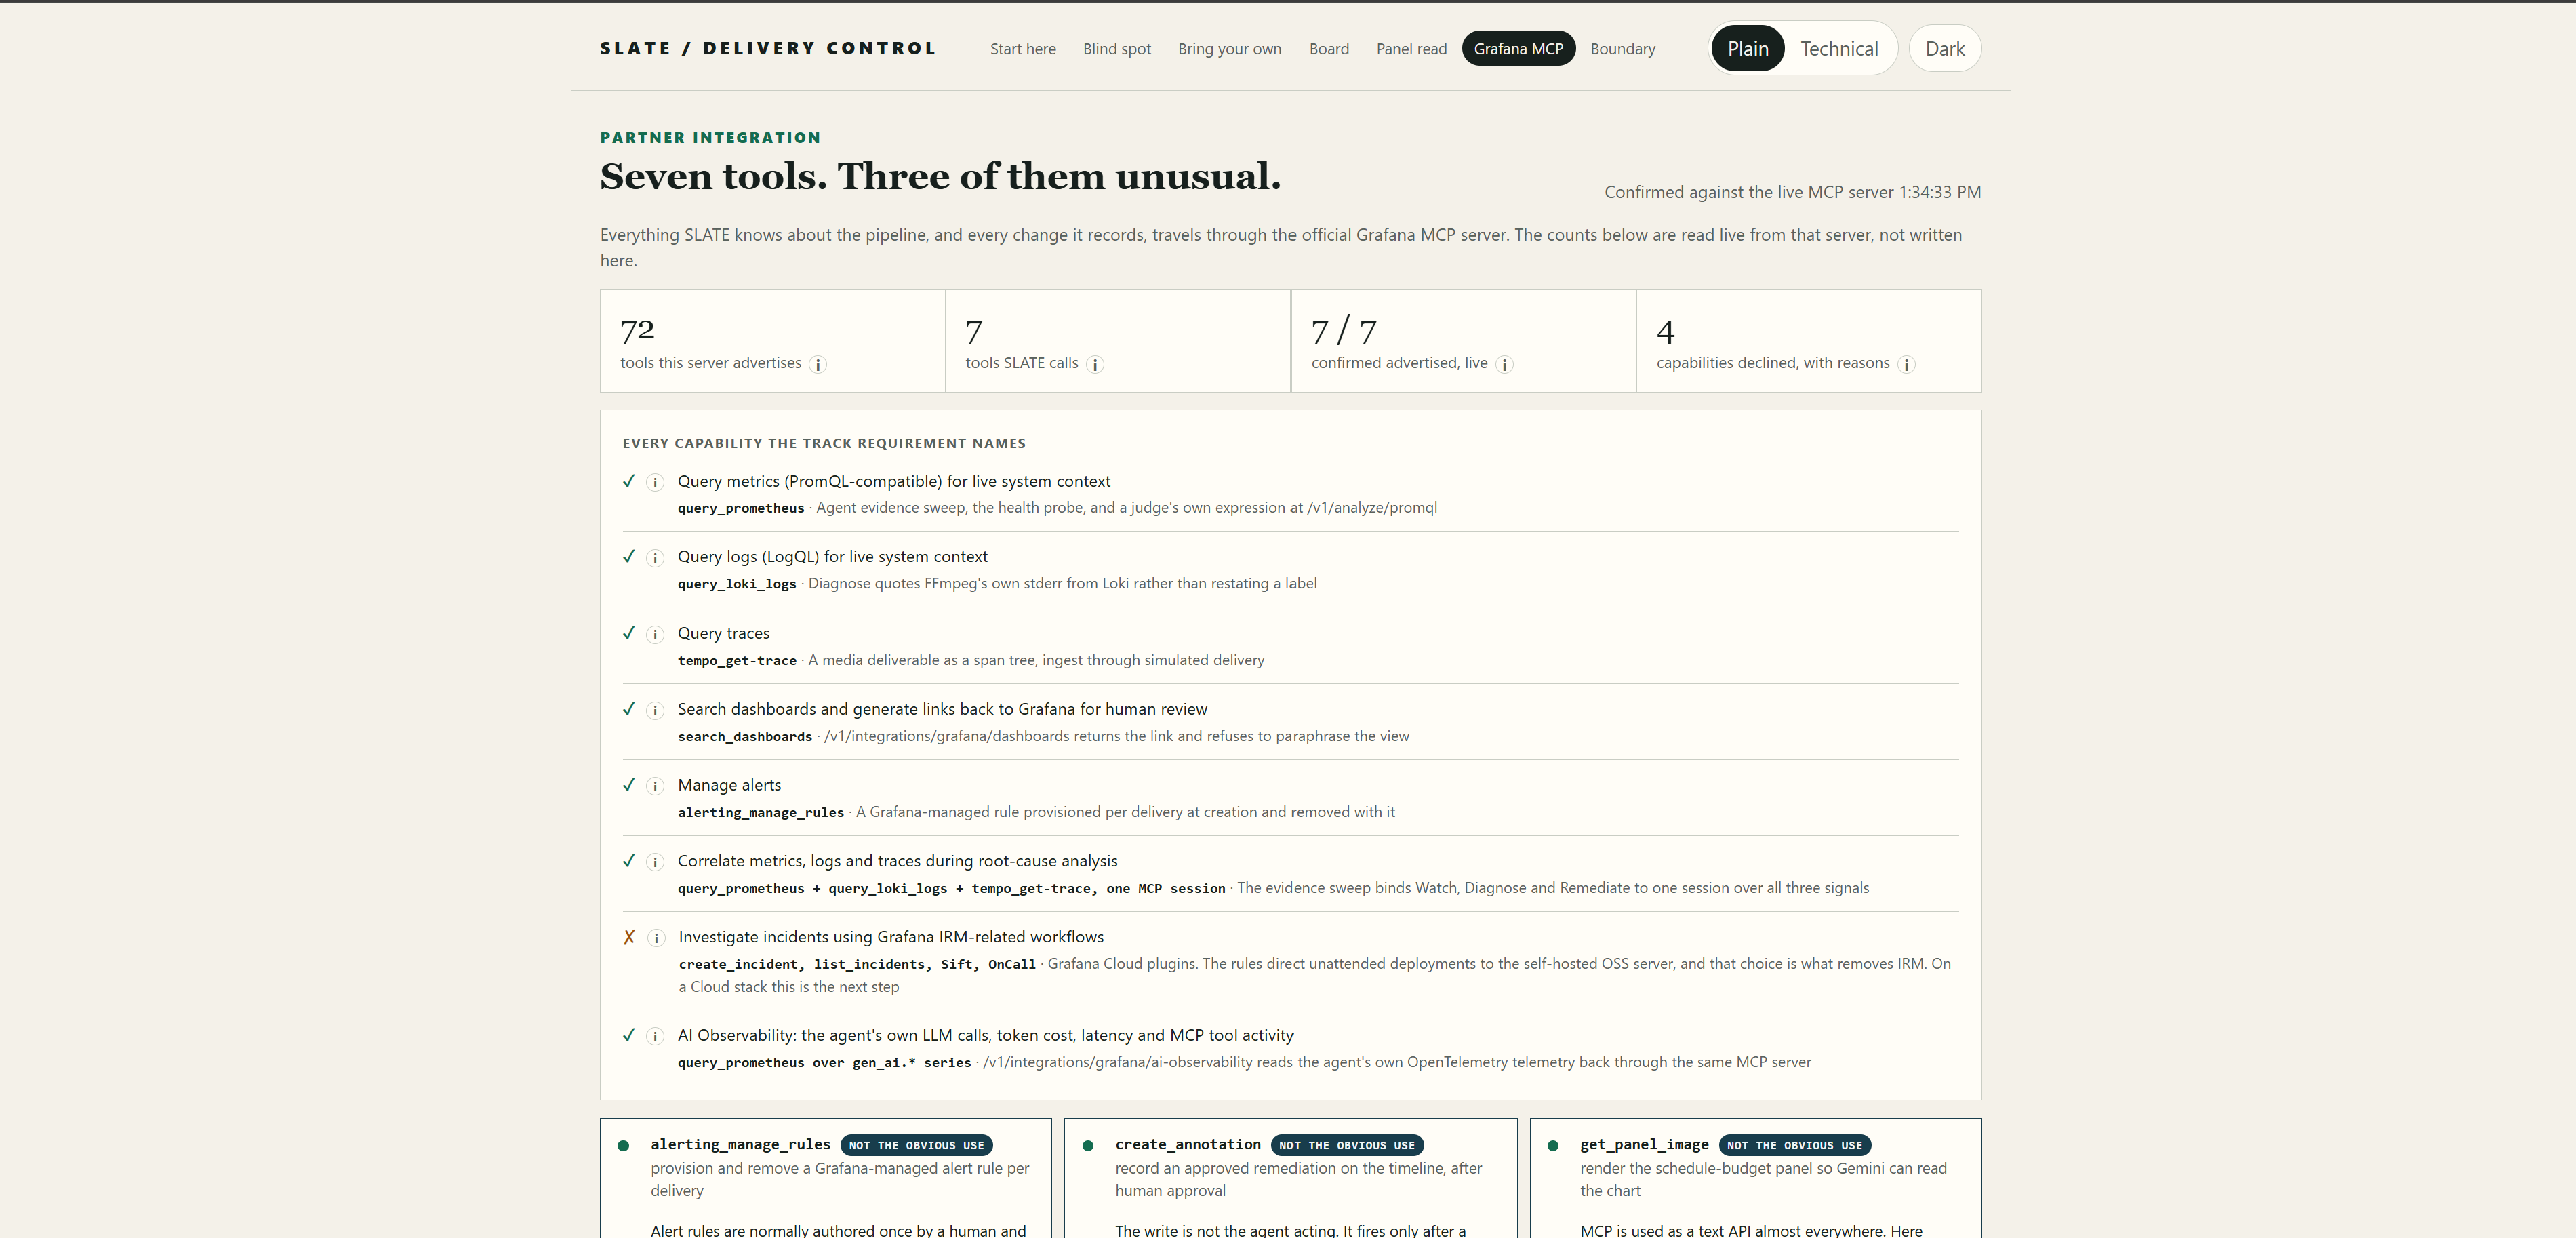
Seven tools out of seventy-two, each with a reason, checked against the live server.Every capability the track asks for, mapped line by line
-
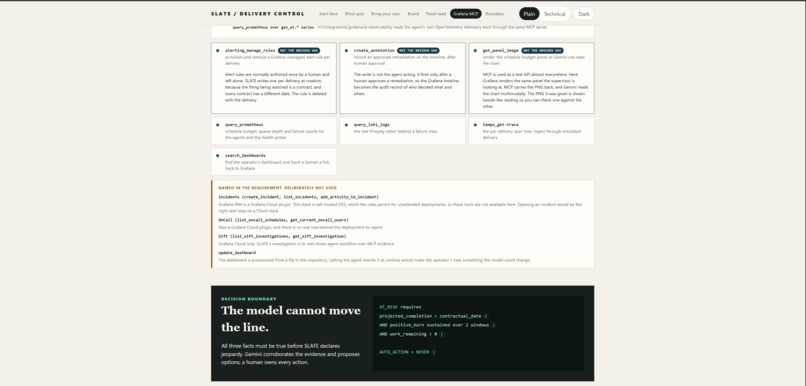
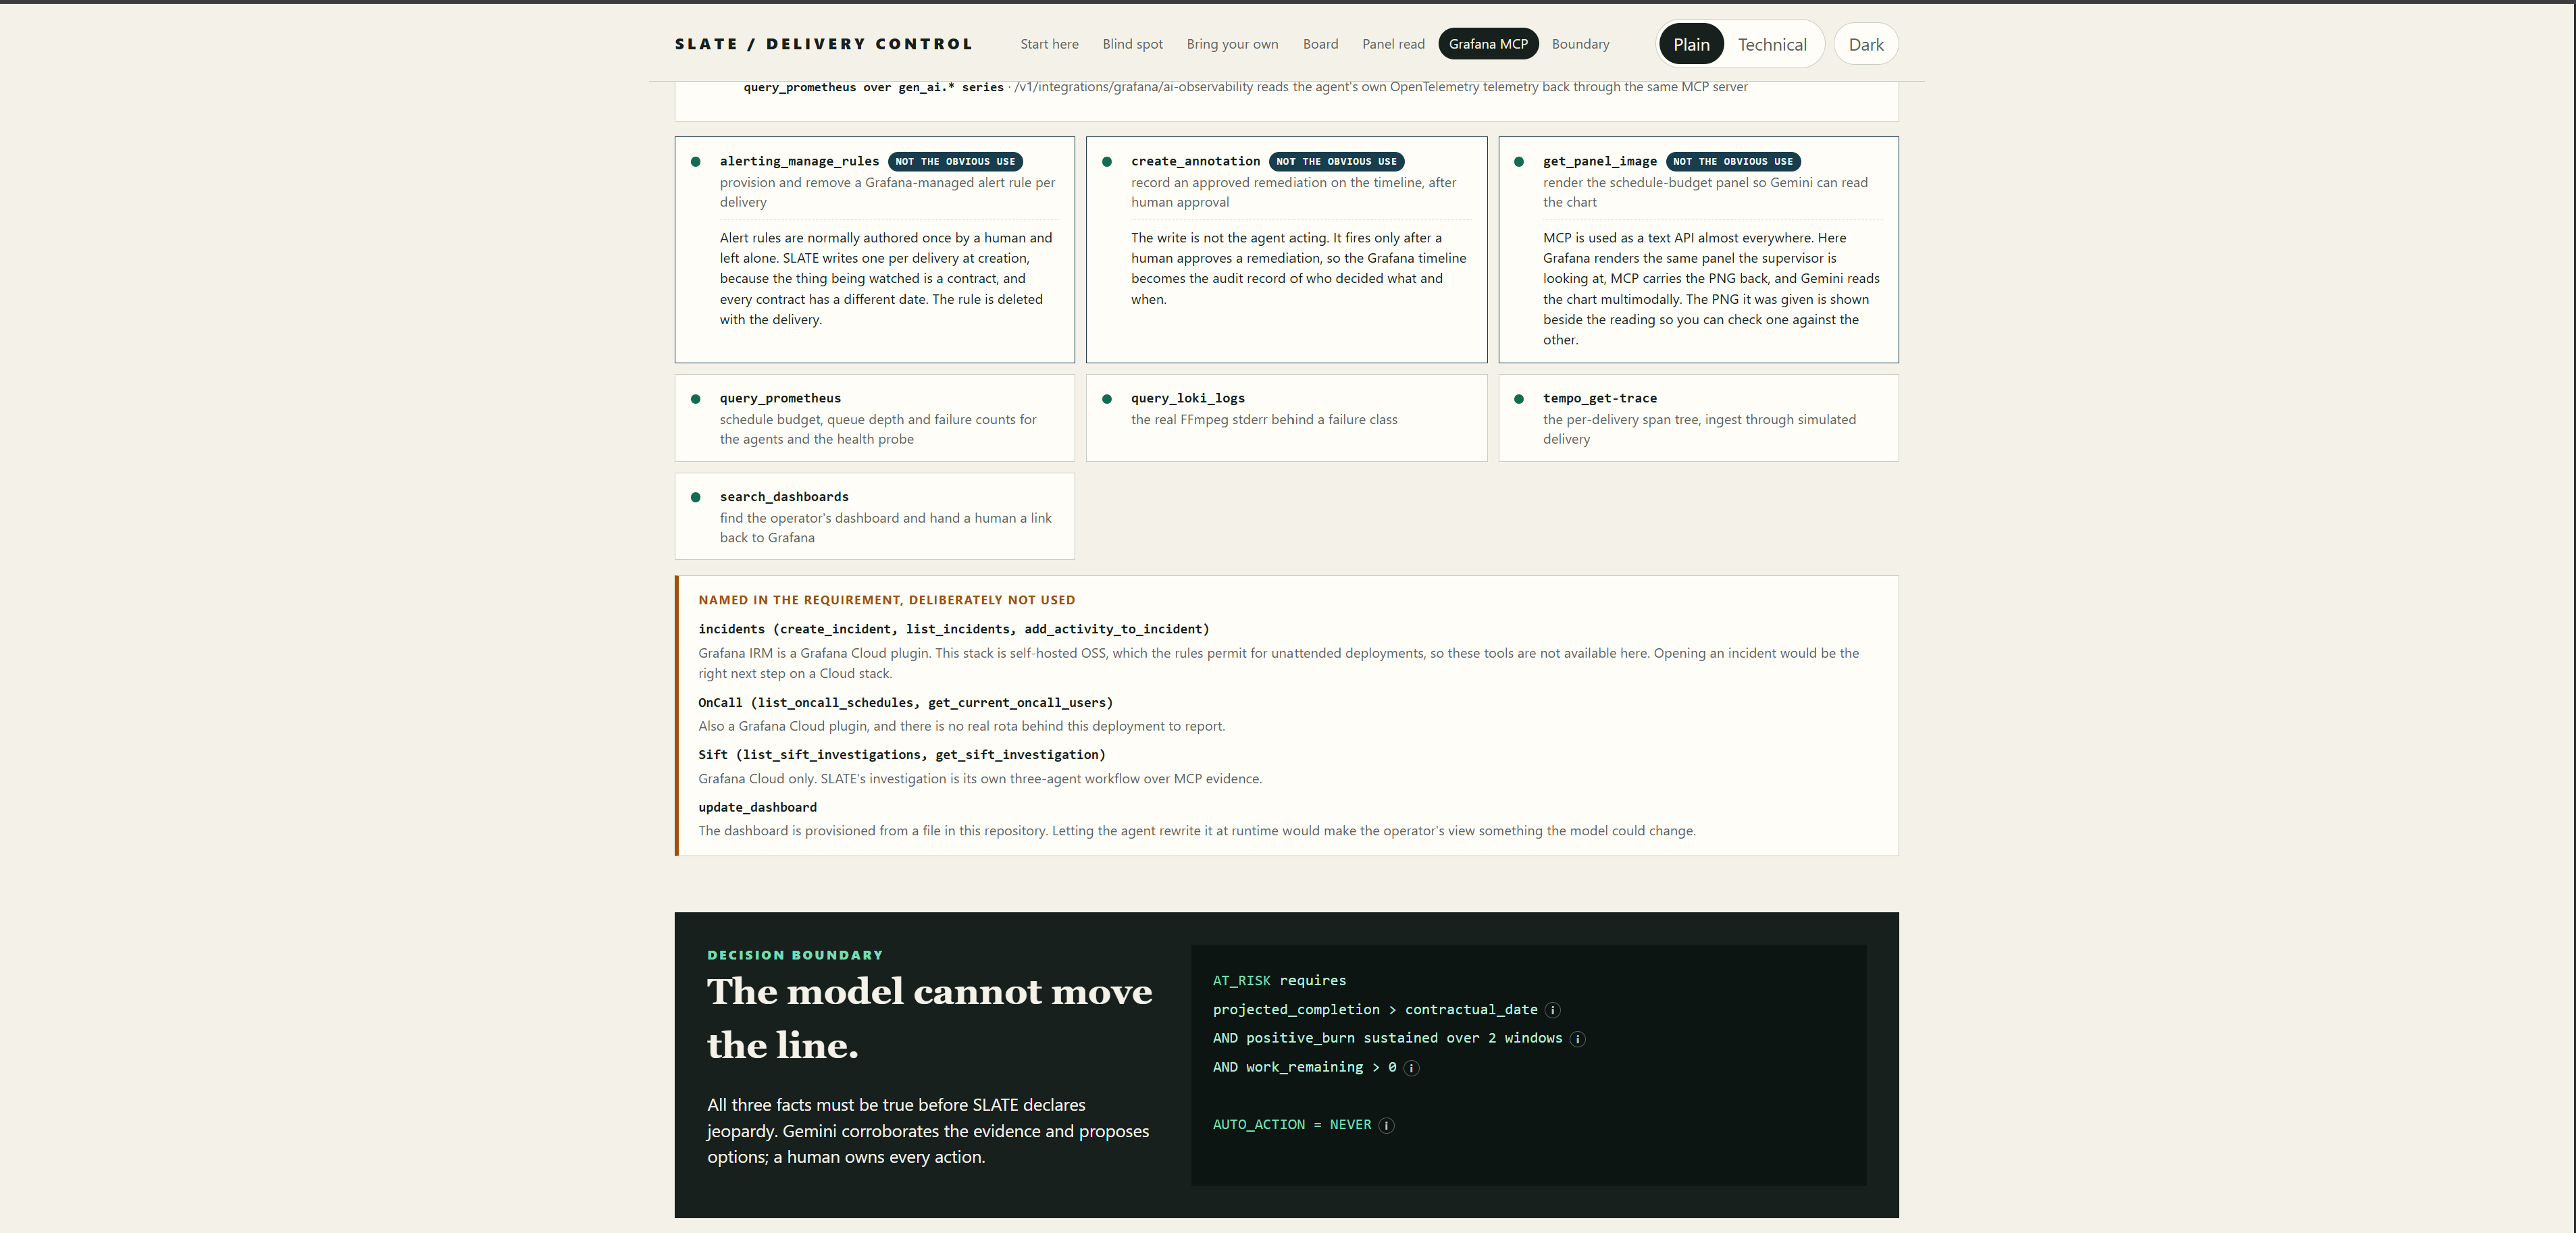
Three uses that are not the obvious ones, four capabilities declined with reasons, and the three conditions no model is allowed to move.
Inspiration
A delivery date in post-production is written into a contract. Miss it and a release slips, or a broadcaster handoff is missed.
The strange part is how people find out. Everything upstream of that date watches for things breaking: an encoder crashes, a file is corrupt, a check fails. So a facility learns it is going to miss the date at the moment it misses it.
But a delivery can be lost with nothing broken at all. Every version encodes perfectly, every check passes, and there is simply more work left than there is time. No alarm goes off, because nothing is wrong. It is just too late.
Site reliability engineering already solved the shape of this problem, with error budgets and burn-rate alerts that fire while you can still act. We took it from the source:
- Google, Site Reliability Engineering, ch. 4, "Service Level Objectives", which introduces the error budget as an allowance you spend rather than a line you must never cross.
- Google, The Site Reliability Workbook, ch. 5, "Alerting on SLOs", which defines burn rate as how fast a service consumes that budget, and shows why alerting on the rate beats alerting on the breach.
We applied it literally, with one inversion: the deadline is the hard constraint, and schedule is the resource being burned.
delivery_window = contractual_date - now
work_remaining  = pending versions x measured p95 per version
schedule_budget = delivery_window - work_remaining
Below zero, the delivery is projected to miss. SLATE watches that number fall, and says something before it reaches zero.
What it does
You can check the central claim yourself in about thirty seconds. Open the app and press "Prove it: a miss with zero failures."
It runs a real media pipeline. SLATE generates a source, encodes it into deliverable versions with FFmpeg, runs conformance checks on what actually came back, packages the result and hands it to a delivery endpoint. Every duration, failure, byte count and log line on the page came from work that really happened. Nothing is simulated except the distributor at the far end, and the product says so wherever it matters.
It warns before the date, not after. A plain function decides whether a delivery is in jeopardy, and three things must all be true: projected completion is past the contract, slack has been falling across two consecutive windows, and work remains. One bad moment is deliberately not enough to raise an alarm.
It proves the blind spot live. One button creates sixteen heavy renditions against a sixty second window with no fault injected at all, then encodes three of them with real FFmpeg. All three pass. The other thirteen are outstanding work the gate has to project, and by the third wave there is more work left than there is window. Three detectors then run over that same measured data:
| Detector | What it says |
|---|---|
any_failure |
Silent. Nothing failed, and it stays silent until the date goes by |
deadline_passed |
Silent. Correct, and useless |
slate_gate |
Fires, while there is still enough window left to act on it |
That is not a claim on a slide. It is half a minute of real encoding you can run yourself.
It says what the warning is worth. Underneath that result, SLATE reports what the extra time buys: doing nothing misses the date, and approving a small number of extra encoding workers lands it before the date, with the exact figures printed. In the run we measured while writing this, two extra workers landed it with seven seconds to spare. Those numbers move with how fast the machine is encoding, because they are arithmetic over the p95 those encodes just measured, not a rate card.
Three Google agents investigate, on evidence they cannot choose. Watch, Diagnose and Remediate run in order. Every observation travels through the official Grafana MCP server: the metrics, the logs, and the trace for that one delivery. Diagnose quotes FFmpeg's own error text rather than restating a label.
A person owns every action. Remediate can only propose from four things the system can really do, each with what it costs the schedule. The API returns 409 for any action the agent did not propose, and a Grafana annotation is written only once a human has approved one. The headline stat on the page reads automatic remediation: never.
It is not a fixed demo path. Three preset scenarios load in a click and download as JSON that is exactly what the create endpoint accepts. A ladder builder lets you change resolution, codec and bitrate, and those rows become the real FFmpeg arguments: ask for something out of range and you get a 422, not a silent clamp. You can send your own PromQL through the same MCP server the agents use. The three contracted titles roll their own dates forward as they approach, so the board is never found expired.
How we built it
Google Cloud. Google's Agent Development Kit builds the three-agent sequence, running Gemini 2.5 Flash on Vertex AI. Cloud Run hosts it, Firestore holds state, Secret Manager holds credentials, Cloud Build builds the container from source. The health check performs a real Vertex generation rather than reporting a cached boolean.
Grafana. A dedicated self-hosted Grafana OSS stack with Prometheus, Loki, Tempo, Alloy and the
image renderer. Everything the agents observe, and every change they record, goes through the
official grafana/mcp-grafana server over stdio. That server advertises 72 tools. SLATE calls
seven, each with a stated reason, and publishes the capabilities it declines with why rather
than leaving them quietly absent.
Three of those seven are not the obvious use of an observability server:
| Tool | Why it is unusual |
|---|---|
alerting_manage_rules |
Alert rules are normally written once by a person and left alone. SLATE writes one per delivery at creation, because the thing being watched is a contract, and every contract has a different date |
create_annotation |
The write is not the agent acting. It fires only after a human approves, so the Grafana timeline becomes the record of who decided what, and when |
get_panel_image |
MCP is treated as a text API almost everywhere. Here Grafana renders the same panel a supervisor looks at, MCP carries the image back, and Gemini reads the chart. The picture it was given is shown beside the reading, so you can check one against the other |
Against the eight capabilities the track requirement names, seven are covered. The eighth,
investigating incidents through Grafana IRM, is a Grafana Cloud plugin, and the rules point
unattended deployments at the self-hosted OSS server. update_dashboard is advertised and refused
on purpose, so the operator's view is not something a model can rewrite.
The agents' own token cost, latency and tool calls are recorded as standard OpenTelemetry
gen_ai.* telemetry and read back through that same MCP server. The agents are watched by the
stack they are watching.
Challenges we ran into
Our benchmark was measuring its own setup, and scoring 100%.
An earlier build wrote the injected fault onto the trace and derived the metric label from it, then asked Gemini to "diagnose" it. The agent read the answer key back, and the benchmark scored that round trip perfectly, for weeks. The tell was that the diagnosis never disagreed with anything.
The fix was to separate what configures a run from what observes it. A scenario now only arranges reality: an unreadable file, an encoder this FFmpeg build does not have, a real timeout. The failure class has to be recovered from what FFmpeg actually printed, and guards in the codebase enforce that rather than trusting anyone to remember.
Our own proof fired one second before the deadline.
The blind-spot demonstration opened the gate every time, which is what we had tuned it for, and it opened it about a second before the contractual date. Every threshold was correct and the whole thing was worthless: a warning nobody can act on is not worth firing, and the panel that answers what does this warning buy you could only say nothing recovers this, directly underneath the one case the product exists to show.
Widening the window alone would have traded that for the gate staying shut on a fast machine. Adding renditions instead moves the work side without costing a second of wall clock, because only three are ever encoded. It now fires with real time left, and that time can be spent.
The agents had no logs at all, and it looked fine.
The bound log query returned zero rows on every run, because the log body arrives as JSON nested
inside another field. Nothing errored. Empty results were reported honestly, so nothing looked
broken. Diagnose now quotes FFmpeg's real Unknown encoder line.
The remediation moved a number, not the machine.
The gate divided remaining work by the number of workers, but the encoding pool was pinned at four regardless. Approving "add a worker" changed the projection without changing the clock.
Accomplishments that we're proud of
The impact claim is demonstrated, not projected. Sixteen versions, zero failures, and the gate opened with time still on the clock while a failure alert stayed silent. Measured live, and repeatable in your browser in about thirty seconds.
Nothing consequential is decided by a model. The verdict is a plain function. The failure class is a plain function over what FFmpeg printed. Gemini corroborates and proposes; a person approves.
We went looking for the ways we were fooling ourselves, and published them. The answer-key leak, the dead logs, the cosmetic remediation and the warning that arrived too late to act on were all found by us, and all four are written down in the repository rather than quietly fixed.
What we learned
- A benchmark can measure its own setup. Ours did, at 100%. Separating configuration from observation was the highest-value change in the whole project.
- An early warning is worth exactly what can be done with the time it buys. Firing before the deadline is not the goal. Firing while the remaining time is still enough to change the outcome is the goal, and those are different targets.
- A query returning nothing looks exactly like a query returning nothing interesting. Assert on the shape of the evidence, not just on the absence of errors.
- Watching an agent is not the same as giving it a job. The useful pattern was an agent that reads the same telemetry an operator already trusts, through the partner's own server, and then has to ask permission.
What already exists, and what we do not claim
We went looking for prior art before claiming any, and wrote down what we found in docs/PRIOR-ART.md.
- Pipeline observability with Prometheus and Grafana is the standard media-infrastructure stack. It is commodity, we are not claiming it, and we use exactly it.
- Automated QC and conformance products already exist, including Telestream Vidchecker and Interra BATON. They answer "is this file correct", asset by asset. Neither answers "does the remaining work still fit before the date".
- Predictive pre-miss alerting ships today in logistics and supply-chain platforms. It is the same mechanic in another industry, and we name it rather than presenting it as new.
- Error budgets applied to delivery has published prior art in the SRE writing cited above. Our inversion, keeping the deadline hard and burning schedule instead, is a move, not an invention.
- Media supply-chain orchestrators such as SDVI Rally, Dalet Flex, Vidispine and Ateme were unconfirmed in both directions. We did not establish whether they predict contractual deadline risk, and we do not claim they cannot.
What we do claim is narrow: this pattern applied to a media deliverable pipeline where the failure unit is one encoded version, with the telemetry generated by really doing the work, every consequential decision owned by deterministic code or a person, and the partner's MCP server as the only path the agents have to see or to act.
What's next for SLATE: contractual delivery SLO
Capacity starvation as a real failure class, which needs a worker pool under genuine contention rather than a fabricated label. Enough runs for a defensible p95 per codec and version class. Grafana IRM incidents, which are a Grafana Cloud plugin and so unavailable on the self-hosted server the rules point unattended deployments at.
And the honest gap: review by a streaming or broadcast operations professional. We have not had one, and docs/LIMITATIONS.md says so, next to everything else we have not shown.
Built With
- cloud-run
- fastapi
- ffmpeg
- firestore
- gemini
- google-adk
- google-cloud
- grafana
- grafana-alloy
- grafana-mcp
- loki
- mcp
- opentelemetry
- prometheus
- pydantic
- python
- secret-manager
- tempo
- uvicorn
- vertex-ai

Log in or sign up for Devpost to join the conversation.