-
-
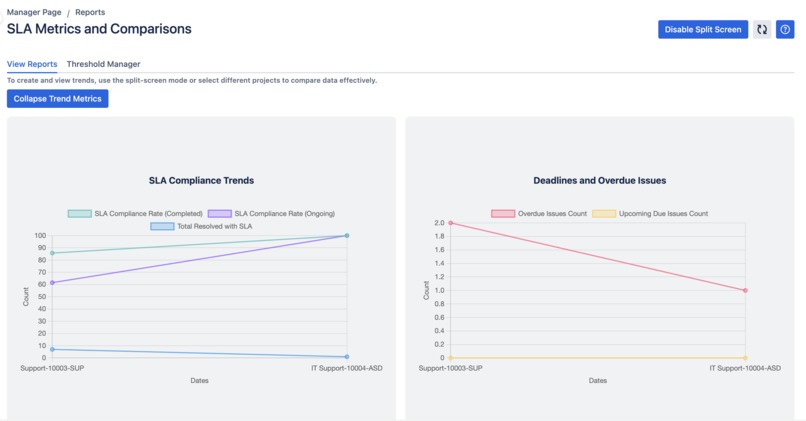
Compare metrics of SLA.

SLA Insights and Bottleneck Analytics for JSM
Inspiration
Managing SLAs effectively in Jira Service Management is critical, but existing tools often lack the depth and flexibility needed for meaningful insights. I was inspired by the growing demand for leaders to understand not just where their SLAs stand today but how they’ve evolved over time and what trends can predict future performance. This inspired me to create a solution that empowers teams to manage their resources effectively, identify bottlenecks, and improve overall service delivery.
What it does
SLA Insights and Bottleneck Analytics for JSM offers a comprehensive suite of tools to analyze, compare, and predict SLA performance. With detailed metrics, interactive charts, and trend analysis, users can:
- Dive into SLA performance for specific projects or across multiple projects.
- Compare metrics over different time periods to identify patterns.
- Predict potential resource allocation needs and pinpoint bottlenecks.
- Make data-driven decisions to improve service efficiency and customer satisfaction.
How I built it
I leveraged Jira’s API alongside modern data visualization libraries to create a seamless and visually engaging experience. Key technologies included:
- Forge Platform: For secure and efficient integration with Jira.
- React: To build an intuitive and responsive user interface.
- Chart.js: For dynamic data visualizations.
- Custom Metrics Algorithms: Designed to calculate SLA trends, bottleneck indicators, and resource optimization metrics.
Every step was focused on creating a balance between powerful insights and ease of use.
Challenges I ran into
- Complex SLA Data Structures: Jira’s SLA data can be challenging to query and structure for deep analytics.
- Performance Optimization: Ensuring the plugin could handle large datasets across multiple projects without compromising speed.
- Data Visualization: Crafting visuals that are both aesthetically pleasing and easy to interpret required multiple iterations.
- Trend Analysis Accuracy: Designing algorithms to compare SLA trends accurately across different time periods was both a technical and logical challenge.
Accomplishments that I'm proud of
- Successfully implemented cross-project SLA trend comparisons, a feature I believe will be a game-changer for service managers.
- Created a user-friendly interface that makes complex analytics accessible to everyone, from team leads to executives.
- Built a robust platform capable of processing high volumes of data while maintaining excellent performance.
What I learned
- The Power of Context: Metrics are only as valuable as the context they’re provided in. I learned to design analytics to answer "why" and "what's next," not just "what."
- Iterative Design Matters: Achieving simplicity in a tool with such depth took time, feedback, and plenty of refinements.
- The Importance of Prediction: Users don’t just want to know where they are—they want to know where they’re heading and how to get there.
What's next for SLA Insights and Bottleneck Analytics for JSM
- Integration with Rovo: A top priority is integrating SLA Insights with Rovo. This will enable seamless collaboration and unlock even more powerful analytics capabilities. While I’m a little disappointed that I didn’t have enough time to achieve this during the initial development phase, I’m excited about the potential it brings to the tool.
While there’s still work to do, the roadmap ahead is filled with exciting opportunities to make SLA Insights and Bottleneck Analytics for JSM even more impactful for teams and leaders.


Log in or sign up for Devpost to join the conversation.