-
-
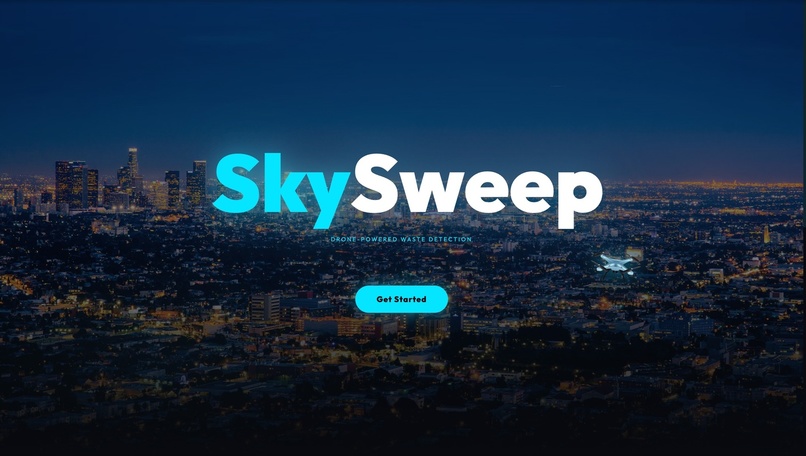
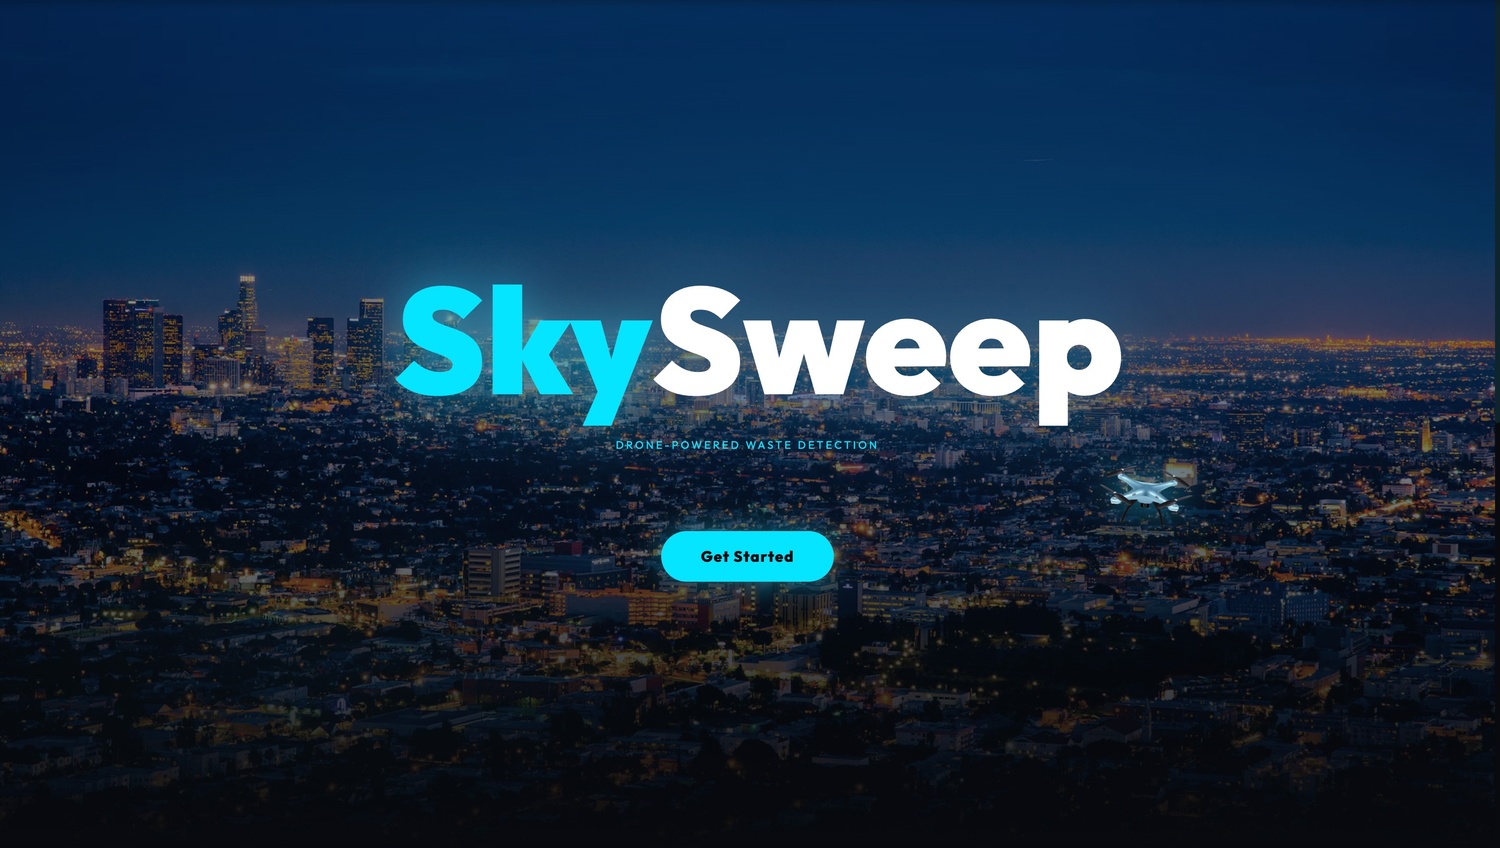
Title Page for SkySweep
-
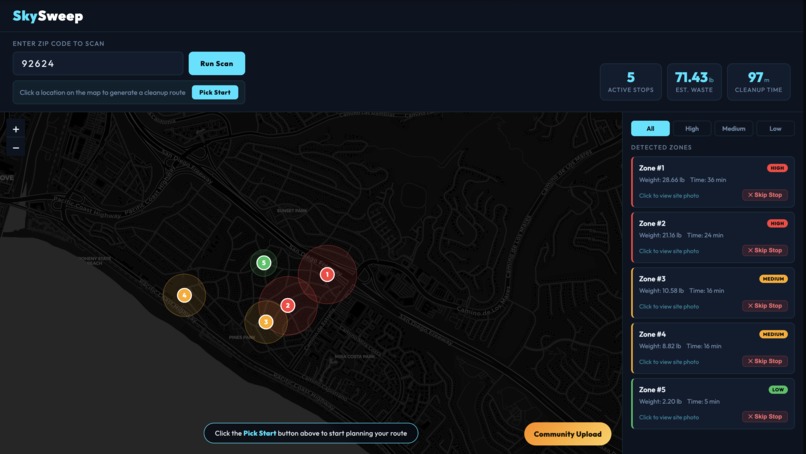
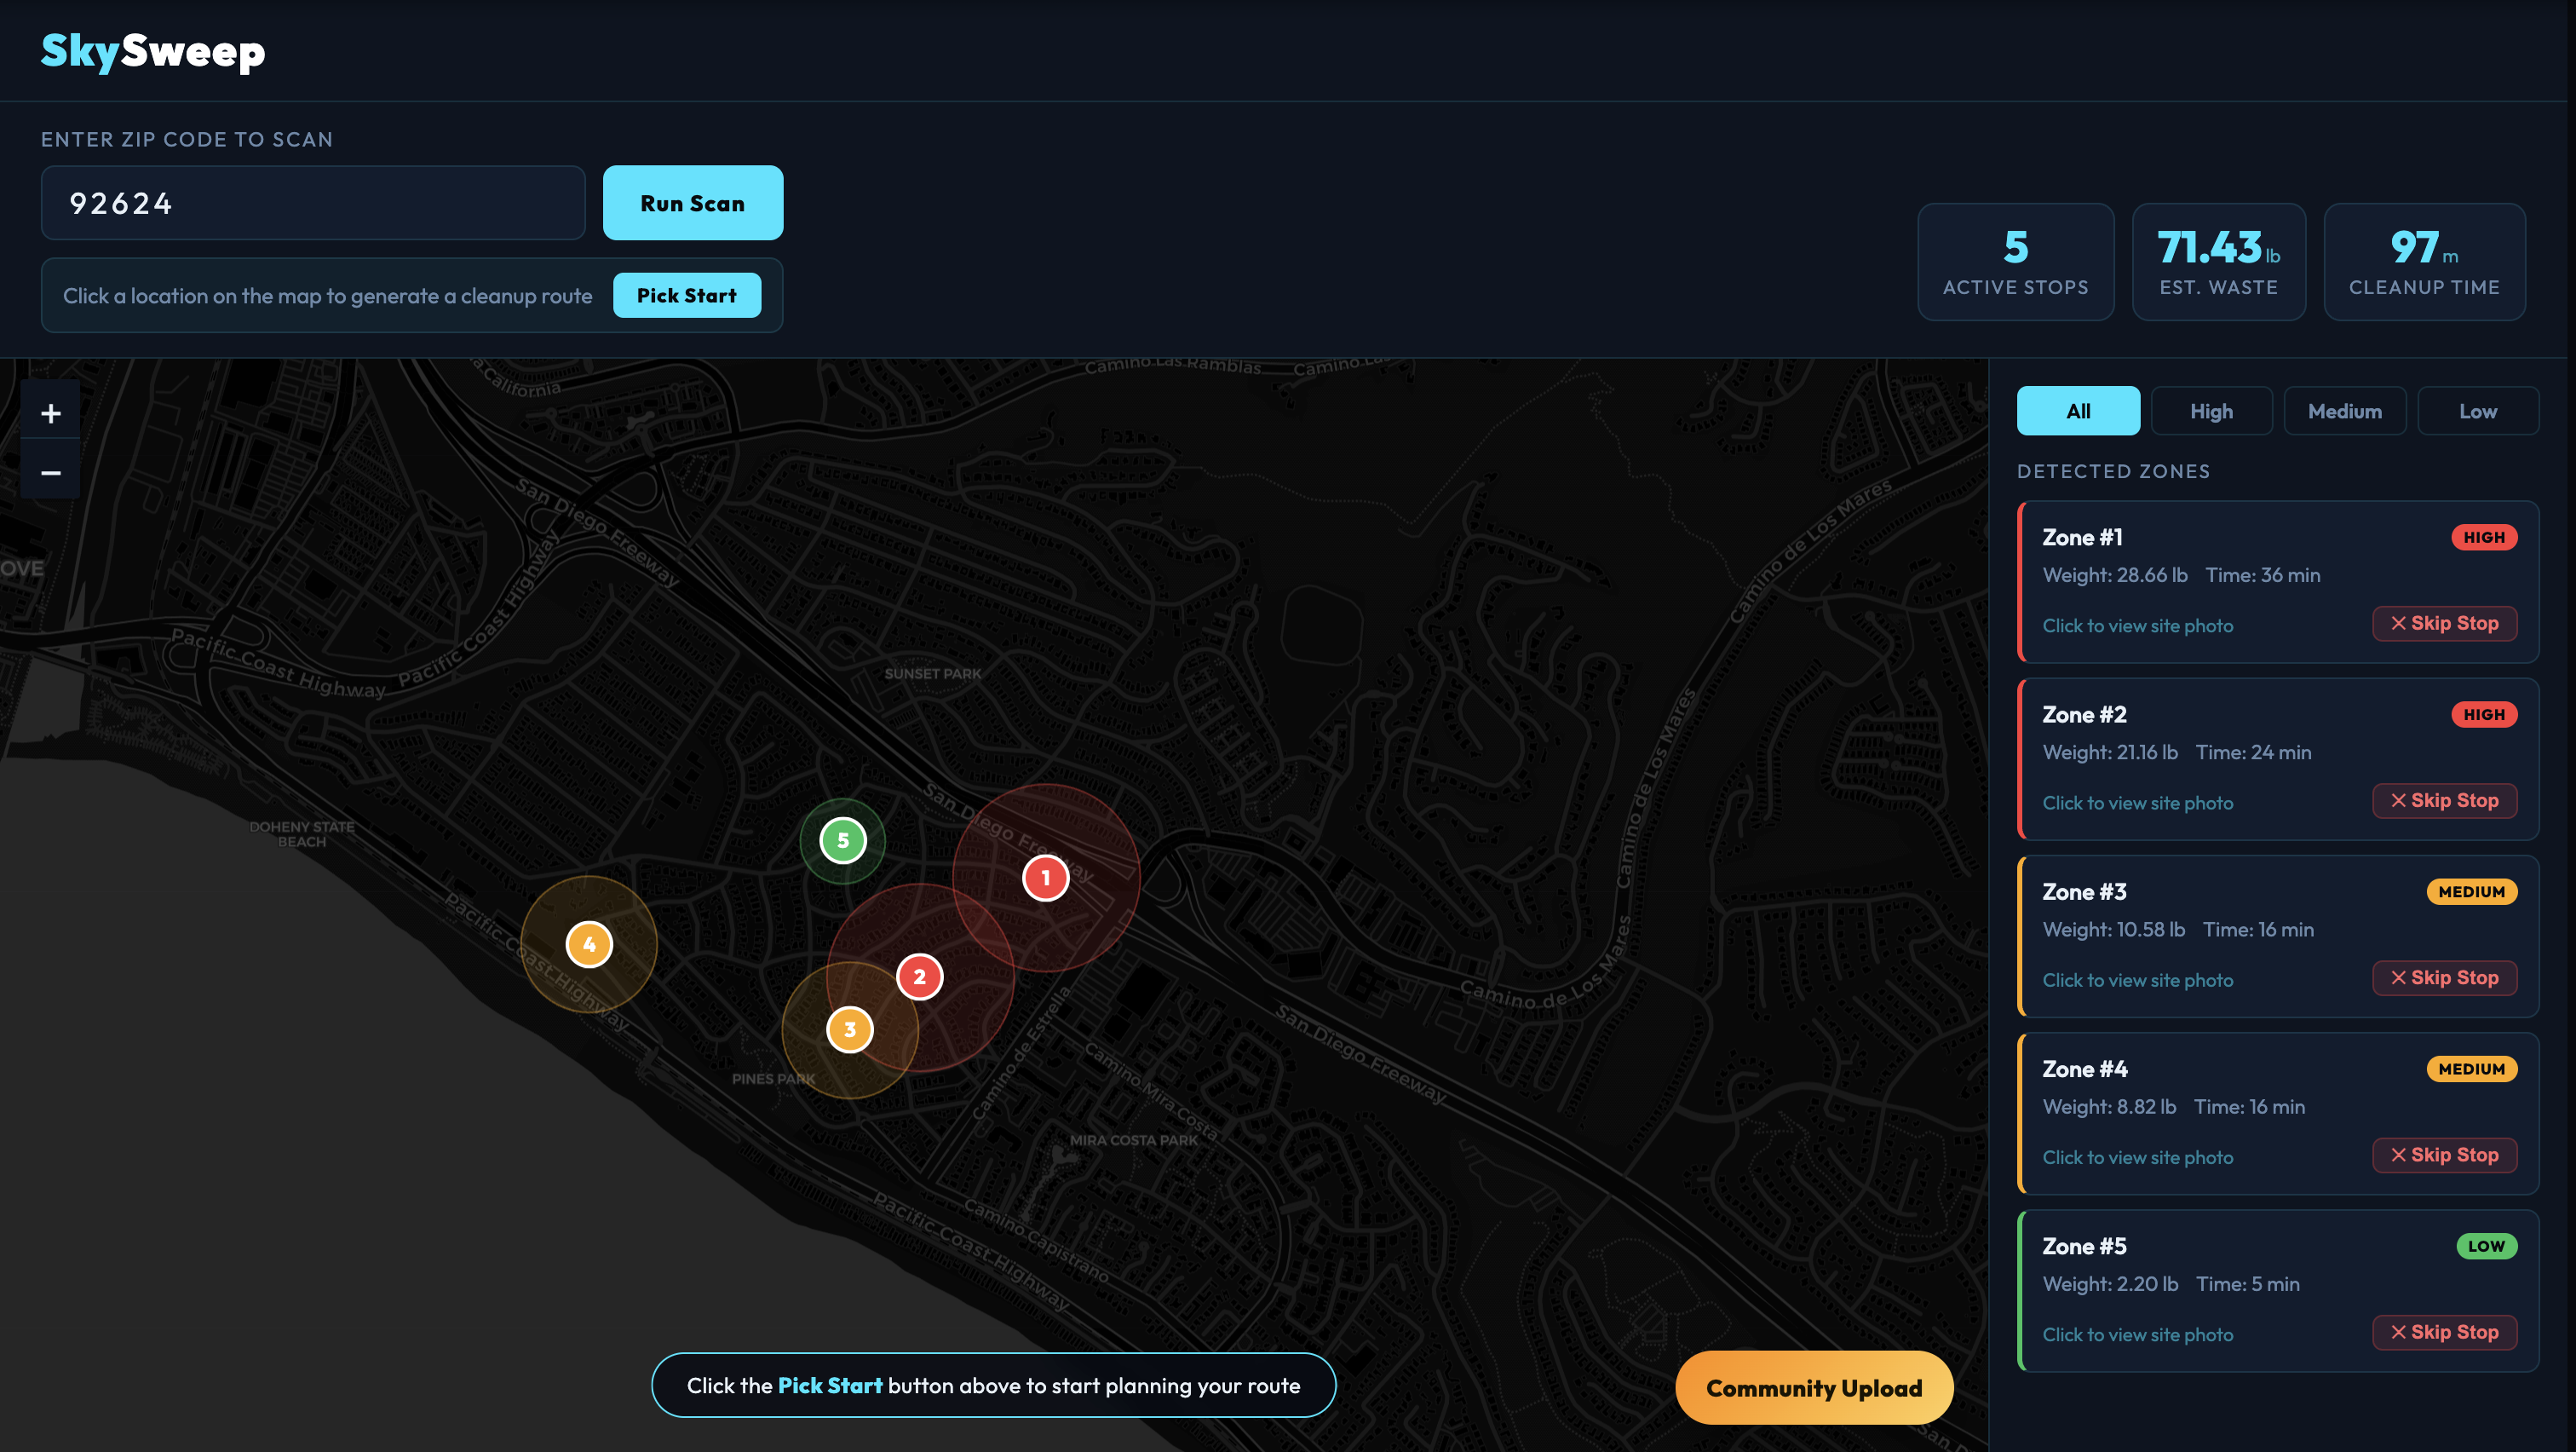
Trash zones detected near area
Inspiration
SkySweep started from a simple problem: trash piles up in neighborhoods every day, but cleanup crews are almost always the last to know. One of our teammates noticed a recurring dumping spot near their neighborhood that never seemed to get addressed, and realized there was no easy way for anyone to systematically find and prioritize these zones. Most cities don't have the tools to survey large areas efficiently. That's where the idea for SkySweep came from, a tool that takes a ZIP code and turns drone footage into an actionable cleanup map, so crews aren't just reacting but actually staying ahead of the problem
What it does
SkySweep simulates a drone scan over Orange County ZIP codes and uses a computer vision model to detect and map trash zones across the area. Enter a ZIP, watch the drone sweep the map, and get back a full breakdown of every detected zone scored as high, medium, or low severity. Hovering over a zone previews the estimated waste weight and cleanup time, and clicking one pulls up a street view photo of the site along with the nearest disposal facilities which link directly to Google Maps.
Zones can be filtered by severity, and from any filter you can drop a starting pin on the map to generate an optimized cleanup route through just those stops. The stats bar tracks total active stops, estimated waste, cleanup time, and route distance, all updating instantly as stops are skipped or filters are switched.
There's also a community side to it. A shareable link generates a QR code anyone can scan to report a trash zone they spotted themselves - uploads are capped at two per person to keep spam out. Each submitted photo gets run through the CV model immediately, and only confirmed detections make it into the database. The next time someone scans that ZIP code, the community-reported zone shows up on the map.
How we built it
Frontend (React + Vite + Leaflet): Interactive map dashboard for browsing trash zones, filtering by severity, generating cleanup routes, and viewing per-zone stats.
Backend (Python + FastAPI + Pydantic): Handles trash zone queries, nearby disposal site lookups, and processing photos submitted through the community upload feature.
CV Model (YOLOv8): Fine-tuned on real-world trash imagery to detect piles, dumped furniture, and debris. Uses the Google Maps Street View API for location previews on each detected zone.
Routing: Built into the React frontend — finds the most efficient cleanup path through every stop and recalculates instantly when filters change or stops are skipped.
Infrastructure: Supabase for the database and photo storage, OpenStreetMap for the map tiles in the UI.
Challenges we ran into
One of the biggest challenges was the dataset. There isn't a popular or well-maintained dataset for detecting trash zones from aerial or street-level views, so a lot of what we found had inconsistent labeling and wildly different lighting conditions. Shadows on pavement can look a lot like debris to a model that hasn't seen enough variation, and getting reliable detections took a lot of iteration.
On the UI side, we went through many rounds where adding a new feature would quietly break something that was already working. A lot of time went into going back, stabilizing things, and making sure everything held together as the project grew.
Accomplishments that we're proud of
We're proud of how many features came together into something that actually feels usable and not just like a demo. The drone simulation, severity filtering, per-filter cleanup routing, community uploads with CV validation, and real-time stats all work end to end. We spent a lot of time making the UI feel like real operational software - the animated drone sweep, the zones appearing on the map one by one, and the glowing route lines all came from wanting it to feel like something you could hand to a volunteer and have them understand immediately. One thing we were especially proud of was the QR code community upload - the fact that anyone nearby can pull out their phone, scan, take a photo, and have it show up in the database for everyone- felt like it crossed from a project into something genuinely interactive.
What we learned
We picked up a lot of new tools along the way. Neither of us had done a full backend integration before, so learning how FastAPI actually works end to end was genuinely cool. We also learned SQL to work with Supabase, and on the frontend, Leaflet was completely new — figuring out how to build an interactive map with custom markers, overlays, and route lines from scratch was one of the more satisfying parts of the build.
Building this as a team of two was also new for both of us at a hackathon. It was a little daunting going in, but we learned how to split work cleanly, trust each other's judgment, and keep moving even when things weren't working. It ended up being one of the better parts of the experience.
What's next for SkySweep
The most natural next step is expanding beyond Orange County - making SkySweep work for any city or region, not just a fixed set of ZIP codes. We'd also love to move from simulation to actual drone integration, where real flight path data drives the scan. A historical tracking layer would let cities see which zones are repeat dumping offenders over time, and a municipality dashboard would give city managers a broader view across entire districts. A mobile app built specifically for city crews, with turn-by-turn directions through the cleanup route and the ability to mark zones complete in real time would make SkySweep something crews could actually use on the ground, not just at a desk.
Google slides
https://docs.google.com/presentation/d/1t6AzNfUExWKdGngGoFFH5dJY09vmDpBsMtoMtxwWSZw/edit?usp=sharing
Built With
- css
- fastapi
- leaflet.js
- python
- react
- s3
- supabase
- vite
- yolov8


Log in or sign up for Devpost to join the conversation.