-
-

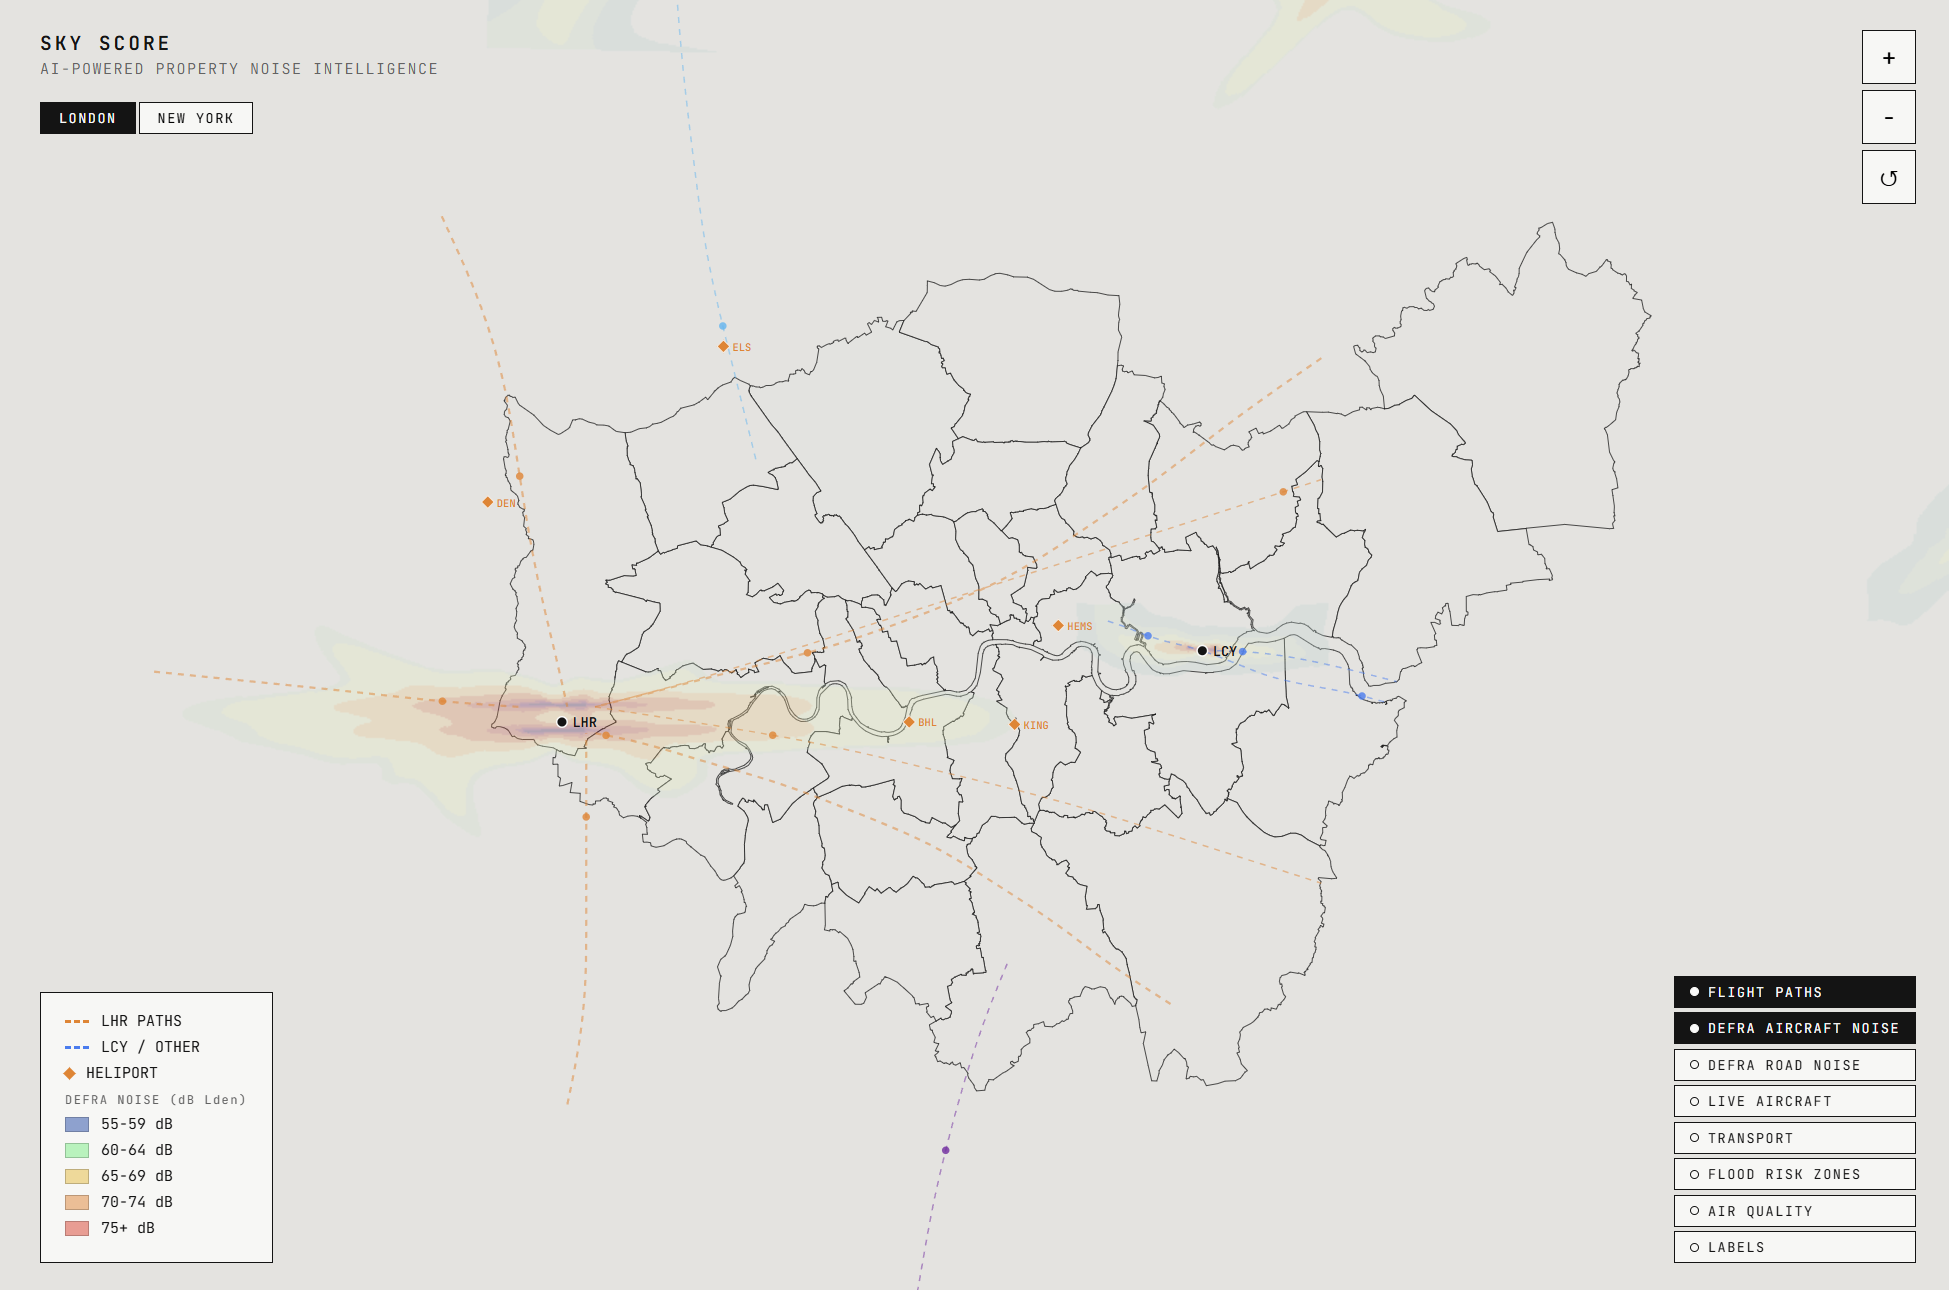
London flight paths and DEFRA noise contours overlaid on an interactive map across 33 boroughs.
-
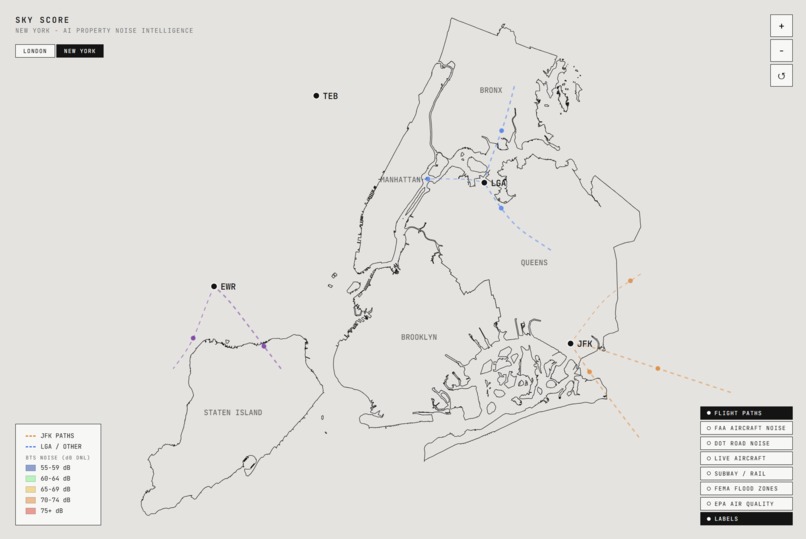
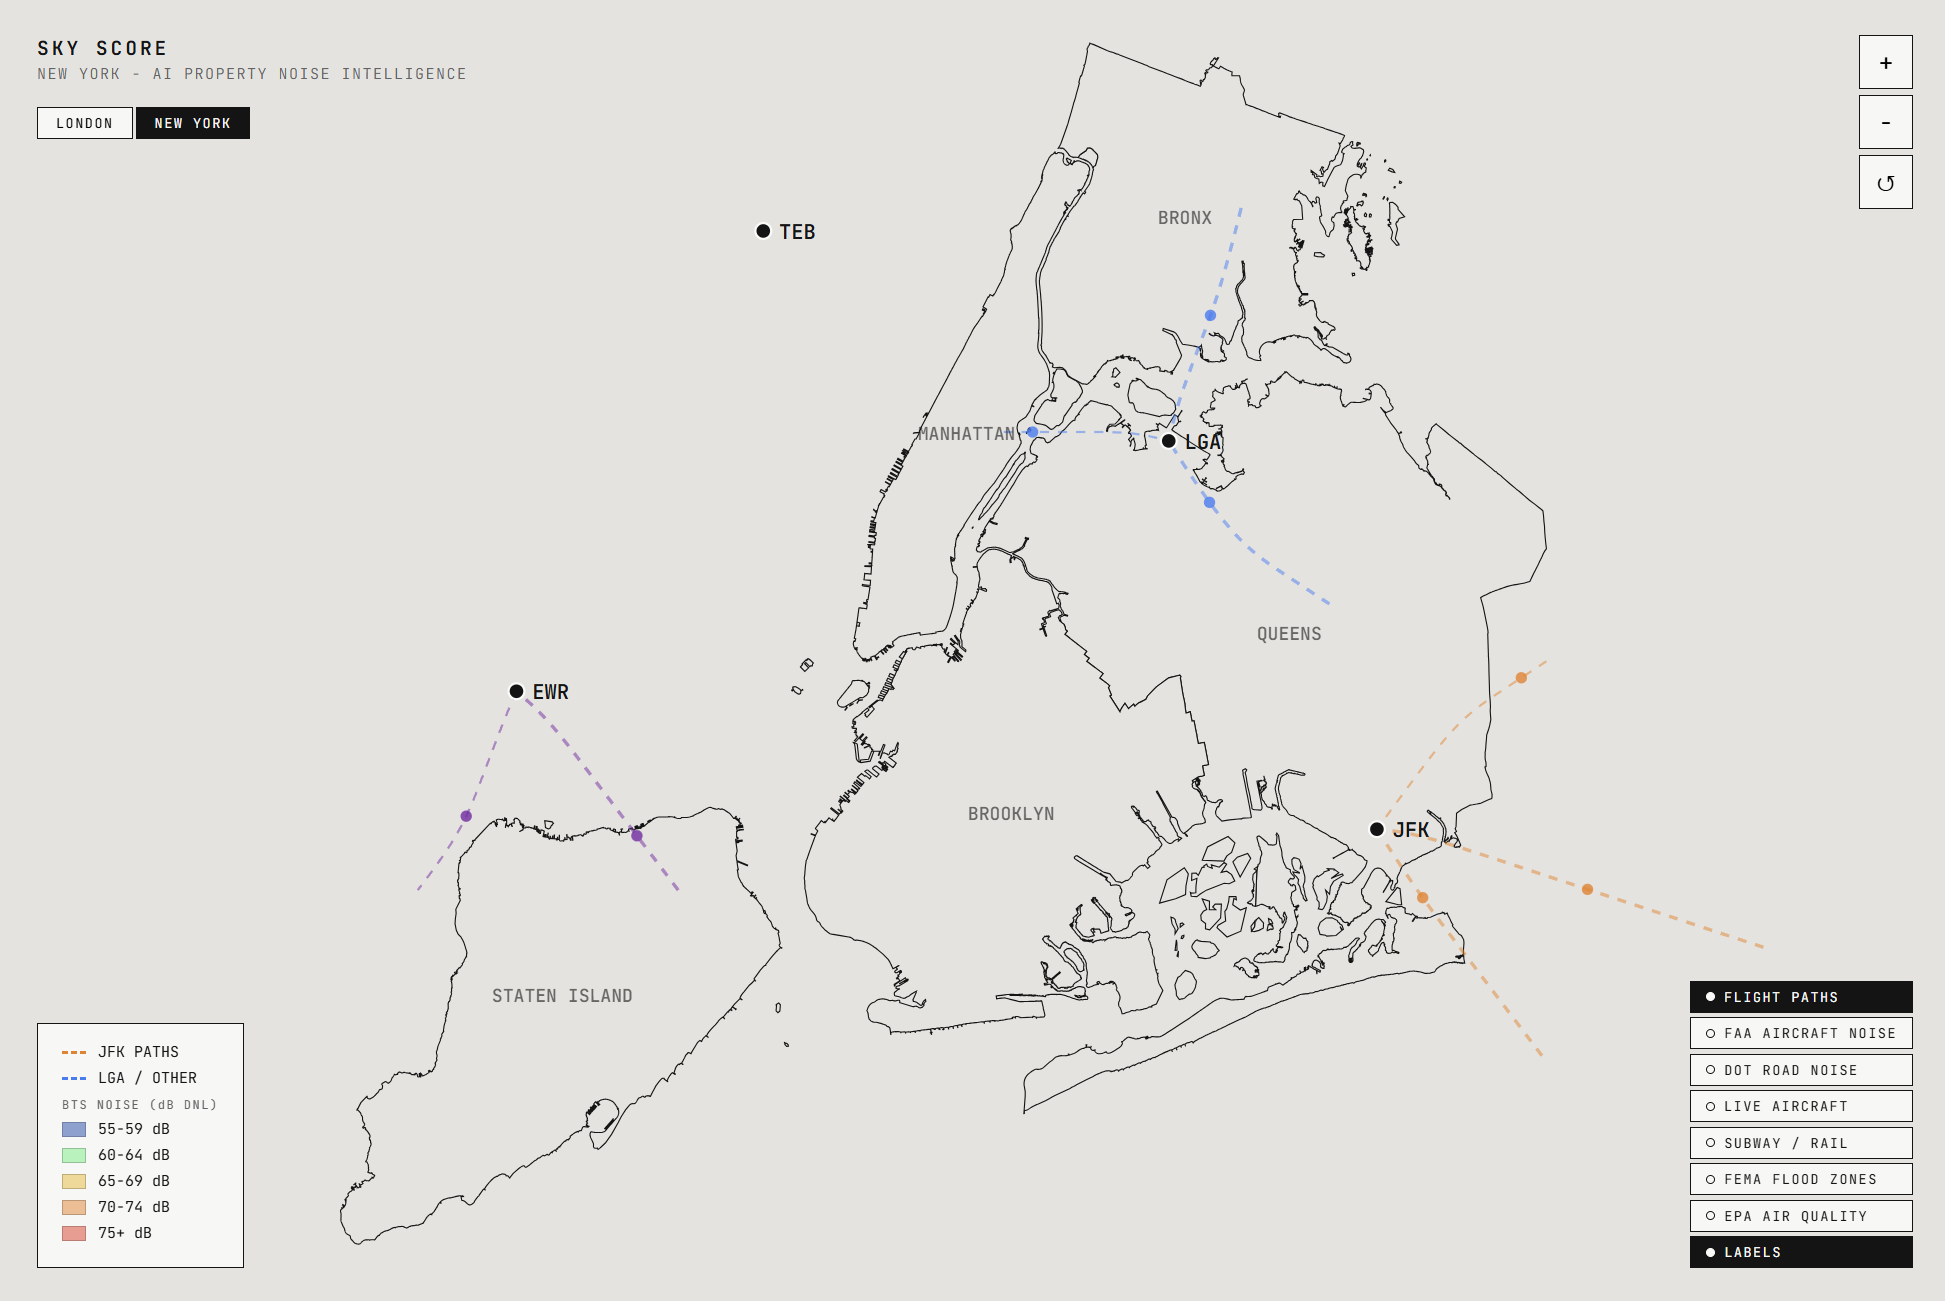
NYC coverage with JFK, LaGuardia and Newark flight paths, FAA noise contours, and air quality data.
-

AI Property Advisor — multi-agent system with 3 specialist agents orchestrated by Amazon Nova.
-
Amazon Nova analyses noise, schools, crime and affordability to generate a Buyer Value Score for any postcode.
-

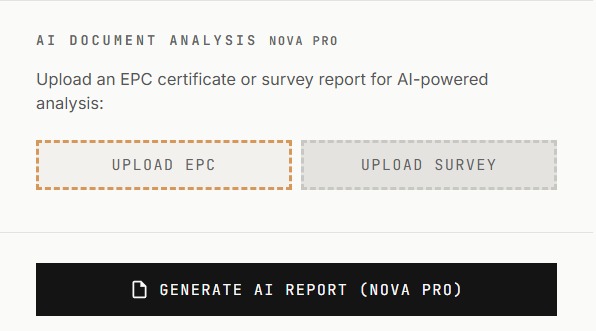
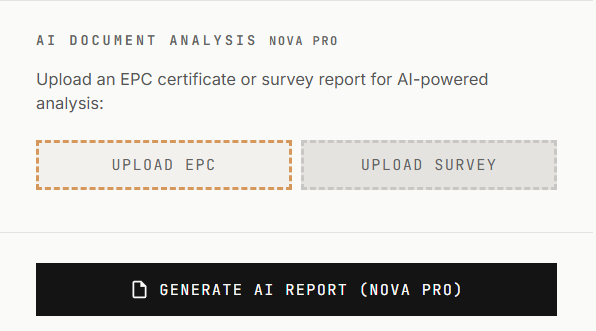
Upload EPC certificates or surveys for Nova Pro multimodal analysis, or generate a full AI property report.


Sky Score - AI-Powered Property Analysis for Aircraft Noise
Multi-city property intelligence combining Amazon Nova Pro multimodal AI, Nova 2 Lite chat, neighbourhood-level scoring across 290+ areas, live government data from 10+ sources, and interactive D3.js mapping - helping buyers avoid hidden aircraft noise before they commit.
Inspiration
I was viewing a property in London when I looked up and realised the house sat directly under a Heathrow arrival path. It seemed like an afterthought when it came to viewings yet it would shape my entire home experience if I ever lived in the property.
That evening I checked Rightmove, Zoopla, and every property platform I could find. None of them showed flight path data, noise contours, or any indication of aircraft noise impact. I searched government websites and found the data existed - buried across DEFRA noise maps, CAA flight path records, and airport authority publications - but it was scattered, technical, and impossible for a normal buyer to use.
Aircraft noise is the single most common complaint from new homeowners in London and New York, and it affects property values by 10-20% in severely impacted areas. Yet buyers only discover the problem after they've moved in, when it's too late to negotiate or walk away.
That was the inspiration to build a single tool that brings together all the noise data, combine it with property intelligence, and then utilising AI to make it instantly understandable for anyone searching for a home.
What it does
Sky Score is a free, AI-powered property analysis tool that combines Amazon Nova 2 Lite and Nova Pro with 10+ live data sources across two cities to give buyers a complete noise and property picture for any location before they commit.
Aircraft noise is the most common complaint from new homeowners, yet no major property platform shows noise data. In London alone, over 300,000 homes are sold each year, with millions more renting across London and New York. Buyers in these two cities live under some of the busiest airspace in the world - Heathrow handles 480,000+ flights per year, JFK and LaGuardia combined exceed 700,000 - and noise impacts property values by 10-20% in affected areas. Sky Score makes this invisible problem visible, for free, before anyone signs a contract.
It covers London (33 boroughs, 5 airports, 5 heliports, ~143 neighbourhoods) and New York City (5 boroughs, 4 airports, ~151 neighbourhoods) - nearly 300 neighbourhoods with individually computed scores.
Search Anything
Users search by postcode/ZIP code, neighbourhood name, borough name, or by clicking the interactive D3.js map. Every search instantly triggers a full analysis: noise assessment, buyer score, crime data, school ratings, transport links, and an AI-generated insight.
Noise Intelligence
For every location: distance to nearest airport and flight path corridor, estimated aircraft altitude overhead, noise classification (Low/Moderate/High), heliport proximity (London), and official government noise contour overlays rendered directly on the map.
AI-Powered Buyer Score (1-10)
Each of 290+ neighbourhoods gets a unique score computed from four factors:
- Quiet Skies - actual geographic distance (Haversine formula) to airports and flight path corridors
- Affordability - neighbourhood-specific median prices (not borough averages): DUMBO at $1.6M vs East New York at $420K, both in Brooklyn
- Growth - annual price trend percentage
- Liveability - composite of schools (35%), crime safety (30%), transport access (25%), and healthcare (10%), with per-neighbourhood crime modifiers and transport proximity bonuses
Five Buyer Personas (Balanced, Family, Investor, First-Time, Quiet Life) dynamically reweight all four factors and instantly re-rank all 290+ neighbourhoods.
Amazon Nova AI - 6 Modes
Nova 2 Lite:
- Multi-turn chat - conversational property advisor with context awareness (knows what postcode you're viewing)
- Auto-insights - instant 2-3 sentence AI summary for every search, no button press needed
Nova Pro:
- Complex reasoning - auto-routes complex queries (comparisons, multi-criteria, budget constraints) to Pro for deeper analysis
- Photo analysis (multimodal) - upload listing photos for property type, condition, glazing type, and noise-relevant concerns
- Document analysis (multimodal) - upload EPC certificates or building survey reports for extraction and interpretation
- Report generation - one-click 7-section Property Intelligence Reports (executive summary, noise, market, amenities, risks, investment outlook, verdict)
The system automatically detects query complexity and routes to the appropriate model - Nova 2 Lite handles ~70% of queries at a fraction of the cost.
Multi-Agent Orchestration
For complex queries (comparisons, multi-criteria recommendations, "best area for..." questions), the system activates a multi-agent pipeline:
- Orchestrator (Nova 2 Lite) - analyses the query, decomposes it into sub-tasks, and determines which specialist agents to invoke
- Noise Analyst Agent (Nova 2 Lite) - assesses aircraft noise, airport proximity, flight path impact, and sound insulation needs
- Property Researcher Agent (Nova 2 Lite) - analyses prices, affordability, growth trends, and investment potential
- Neighbourhood Scorer Agent (Nova 2 Lite) - evaluates schools, crime, transport, healthcare, and overall livability
- Synthesiser (Nova Pro) - combines all agent outputs into a single coherent recommendation with trade-offs
Agents run in parallel using concurrent execution, then Nova Pro synthesises the results. The frontend shows which agents contributed to each response. Simple queries bypass the multi-agent system and go directly to Nova 2 Lite for speed.
Data Layers (Toggle On/Off)
| Layer | London Source | NYC Source |
|---|---|---|
| Flight Paths | Manual path data (8 routes) | Manual path data (8 routes) |
| Aircraft Noise | DEFRA WMS (dB Lden) | BTS/DOT ArcGIS (dB DNL) |
| Road Noise | DEFRA WMS (zoom-triggered) | DOT ArcGIS |
| Transport Stations | 18 major hubs | 16 major hubs |
| Flood Risk | Borough-level EA data + WMS detail | Borough-level FEMA data + ArcGIS REST |
| Air Quality | Borough-level coloring + DEFRA AQMA WMS | Borough-level coloring + EPA Nonattainment ArcGIS REST |
Additional Data Per Location
Crime statistics, school quality ratings, transport connectivity, nearby NHS services (GP surgeries, pharmacies, hospitals), flood risk, air quality, property listing links (Zoopla/Rightmove/OnTheMarket for London; Zillow/StreetEasy/Redfin for NYC), sold prices from HM Land Registry, and EPC data.
How we built it
Frontend
A single HTML file (~3,870 lines) using D3.js v7 for SVG-based interactive mapping - no React, no Leaflet, no Mapbox, no build step. Pure vanilla JavaScript with D3 for maximum control and zero API key dependencies. The map supports zoom, pan, click-to-search, postcode pin rendering, and dynamic data overlays.
Three Overlay Rendering Engines
Government data services use different standards, so three rendering techniques were implemented:
- WMS (Web Map Service) - for DEFRA noise and air quality data, using EPSG:4326 bbox with zoom-aware viewport refresh
- ArcGIS REST export - for EPA air quality, single image per viewport
- Tile grid rendering - for BTS aviation/road noise (tile-only service), computing slippy map tile coordinates and assembling a grid of
<image>elements - Borough-level SVG overlays - flood risk and air quality rendered as colour-coded borough polygons, visible at all zoom levels
Backend - 10 AWS Services, Fully Serverless
| Service | Role |
|---|---|
| Amazon Bedrock | Nova 2 Lite + Nova Pro (chat, multimodal, reasoning, reports) |
| AWS Lambda (x10) | Multi-agent orchestrator, chat, image analysis, document analysis, report generation, favourites CRUD, transport proxy, EPC proxy, sold prices proxy, healthcare data |
| Amazon API Gateway | REST API with CORS |
| Amazon DynamoDB | Favourites storage (device-ID based, PAY_PER_REQUEST) |
| Amazon S3 | Static website hosting |
| Amazon CloudFront | Global CDN with HTTPS |
| AWS CloudFormation/SAM | Infrastructure as code |
| AWS IAM | Least-privilege policies |
| Amazon CloudWatch | Logging and monitoring |
| AWS STS | Cross-region Bedrock access |
Multi-Agent System
Complex queries are handled by a multi-agent orchestration pipeline. The Orchestrator Lambda receives the query, uses Nova 2 Lite to classify intent and decompose it into sub-tasks, then invokes 3 specialist agents (Noise Analyst, Property Researcher, Neighbourhood Scorer) in parallel using Python's concurrent.futures.ThreadPoolExecutor. Each agent runs a Nova 2 Lite call with a domain-specific system prompt. Once all agents complete, Nova Pro synthesises their outputs into a unified recommendation. The frontend detects complex queries client-side and routes them to the /multi-agent endpoint, displaying agent contribution badges on responses.
Neighbourhood Scoring Engine
For each of 290+ neighbourhoods, the engine calculates noise using Haversine distance from actual coordinates to every airport and flight path point, pulls neighbourhood-specific median prices, applies crime modifiers (-2 to +2 relative to borough average), and computes transport proximity to major station hubs. Five buyer personas (Balanced, Family, Investor, First-Time, Quiet Life) dynamically reweight all scores in real-time.
Data Integration
10+ live APIs across both cities: DEFRA Strategic Noise Maps, Met Police, TfL Unified API, EPC Open Data, HM Land Registry, Postcodes.io, Environment Agency, NHS Service Search, BTS/DOT, FEMA NFHL, EPA, NYPD CompStat, and curated school data.
Challenges we ran into
Government data fragmentation. London and New York use completely different data standards. London's DEFRA noise maps use WMS, while NYC's BTS data only serves tiles. FEMA flood data uses ArcGIS REST, and EPA air quality uses yet another ArcGIS format. Each required a different rendering engine, and getting all three to overlay correctly on a D3.js SVG map (not a standard web map library) took significant effort.
Neighbourhood-level scoring at scale. Property platforms give borough-level summaries, but a borough like Brooklyn contains neighbourhoods ranging from $420K (East New York) to $1.6M (DUMBO). Building a scoring engine that computes individual scores for 290+ neighbourhoods using actual geographic coordinates, neighbourhood-specific prices, and per-area crime adjustments was far more complex than borough-level averaging.
Multi-agent orchestration. Designing the orchestrator to reliably decompose natural language queries into the right combination of specialist agents required careful prompt engineering. The orchestrator must return structured JSON specifying which agents to invoke and which areas to analyse. Getting Nova 2 Lite to consistently produce valid JSON (handling edge cases like markdown code blocks in responses) and routing correctly - a noise-only question should invoke one agent, while "compare Hounslow vs Richmond for a family" should invoke all three in parallel - took significant iteration.
Multi-city architecture. Adding New York wasn't just adding data - it meant making every part of the system city-aware: search behaviour, currency symbols, property listing links, map projections, data layer sources, legend labels, noise scoring (different airports, different flight paths), and AI chat context. A single currentCity toggle controls the entire application.
Multimodal document analysis. Getting Nova Pro to reliably extract structured data from EPC certificates and building survey reports required iterating on prompts to handle the variety of document formats, layouts, and terminology differences between energy assessors and chartered surveyors.
Accomplishments that we're proud of
290+ individually scored neighbourhoods. Not borough averages - each neighbourhood has its own score computed from actual geographic distance to airports and flight paths, neighbourhood-specific property prices, local crime adjustment, and transport proximity. Astoria (0.5km from LaGuardia) scores very differently from Bayside (12km away), even though both are in Queens.
Multi-agent orchestration with parallel execution. Complex queries activate a genuine multi-agent pipeline: an orchestrator decomposes the query, 3 specialist agents (Noise Analyst, Property Researcher, Neighbourhood Scorer) run in parallel via concurrent threads, and Nova Pro synthesises their outputs. This isn't a chatbot wrapper - it's a coordinated AI system where specialist agents collaborate to produce richer analysis than any single model call could achieve.
Three rendering engines for government data. WMS, ArcGIS REST export, and tile grid assembly all working together on a single D3.js SVG map. No other property tool combines this many government data formats in one view.
Multi-city in one codebase. London and New York - two of the world's busiest aviation markets with completely different data standards - running from one single-page application with instant city switching. This proves the concept scales globally.
Five buyer personas that reweight 290+ scores in real-time. No other property tool lets users switch perspective and instantly see how every neighbourhood re-ranks. A family prioritises schools and safety; an investor prioritises growth; a noise-sensitive buyer prioritises quiet skies. The same data, five completely different rankings - computed client-side with zero latency.
Auto-insights on every search. Every postcode or neighbourhood search automatically triggers a Nova 2 Lite AI summary - no button press, no chat interaction needed. This means every single user gets AI-powered analysis, not just those who open the chatbot. It is the deepest possible integration: AI is woven into the core search experience, not bolted on as a sidebar.
Production-ready and free. Deployed live on CloudFront, no sign-up, no paywall. Anyone can use it right now to check any location in London or New York before committing to a property. This is not a prototype - it is a working tool solving a real problem for real buyers today.
Addressing a genuine market gap. Rightmove, Zoopla, Zillow, and StreetEasy collectively serve hundreds of millions of property searches per year. None of them show aircraft noise data, flight paths, or noise contours. Sky Score is the only free tool that combines noise intelligence with property data and AI analysis across two of the world's busiest aviation markets. The community impact is direct: buyers who would otherwise discover noise problems after signing a contract can now check any location in seconds.
~3,870 lines, zero frameworks. The entire frontend is vanilla HTML/CSS/JS with D3.js - no React, no build pipeline, no node_modules. It loads fast and has zero dependency risk. Building interactive maps with D3 instead of Leaflet or Mapbox required writing custom projection logic, zoom behaviour, and overlay positioning from scratch - but it also meant zero API key dependencies and the ability to overlay WMS, ArcGIS REST, and tile-based government data in ways that standard map libraries do not support.
What we learned
Multi-agent systems produce better results than single-model calls. When a user asks "Compare Hounslow vs Richmond for a family with a 600K budget", a single Nova Pro call gives a decent answer. But splitting the query across specialist agents (noise, market, livability) running in parallel, then synthesising with Pro, produces a more structured and thorough analysis. Each agent focuses deeply on its domain without context window competition. Nova 2 Lite handles the agent calls cheaply, and Pro only fires once for synthesis.
Government data is powerful but fragmented. The data buyers need already exists across DEFRA, BTS, FEMA, EPA, Environment Agency, and more. The challenge is that each agency publishes in a different format (WMS, ArcGIS REST, tiles, JSON APIs). Bridging these standards into a unified view is where the real value lies.
Borough-level data hides critical differences. A "safe borough" might have neighbourhoods with very different crime profiles. An "expensive borough" might contain both luxury and affordable areas. Neighbourhood-level granularity completely changes the analysis and makes the tool genuinely useful for buyers making specific location decisions.
D3.js is powerful but demanding. Building interactive maps with D3 instead of Leaflet or Mapbox meant writing custom projection logic, zoom behaviour, click handling, and overlay positioning from scratch. But it also meant zero API key dependencies, full control over rendering, and the ability to overlay WMS/ArcGIS/tile data in ways that standard map libraries don't easily support.
Multimodal AI has immediate practical value. Buyers already take photos of properties and receive EPC certificates. Letting them upload these directly for AI analysis - glazing type assessment for noise, energy efficiency interpretation, survey defect extraction - creates value that text-only AI cannot.
Free tools create the most impact. The decision to make Sky Score completely free, with no sign-up, no paywall, and no API keys, means the people who need it most - first-time buyers stretched on budget, renters with no negotiating power - can access the same intelligence that a paid consultant would provide. Removing every barrier to access maximises the community benefit.
What's next for Sky Score
More cities. The architecture already supports two cities with different data standards. Sydney, Tokyo, Paris - any city with airports and property data can be added. The scoring engine, persona system, and AI integration are city-agnostic.
Real-time flight tracking. Integrate live ADS-B flight data to show actual aircraft positions over the map in real-time, giving buyers a live view of how busy the skies really are above their prospective home.
Noise measurement crowdsourcing. Let users record actual noise levels from their phone microphone at specific locations, building a community-sourced noise database that supplements official government contour data.
Mobile app. A native mobile experience would let buyers check noise levels on-site during property viewings, with GPS-based instant analysis.
Estate agent partnerships. Provide an embeddable widget that estate agents can add to property listings, showing the Sky Score and noise assessment directly on Rightmove, Zoopla, or Zillow listings.
Historical flight path changes. Track how flight paths have changed over time and predict future changes based on airport expansion plans (e.g., Heathrow third runway proposals, LaGuardia redesign), helping buyers assess long-term noise trajectory.
Built With
- Amazon Bedrock (Nova 2 Lite + Nova Pro)
- Amazon CloudFront
- Amazon S3
- Amazon DynamoDB
- AWS Lambda (x10, Python 3.11)
- Amazon API Gateway
- AWS SAM / CloudFormation
- AWS IAM
- Amazon CloudWatch
- AWS STS
- D3.js v7
- JavaScript (vanilla)
- HTML / CSS
Links
- Live Demo: https://d1oe4ftwutjpf.cloudfront.net
- Code Repository: https://github.com/billkhiz-bit/london-flight-path-map
Category
Freestyle
Hashtags
AmazonNova #AWS #PropertyTech #London #NewYork #AI #Multimodal #Bedrock #Serverless
Built With
- amazon-api-gateway
- amazon-bedrock
- amazon-cloudfront
- amazon-dynamodb
- amazon-nova
- amazon-web-services
- aws-cloudformation
- aws-lambda
- aws-sam
- css
- d3.js
- html
- javascript
- python

Log in or sign up for Devpost to join the conversation.