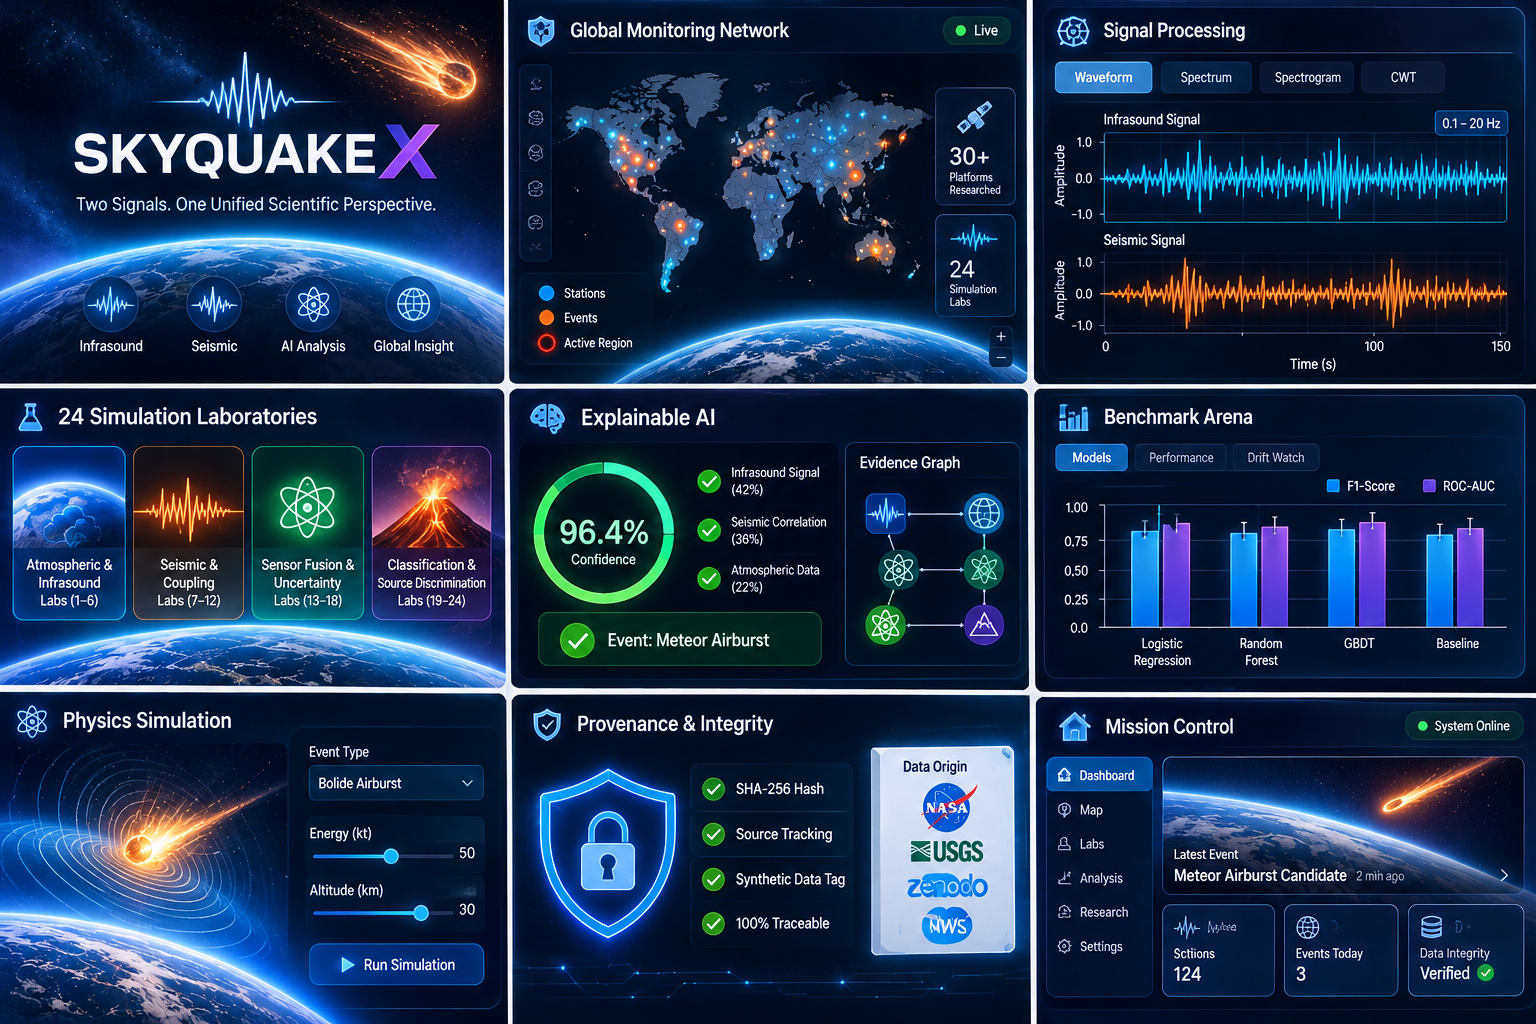
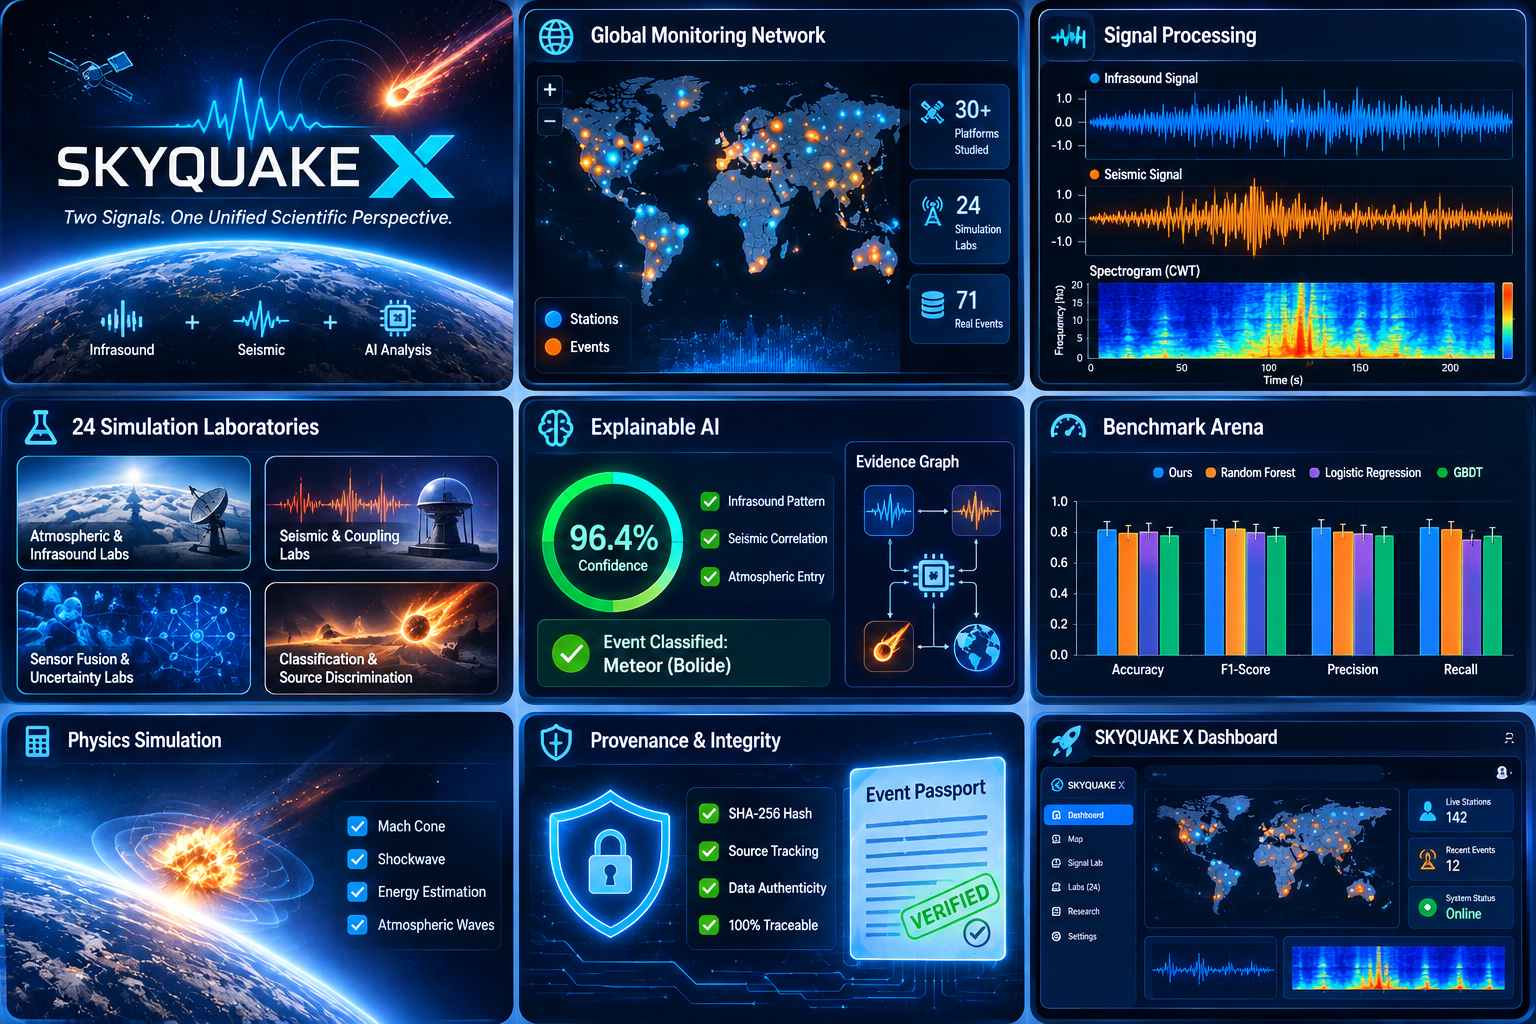
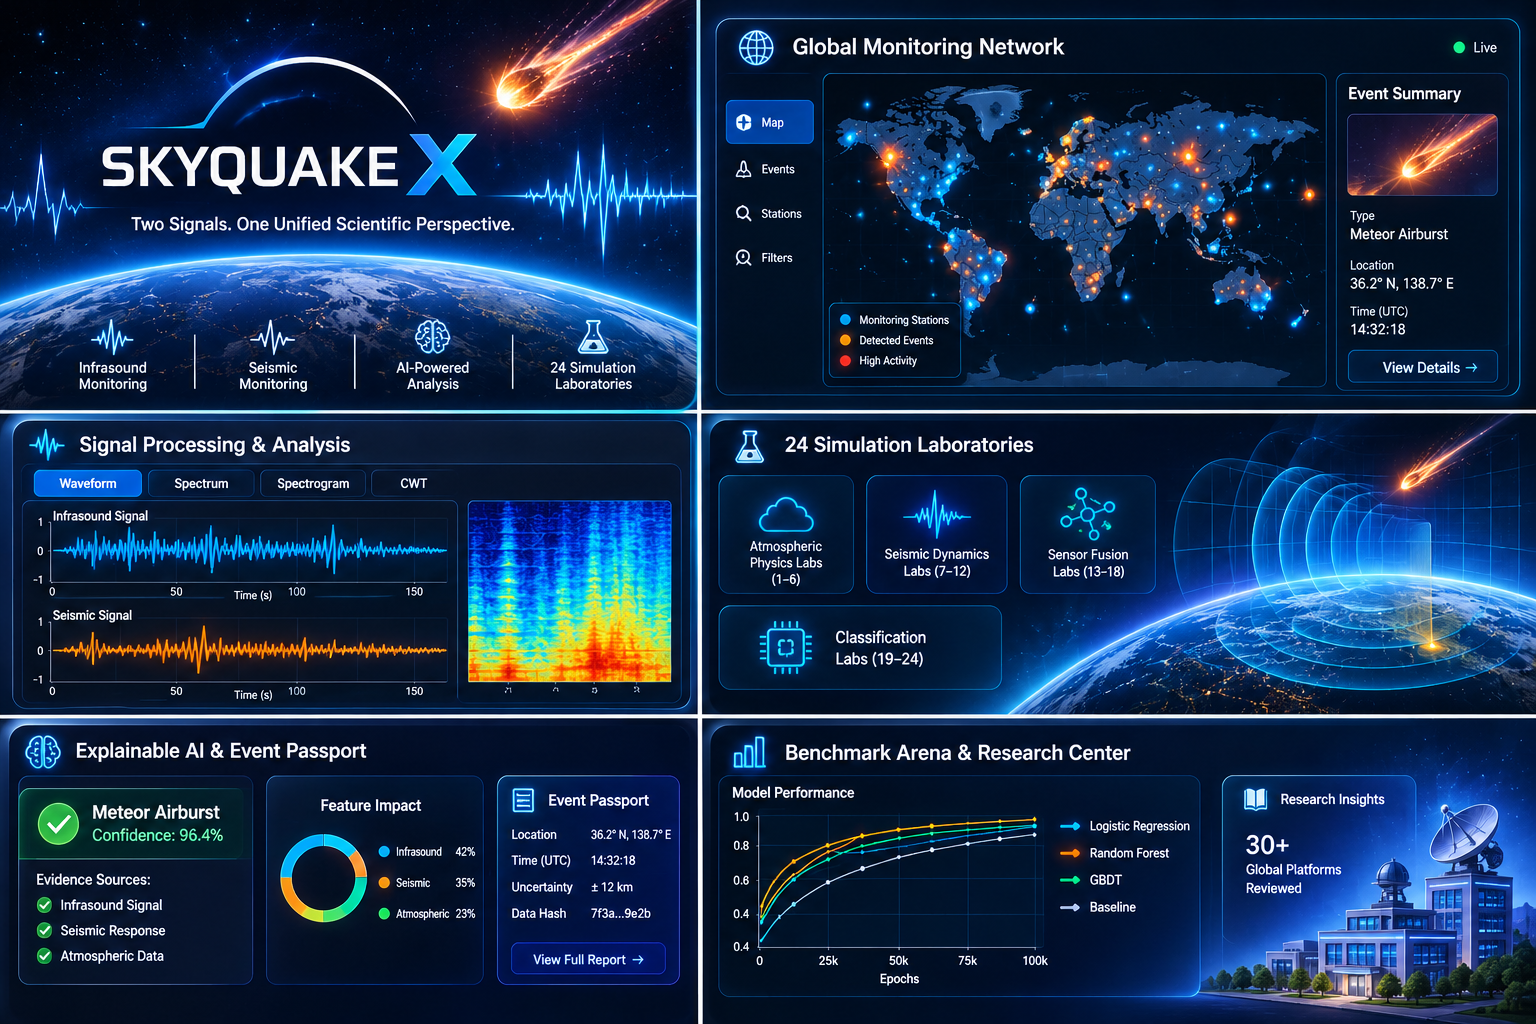
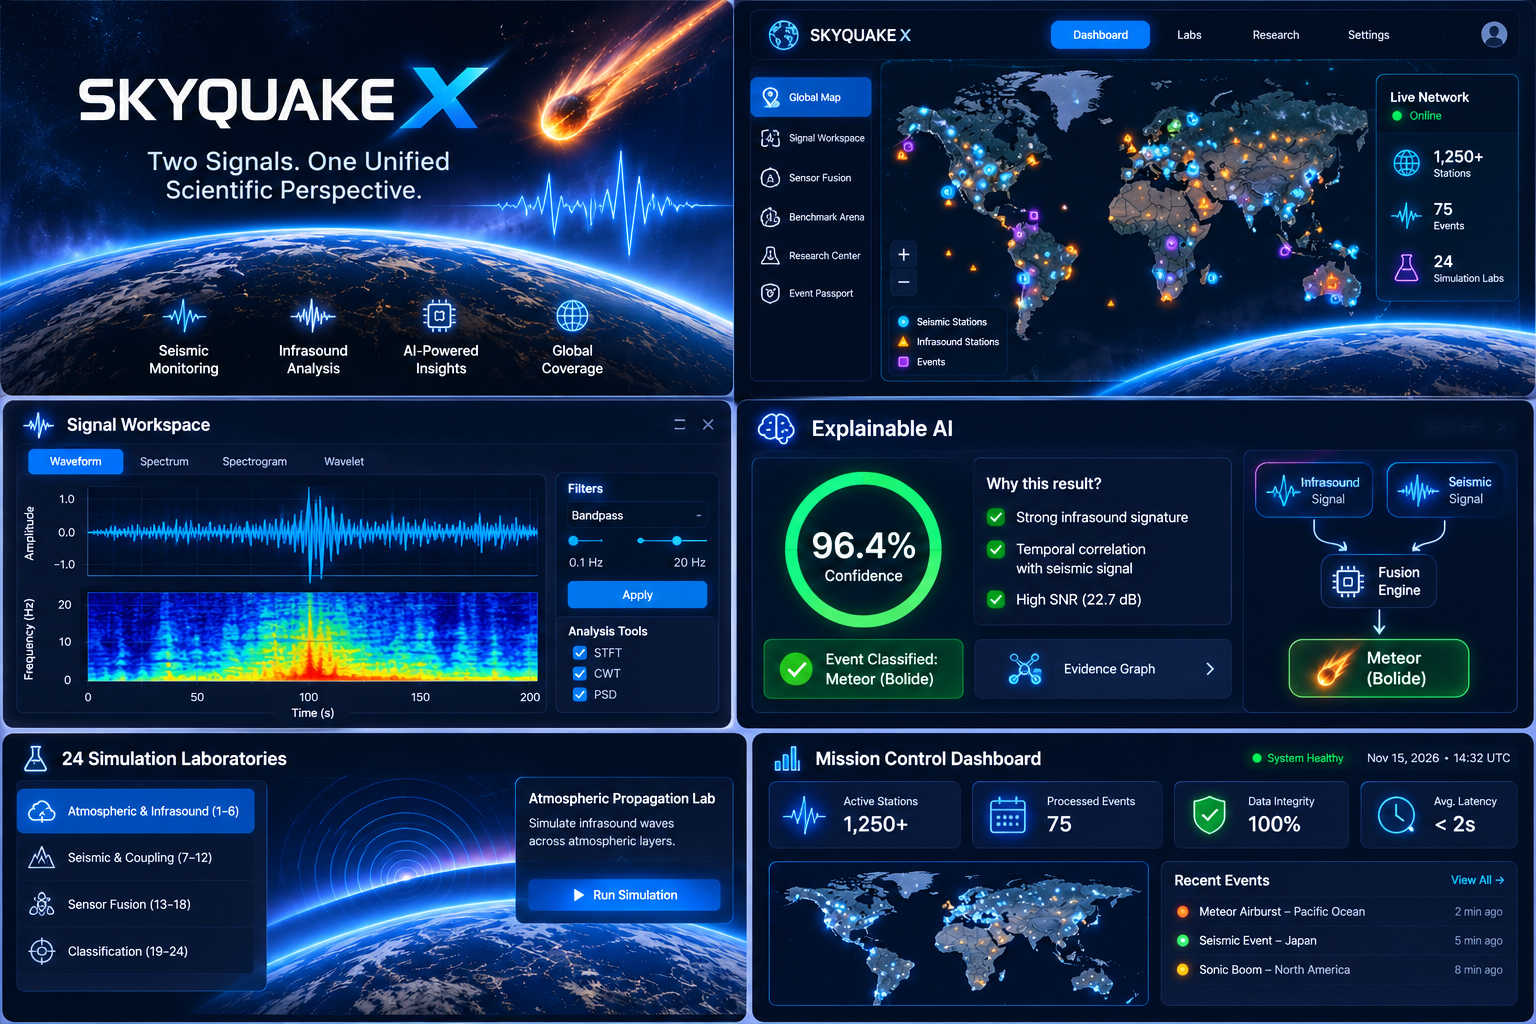
SKYQUAKE X
Two Signals. One Unified Scientific Perspective.
1. The Inspiration — Where Everything Started
What if the atmosphere and the ground could tell us the story of the same extraordinary event?
The inspiration behind SKYQUAKE X came from the achievements of a talented Egyptian young researcher who demonstrated how meteor-related events could be investigated through seismic waves and scientific data analysis rather than relying exclusively on optical telescopes.
This sparked a question that became the foundation of our project:
Could we combine atmospheric infrasound and ground-based seismic observations to investigate mysterious explosive and vibrational events more effectively?
We realized that earthquakes, meteor airbursts, sonic booms, volcanic explosions, and other atmospheric or geophysical phenomena can produce different physical signatures. However, understanding these events requires more than examining one type of signal independently.
That is how SKYQUAKE X was born.
We set out to build an integrated scientific platform that connects atmospheric acoustics, seismology, signal processing, artificial intelligence, and physical simulation in one environment.
Our ambition was not simply to create another monitoring dashboard. We wanted to build a research environment capable of connecting multiple forms of physical evidence and making their relationships easier to investigate.
2. The Problem — When the Sky and the Ground Tell Different Stories
Some powerful events produce signals that are difficult to interpret when observed independently.
For example:
- Meteor Airbursts: Incoming meteoroids can generate atmospheric shock waves that propagate over large distances and may produce detectable infrasound and ground-coupled signals.
- Earthquakes: Seismic waves travel through the Earth and produce characteristic patterns that can help researchers investigate their origin and properties.
- Sonic Booms: Supersonic aircraft can generate atmospheric pressure disturbances that may be confused with other explosive events.
- Volcanic and Industrial Explosions: These can produce acoustic and seismic signatures that require careful source discrimination.
The problem is not simply detecting a signal. It is understanding what generated it.
Traditional scientific resources provide valuable specialized observations, but researchers may need to navigate multiple systems, datasets, and analytical workflows to investigate relationships between different physical signals.
SKYQUAKE X addresses this challenge by bringing complementary observations into one analytical environment.
3. Research Foundation — Learning from 30+ Global Platforms
Before building our solution, we conducted a comparative study of more than 30 international scientific platforms, monitoring systems, research resources, and data sources.
Our research included:
- NASA CNEOS: Near-Earth object and meteor-related information.
- USGS: Earthquake monitoring and seismic information.
- Zenodo: Scientific datasets and research publications.
- NWS: Weather and atmospheric information.
We examined their data sources, monitoring capabilities, visualization methods, analytical approaches, and limitations.
This research helped us identify an important opportunity: combining complementary scientific observations into a unified workflow instead of treating every monitoring domain as an isolated source of information.
We used the findings to guide our architecture and development priorities.
Our objective was not to replace established organizations such as NASA or USGS. It was to build a complementary analytical environment that connects different types of scientific evidence.
4. Our Solution — How SKYQUAKE X Works
SKYQUAKE X combines two fundamental monitoring domains.
A. Infrasound Monitoring
Infrasound consists of acoustic waves below 20 Hz, generally outside the range of human hearing.
The platform investigates atmospheric pressure signals and their characteristics, including potential signatures associated with meteor airbursts and other powerful atmospheric events.
B. Seismic Monitoring
The seismic component investigates ground vibrations and wave patterns recorded by seismometers.
These observations provide information about ground motion and can help researchers investigate earthquakes and atmospheric-to-ground coupling phenomena.
C. Multi-Modal Sensor Fusion
This is the central innovation of SKYQUAKE X.
Rather than analyzing atmospheric and seismic observations separately, our approach brings them into a shared analytical framework.
The platform is designed to support:
- Multi-source data integration.
- Time synchronization between observations.
- Comparative waveform analysis.
- Signal-quality assessment.
- Event characterization.
- Uncertainty estimation.
- Evidence-based event classification.
By investigating complementary signals together, the system can explore relationships that may not be apparent from individual observations.
D. Explainable AI
We wanted our analytical results to be more than unexplained predictions.
SKYQUAKE X incorporates explainability-oriented workflows that aim to show:
- Which observations contributed to a classification.
- How signal quality influenced the analysis.
- Which features affected a model's decision.
- How uncertainty changes when an observation is excluded.
- What alternative outcomes could result from different analytical assumptions.
This makes the system more transparent and useful for scientific investigation.
5. The Scientific Engine — Turning Raw Signals into Evidence
Real-world signals contain noise, baseline drift, environmental interference, and complex frequency patterns.
SKYQUAKE X incorporates a digital signal processing workflow designed to transform raw observations into analyzable representations.
1. Demeaning and Detrending
We remove the signal mean and estimate unwanted trends before performing subsequent analysis.
For a signal (x[n]), its mean is:
[ \bar{x}=\frac{1}{N}\sum_{n=0}^{N-1}x[n] ]
The centered signal becomes:
[ x_c[n]=x[n]-\bar{x} ]
2. Butterworth Bandpass Filtering
We use frequency filtering to investigate relevant signal ranges while reducing unwanted frequency components.
For an illustrative infrasonic analysis range:
[ 0.1 \leq f \leq 20\text{ Hz} ]
The appropriate frequency range depends on the sensor, sampling rate, and scientific objective.
3. FFT and Power Spectral Density
The Fast Fourier Transform helps transform observations from the time domain into the frequency domain.
[ X[k]=\sum_{n=0}^{N-1}x[n]e^{-j2\pi kn/N} ]
We also use Power Spectral Density analysis to investigate how signal power is distributed across frequencies.
4. STFT and Continuous Wavelet Transform
Some physical signals change their frequency characteristics over time.
We investigate these patterns using time-frequency analysis, including the Short-Time Fourier Transform and Continuous Wavelet Transform.
This helps visualize transient events and changing frequency characteristics.
5. Signal-to-Noise Ratio
We use SNR as one indicator of signal quality:
[ SNR_{dB}=10\log_{10} \left(\frac{P_{signal}}{P_{noise}}\right) ]
Signal-quality information can contribute to station weighting and uncertainty assessment during multi-sensor analysis.
Together, these methods provide the scientific foundation for investigating complex observations rather than relying exclusively on raw waveforms.
6. The 24 Simulation Laboratories
One of the most distinctive components of SKYQUAKE X is its collection of 24 interactive simulation laboratories, organized into four scientific categories.
Each category contains six laboratories.
Category I — Atmospheric and Infrasound Physics (Labs 1–6)
These laboratories investigate the physical behavior of acoustic waves in the atmosphere.
- Stratified Atmosphere Propagation: Investigates how temperature and atmospheric wind affect acoustic propagation.
- Acoustic Ducting and Shadow Zones: Explores atmospheric waveguides and regions where acoustic signals may become weak or undetectable.
- Mach Cone and Hypersonic Entry: Investigates shock-wave geometry associated with supersonic atmospheric motion.
- Atmospheric Attenuation and Absorption: Studies how acoustic energy decreases during propagation.
- Jet Stream and Wind Shear Refraction: Investigates how atmospheric wind profiles influence propagation paths.
- Bolide Yield Estimation: Explores empirical relationships between atmospheric signatures and estimated event energy.
Category II — Seismic Dynamics and Earth-Atmosphere Coupling (Labs 7–12)
These laboratories investigate ground vibrations and interactions between atmospheric pressure waves and the Earth's surface.
- Acoustic-to-Seismic Coupling: Investigates how atmospheric pressure disturbances can generate ground-coupled signals.
- P-Wave and S-Wave Separation: Explores seismic phases and their travel-time characteristics.
- Surface Wave Dispersion: Studies frequency-dependent surface-wave propagation.
- Ambient Seismic Noise Model: Investigates background seismic noise and its effect on detection.
- Seismometer Instrument Response: Explores how seismic instruments respond to different signal frequencies.
- Seismo-Acoustic Triangulation: Investigates event localization using arrival-time differences.
Category III — Sensor Fusion and Uncertainty (Labs 13–18)
These laboratories focus on the reliability of multi-sensor analysis.
- Bayesian Multi-Sensor Fusion: Combines evidence from multiple observation sources.
- Leave-One-Out Ablation: Investigates how removing individual station observations affects analytical results.
- Spatial Error Ellipse: Visualizes uncertainty in estimated event locations.
- Clock Drift and Latency Compensation: Investigates timing differences between monitoring stations.
- Counterfactual Threshold Analysis: Explores how changes in analytical thresholds affect event classification.
- Sparse Network Resilience: Investigates performance when monitoring coverage is limited.
Category IV — Classification and Source Discrimination (Labs 19–24)
These laboratories investigate the differences between various atmospheric and geophysical event signatures.
- Bolide Airburst Signature: Investigates characteristic atmospheric signal patterns associated with meteor airbursts.
- Supersonic Aircraft Sonic Boom: Explores the acoustic characteristics of sonic booms.
- Tectonic Earthquake Discrimination: Investigates seismic characteristics associated with tectonic events.
- Volcanic Explosion and Plume: Explores infrasonic signals associated with volcanic activity.
- Quarry Blast and Industrial Explosion: Investigates patterns associated with industrial and mining explosions.
- Severe Weather and Lightning Infrasound: Explores atmospheric signals associated with thunderstorms and severe weather.
These laboratories are intended to provide controlled environments for testing physical assumptions, exploring different conditions, and investigating how analytical methods respond to changing parameters.
7. Platform Architecture — Beyond a Monitoring Dashboard
SKYQUAKE X includes several interconnected analytical modules.
Mission Control and Provenance Ledger
Provides an overview of monitoring activity and records the origins and processing history of observations.
SHA-256 checksums are used to verify data integrity against recorded reference hashes.
Global 2D Map
Built around MapLibre, the mapping environment visualizes monitoring stations and available event information with filtering capabilities.
Signal Workspace
Provides waveform visualization and access to signal-processing workflows, including filtering and spectral analysis.
Sensor Fusion and Explainability
Supports comparative sensor analysis, ablation studies, counterfactual investigations, and uncertainty-oriented workflows.
Visual Pipeline Builder
Uses a Directed Acyclic Graph (DAG) approach to represent analytical workflows through connected processing nodes.
This allows researchers to construct and explore analysis pipelines visually.
Benchmark Arena
Provides a comparative environment for four classification approaches:
- Logistic Regression.
- Random Forest.
- Gradient Boosting Decision Trees.
- Majority Baseline.
The benchmarking environment is designed to compare model behavior using appropriate evaluation metrics, including F1-score and ROC-AUC where applicable.
Research Center and Competitor Intelligence
Organizes research findings and comparative information from more than 30 international scientific platforms and systems.
8. Scientific Integrity and Data Reliability
We believe that scientific innovation must be accompanied by transparency.
Our project distinguishes between real observations and synthetic simulation outputs.
According to our current project documentation, the dataset collection includes 75 events represented by 71 real events from Zenodo and four synthetic events.
Synthetic observations are explicitly labeled:
SYNTHETIC
We also distinguish between full waveform records and event-summary records, avoiding the substitution of simulated waveforms for unavailable real observations.
The platform incorporates several integrity-oriented mechanisms:
- Source tracking and data provenance.
- SHA-256 integrity checks.
- Explicit synthetic-data labeling.
- Separate simulation workflows.
- Signal-quality assessment.
- Uncertainty-oriented analysis.
- Reproducible processing configurations.
These mechanisms are intended to make the analytical process more transparent and reduce the risk of confusing experimental simulations with actual observations.
9. Engineering Challenges — What We Had to Overcome
Developing SKYQUAKE X presented several interconnected challenges.
Challenge 1: Fragmented Scientific Data
Different scientific organizations provide observations through different formats, interfaces, and data structures.
We addressed this by designing a unified data-integration approach.
Challenge 2: Different Physical Signal Characteristics
Infrasound and seismic observations cannot be treated as identical signals.
We needed separate processing approaches while maintaining a shared analytical framework.
Challenge 3: Environmental Noise
Wind, human activity, machinery, and natural background noise can interfere with observations.
This motivated our use of filtering, spectral analysis, and signal-quality assessment.
Challenge 4: Multi-Station Synchronization
Comparing observations from different stations requires careful handling of timestamps, latency, and clock differences.
This became one of the central engineering considerations in our sensor-fusion architecture.
Challenge 5: Scientific Validation
A model can produce a classification without necessarily identifying the true physical source.
We therefore focused on model comparison, uncertainty analysis, data provenance, and controlled simulation rather than treating every model output as established scientific fact.
Challenge 6: Keeping Real and Synthetic Data Separate
Simulation is essential for investigating rare events, but synthetic observations must never be mistaken for real-world measurements.
We addressed this through explicit labeling, separate workflows, and data-integrity mechanisms.
10. Testing and Engineering Verification
Our project documentation reports a suite of 67 automated tests covering different aspects of the platform.
The testing objectives include:
- Signal-processing consistency.
- Data-integrity verification.
- Simulation isolation.
- Synthetic-data identification.
- API and integration behavior.
- Database protection.
- Reproducibility of analytical workflows.
The architecture separates simulation outputs from real observation records, and simulation operations are designed to avoid modifying original observations.
We also use controlled tests to investigate whether running simulation laboratories changes the outputs of independent signal-processing operations.
These tests provide engineering evidence about software behavior; they do not, by themselves, establish the scientific accuracy of every physical model or the real-world detection performance of the platform.
11. What We Learned
Building SKYQUAKE X taught us that scientific innovation requires more than combining technologies.
We developed a deeper understanding of:
- Atmospheric acoustics and infrasonic propagation.
- Seismology and seismic wave behavior.
- Digital signal processing.
- Multi-sensor data fusion.
- Machine learning and explainability.
- Scientific simulation and uncertainty.
- Data provenance and reproducibility.
- Software architecture and automated testing.
One of our most important lessons was that different sensors do not simply provide more data. They provide different kinds of physical evidence.
The real challenge is understanding when those observations complement each other, when they disagree, and how uncertainty should influence the final interpretation.
12. Future Vision
SKYQUAKE X is an evolving research platform.
Our future development goals include:
- Expanding integration with additional verified global monitoring datasets.
- Supporting larger networks of synchronized infrasound and seismic stations.
- Improving event localization and uncertainty estimation.
- Testing analytical models against independently verified historical events.
- Expanding physical simulations and validating their assumptions.
- Improving explainable AI and model-drift monitoring.
- Developing more comprehensive real-time analytical capabilities where reliable data access permits.
Our long-term vision is to create a unified scientific environment where researchers can investigate atmospheric and seismic phenomena through connected observations, transparent analytical methods, and reproducible experiments.
13. Final Message — One Platform, Two Worlds of Evidence
SKYQUAKE X began with an inspiring scientific question and grew into an ambitious engineering project supported by research across more than 30 global platforms.
Through the integration of infrasound monitoring, seismic analysis, AI-assisted investigation, scientific signal processing, and 24 simulation laboratories, we are exploring a more connected approach to understanding unusual atmospheric and geophysical events.
We do not claim to replace existing monitoring organizations or provide guaranteed early warnings. Our goal is to contribute a complementary analytical framework that helps researchers investigate the physical evidence behind complex events.
The atmosphere has a signal. The ground has a signal. SKYQUAKE X brings them together.
Built With
- amazon-web-services
- analysis
- artificial
- computing
- data
- fastapi
- geospatial
- infrasound
- intelligence
- maplibre
- processing
- python
- react
- research
- scientific
- seismology
- sensor
- series
- signal
- simulation
- transform
- visualization
- wavelet
