-
-
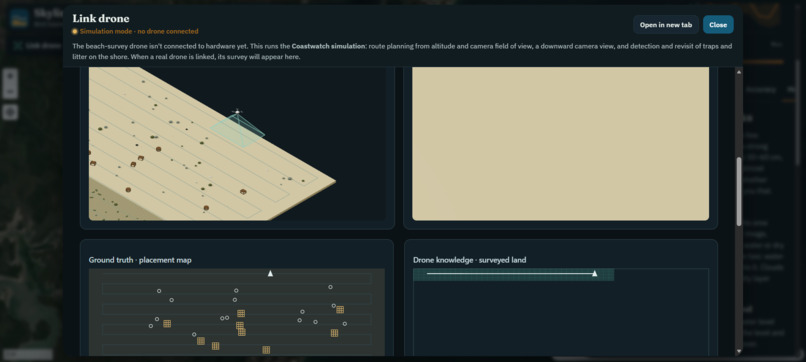
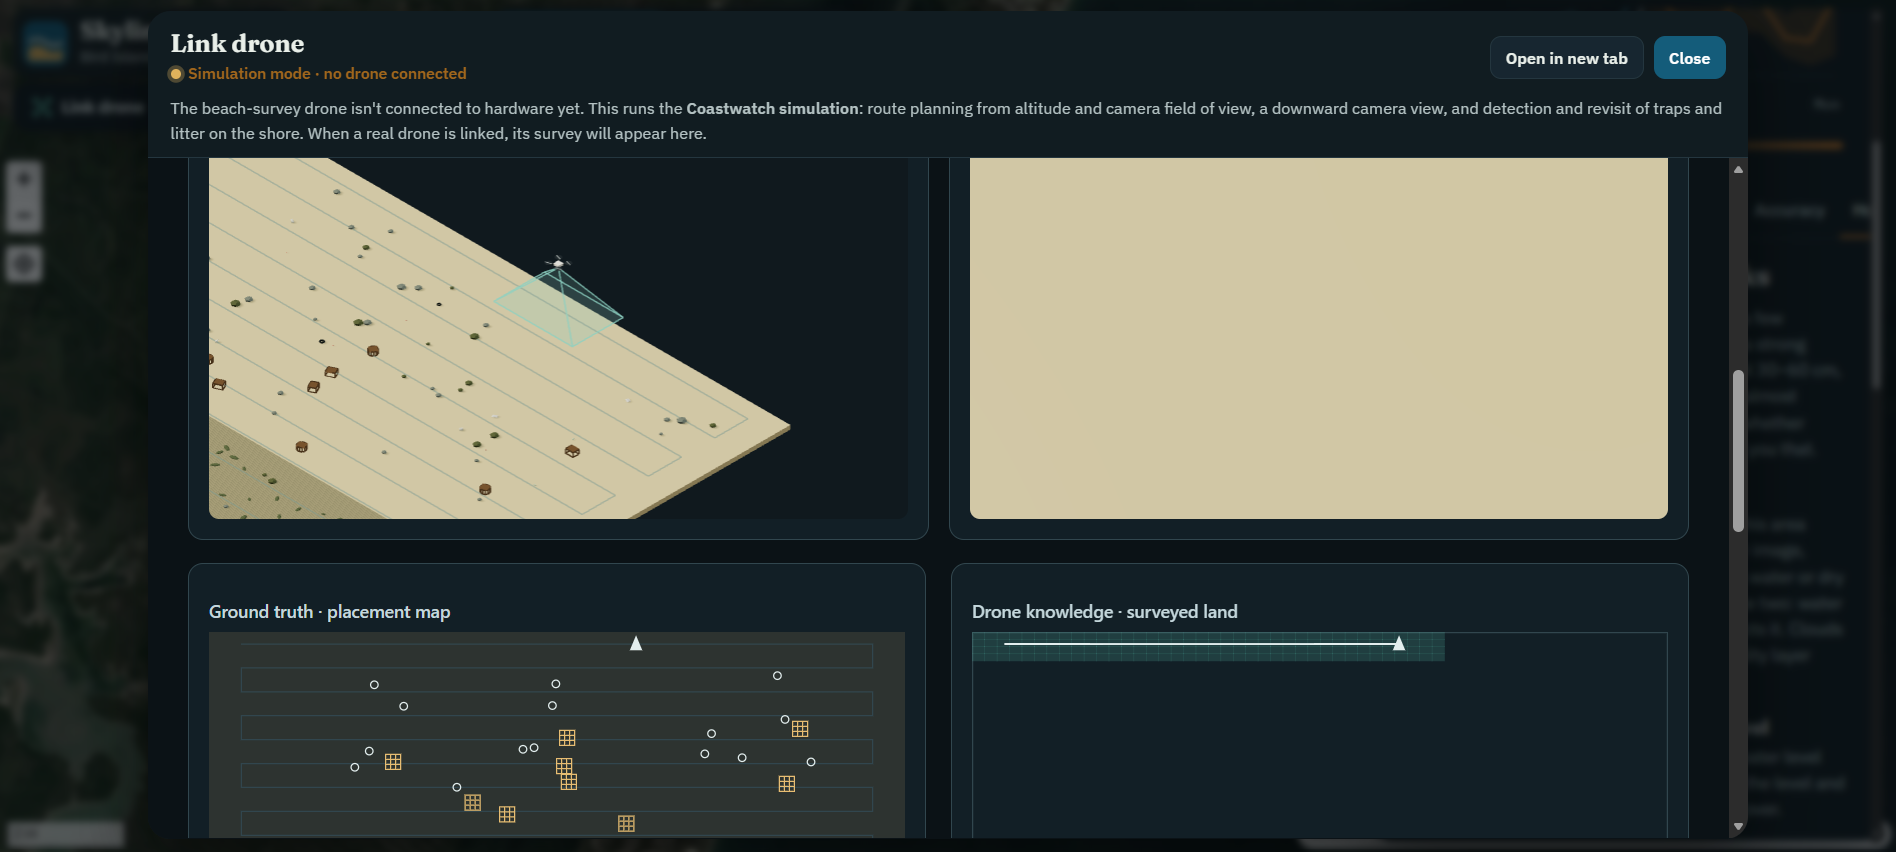
Drone simulation
-
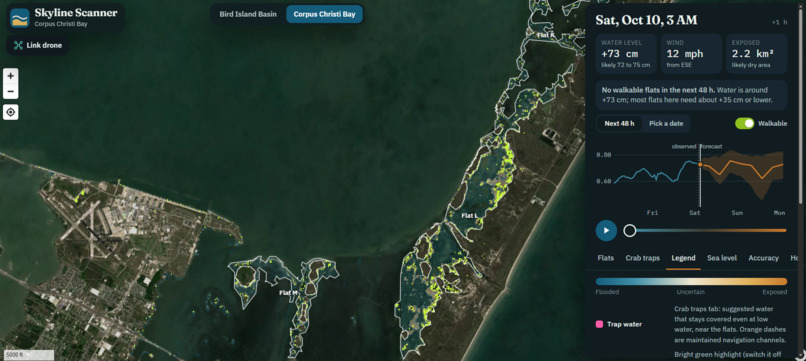
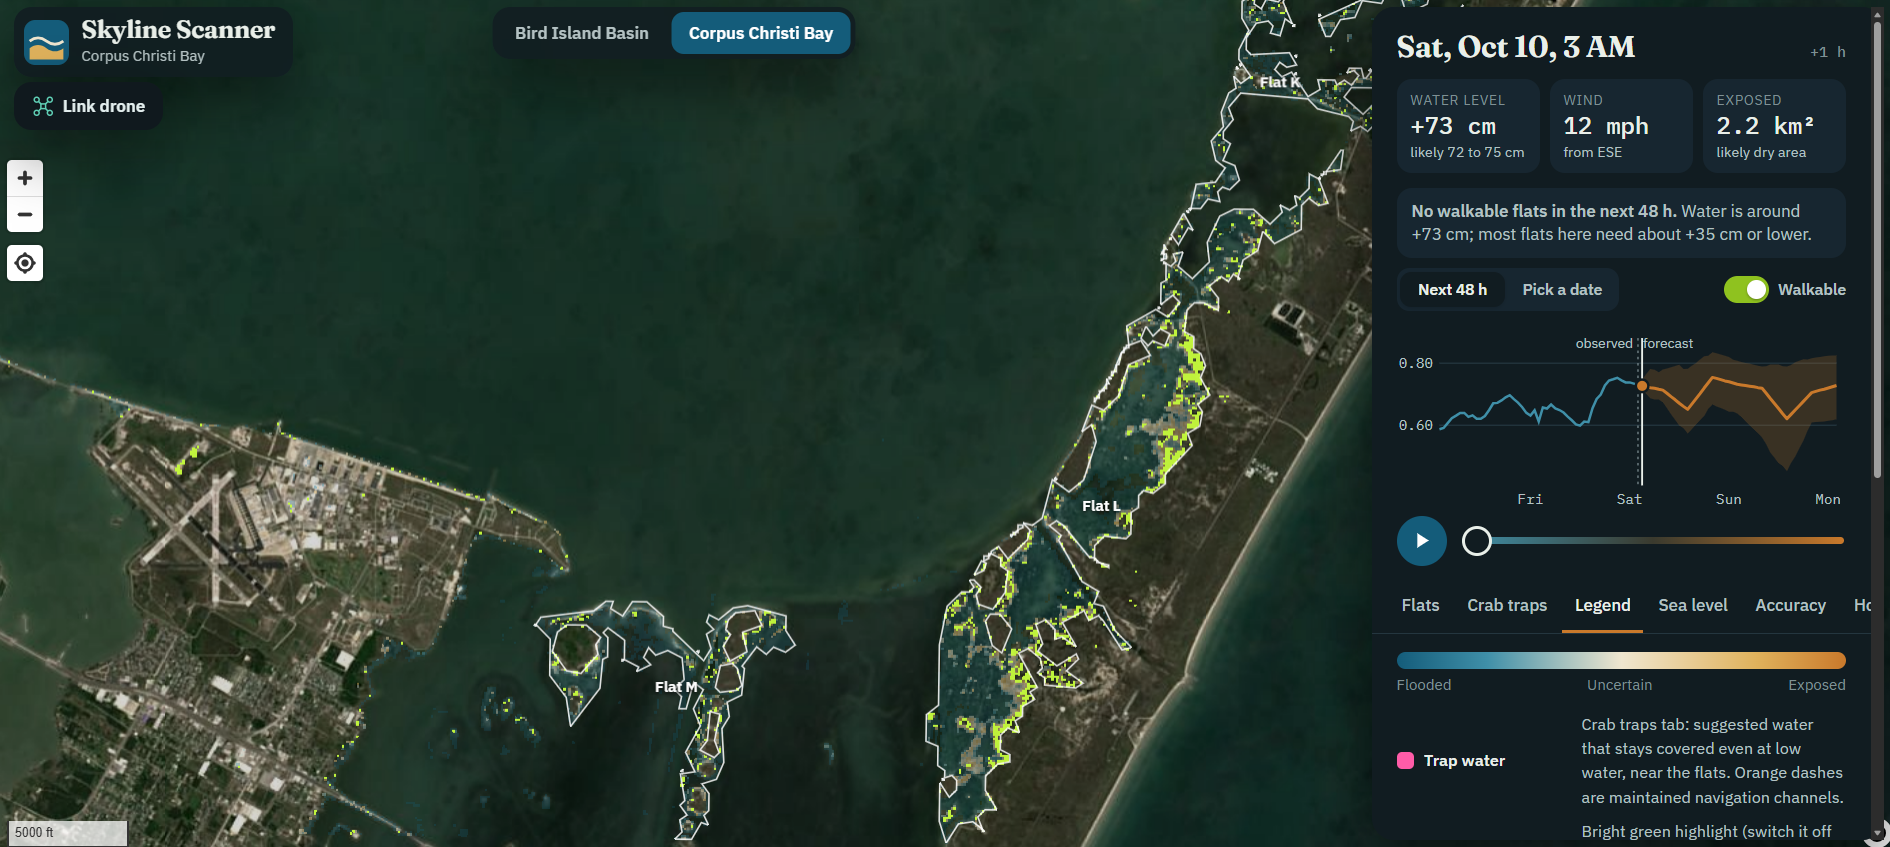
Corpus Christi Bay
-
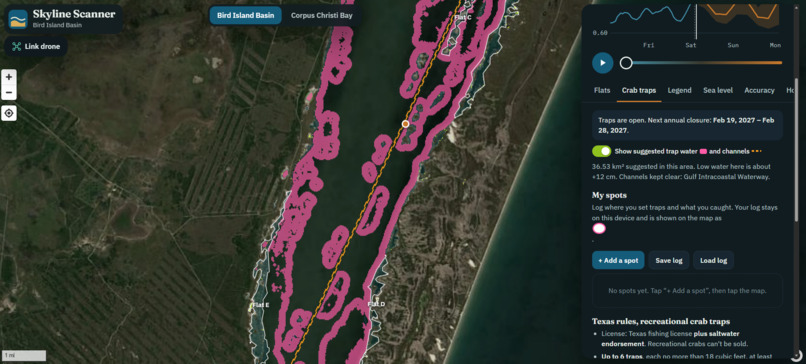
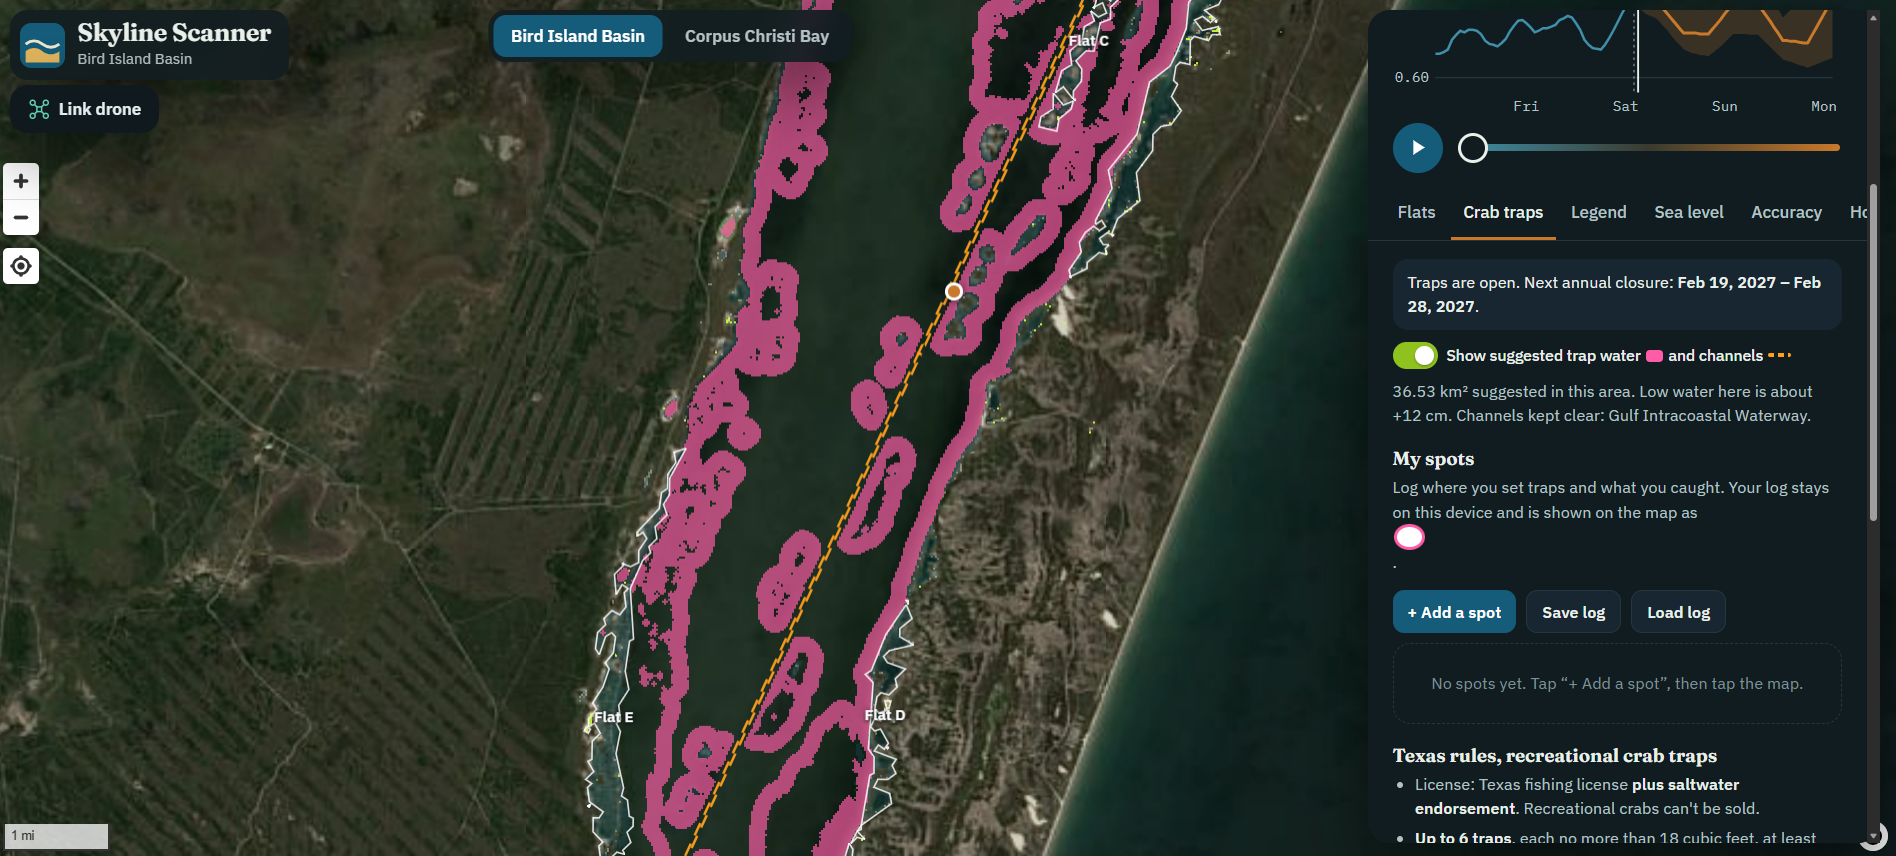
Crab trap map - Bird Island Basin
-
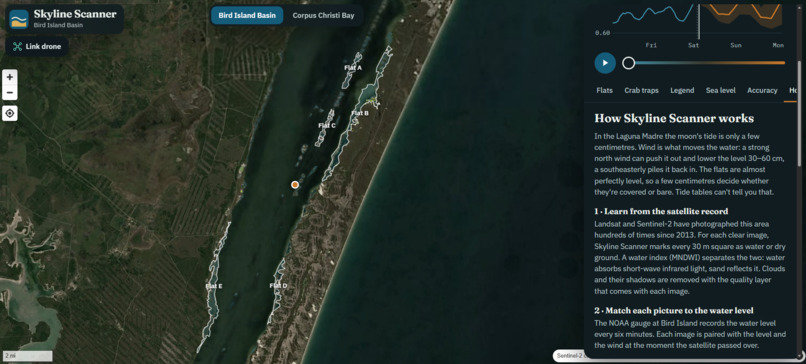
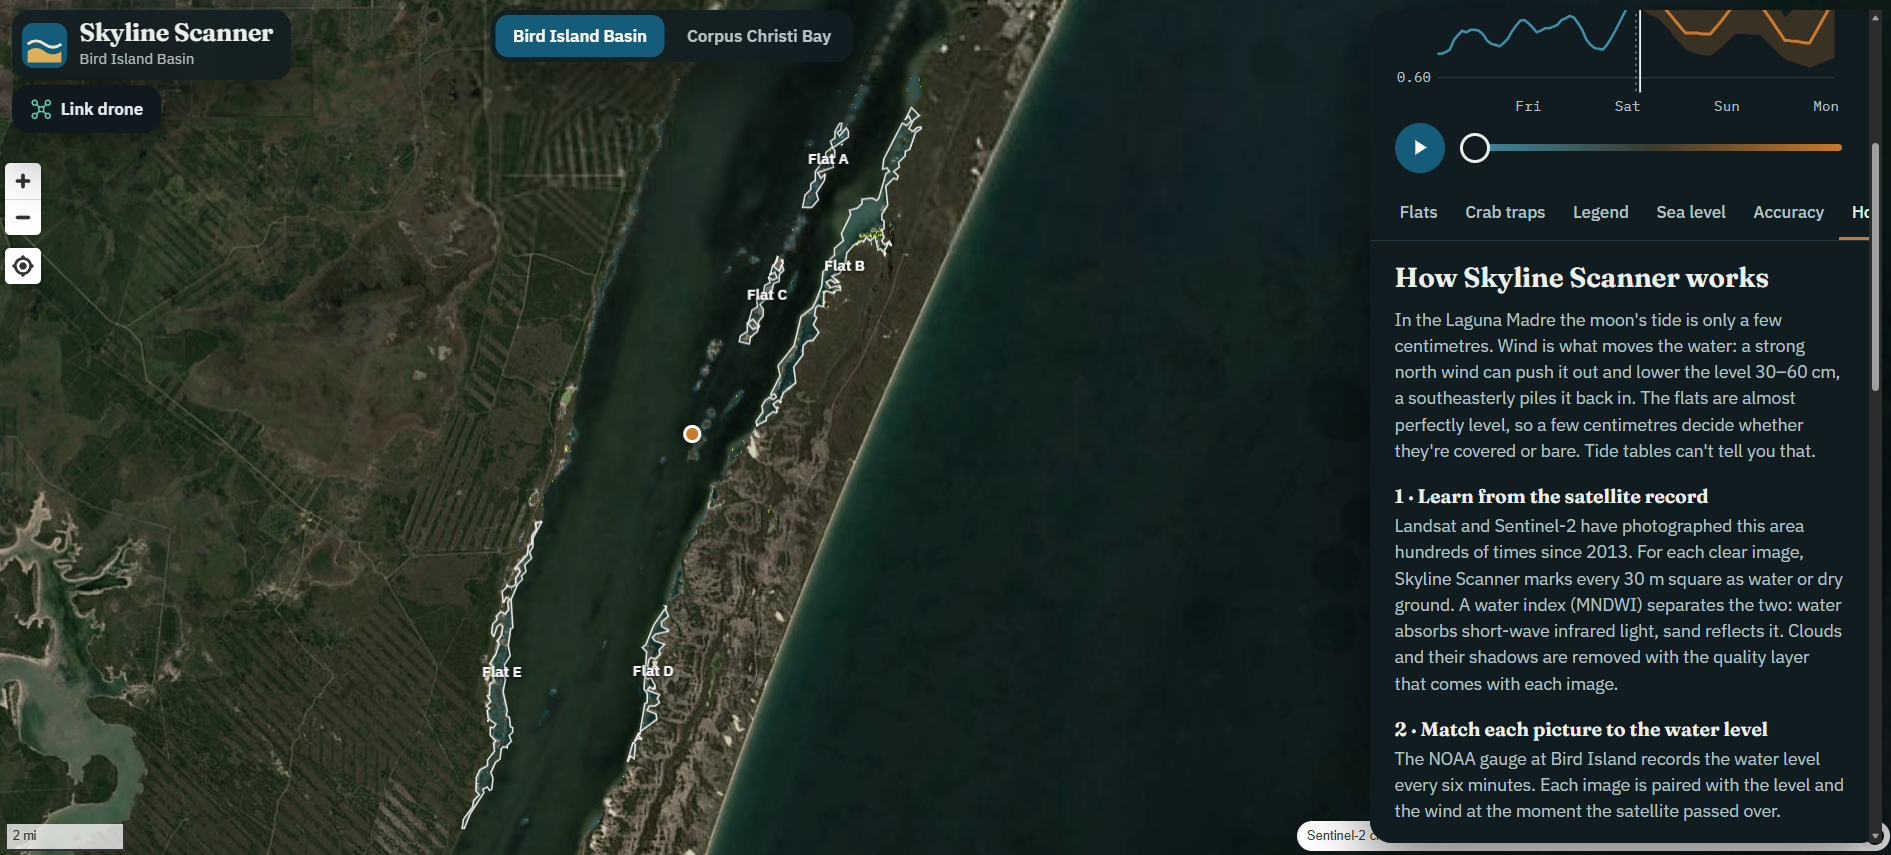
About Skyline Scanner - Bird Island Basin
Inspiration
A cleanup mission starts before anyone reaches the shoreline: where should the team search, and when will conditions give them the best opportunity?
We focused on abandoned crab traps, often called ghost traps, around the Upper Laguna Madre. Searching this landscape means dealing with changing water coverage. Wind can expose or flood shallow flats, so astronomical tide predictions alone do not tell the whole story.
We wanted to turn satellite history and local water measurements into something a cleanup team could use: a map showing where ground is likely to be exposed and how that changes over the next two days.
What it does
Skyline Scanner helps users explore 48 hours of predicted exposure around Bird Island Basin.
The interactive map shows which areas are likely to be exposed or flooded. Users can move through the timeline, inspect individual flats, and view estimated exposure windows alongside wind and water-level forecasts. The interface also communicates uncertainty, helping users distinguish promising windows from less certain conditions.
A separate view explores how higher sea levels could change how often the flats are exposed.
The current tool forecasts conditions for search planning. It does not automatically detect crab traps or establish whether exposed ground is safe to walk on.
How we built it
Our forecasting engine, Skyline Scanner, combines two models.
First, we match historical NASA Landsat and Sentinel-2 satellite imagery with NOAA water-gauge observations. After filtering clouds and ambiguous pixels, the model learns the water level at which each 30-meter patch tends to become exposed. It also accounts for wind tilting the water surface across the lagoon.
Second, a LightGBM model uses forecast winds and recent water conditions to predict future water levels.
Combining those models produces an hourly map of the probability of exposed ground. We built the processing pipeline in Python and the interactive website with JavaScript and MapLibre GL JS.
We designed the interface around the user’s decision: choosing an area and time to investigate. A map, time slider, and exposure windows make the forecast accessible without requiring users to interpret raw satellite data.
Challenges we ran into
Separating water from exposed ground was more complicated than choosing a single image threshold. Wet sand, algal mats, clouds, and changing ocean conditions can confuse the classification. We retained an ambiguous category and restricted the analysis to the lagoon and its shores.
We also needed a realistic evaluation. Testing with weather observations that would only become available later could make a forecast look better than it really is. Our water-level evaluation instead uses archived wind forecasts available at the time.
Another challenge was communicating uncertainty clearly. A precise-looking map can suggest more certainty than the underlying data supports.
Accomplishments that we're proud of
We connected satellite processing, water-level prediction, exposure modeling, and an interactive map in one repeatable pipeline.
We evaluated the water-level model across 1,452 historical forecast issue times in 2025, a year excluded from model training. Its average absolute error was approximately 2.2 centimeters when predicting one day ahead. At 6, 24, and 48 hours, it outperformed the simple baseline of assuming the water level would remain unchanged.
Those results validate the water-level component. Direct field validation of the predicted exposed areas remains an important next step.
We are also proud of making the output understandable: users can explore where and when ground may be exposed through a visual interface rather than a table of predictions.
What we learned
A useful environmental tool needs both credible predictions and a clear connection to a real decision.
We learned that geographic boundaries and uncertain observations can matter as much as model choice. We also learned to distinguish what the system predicts from what a cleanup team still needs to verify in the field.
What's next for Skyline Scanners
Our next step is to compare predicted exposure with field observations and get feedback from cleanup teams.
We also plan to connect the forecast to a drone survey workflow. The forecast would suggest promising areas and exposure windows. Drone imagery would then support identifying and mapping candidate traps and trash for human review.
This integration is planned, rather than a completed detection system. We would evaluate both detection accuracy and location accuracy before relying on those results for cleanup planning.
Our goal is to connect a broad forecast of where to look with detailed observations of what is actually there.

Log in or sign up for Devpost to join the conversation.