SkyGrid Energy
Inspiration
The idea for SkyGrid came from a simple observation: energy is local, but energy markets are not.
Every day, homeowners with solar panels generate more electricity than they consume. What happens to that surplus? It gets exported to the grid at wholesale rates, sometimes as low as \$0.03/kWh, while their neighbor next door pays \$0.15/kWh or more to the utility. The inefficiency is staggering.
I started thinking: what if neighbors could trade directly?
The math is compelling. If a producer sells at \$0.10/kWh instead of \$0.03, and a consumer buys at \$0.10 instead of \$0.15, both sides win:
$$ \text{Producer Gain} = P_{local} - P_{wholesale} = 0.10 - 0.03 = \$0.07/\text{kWh} $$
$$ \text{Consumer Savings} = P_{utility} - P_{local} = 0.15 - 0.10 = \$0.05/\text{kWh} $$
At scale, for a community trading 1,000 kWh daily:
$$ \text{Daily Value Created} = 1000 \times (0.07 + 0.05) = \$120/\text{day} $$
That is over \$43,000 per year staying in a single neighborhood instead of flowing to centralized utilities.
This was not just a technical problem. It was a coordination problem. And coordination problems can be solved with good software.
What it does
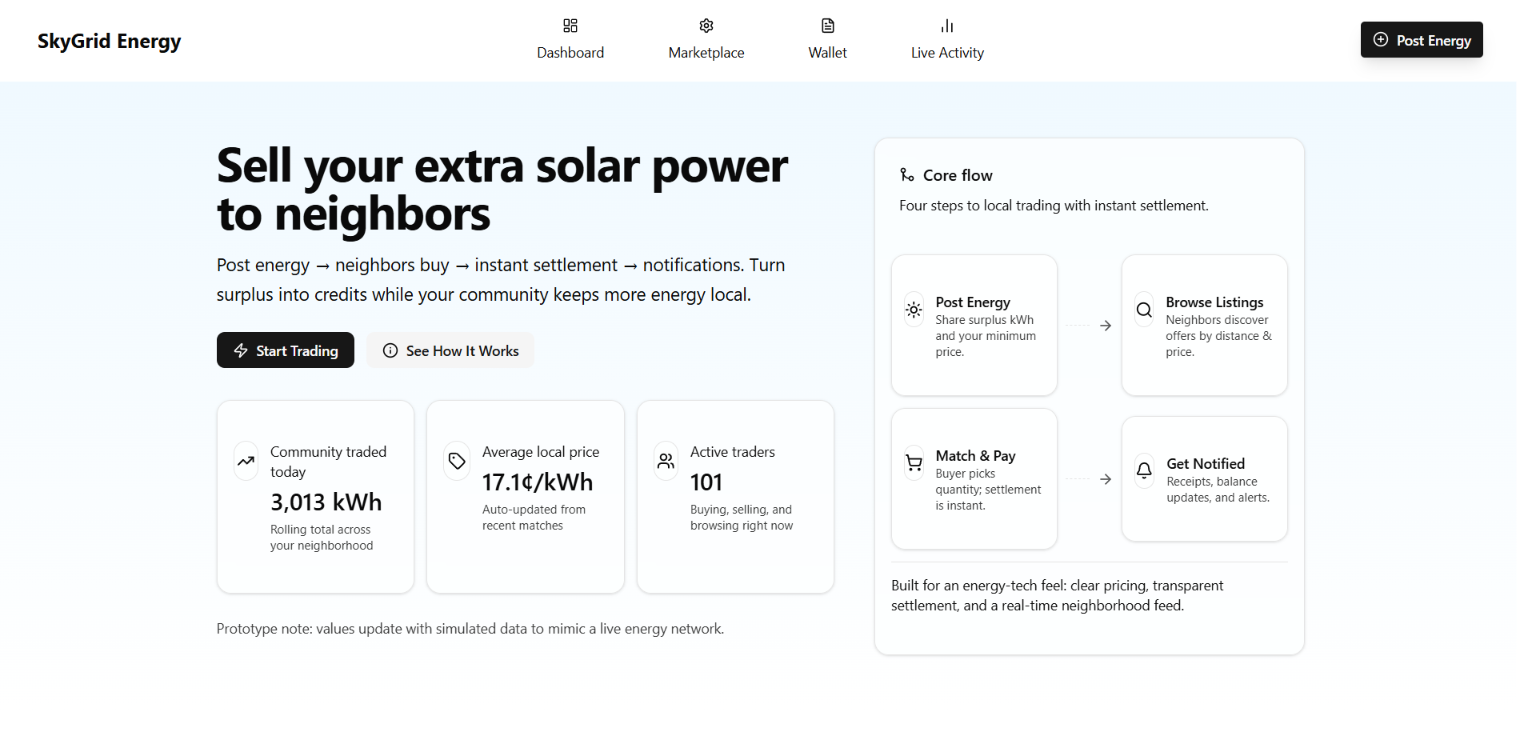
SkyGrid Energy is a peer-to-peer solar energy trading platform that lets neighbors buy and sell surplus energy directly.
For Producers:
- Post surplus energy with amount, price, and delivery window
- Set your own prices based on local demand
- Receive instant settlement when delivery is confirmed
For Consumers:
- Browse energy listings from nearby neighbors
- Filter by distance, price, time window, and energy type
- Reserve capacity and purchase with one click
Core Features:
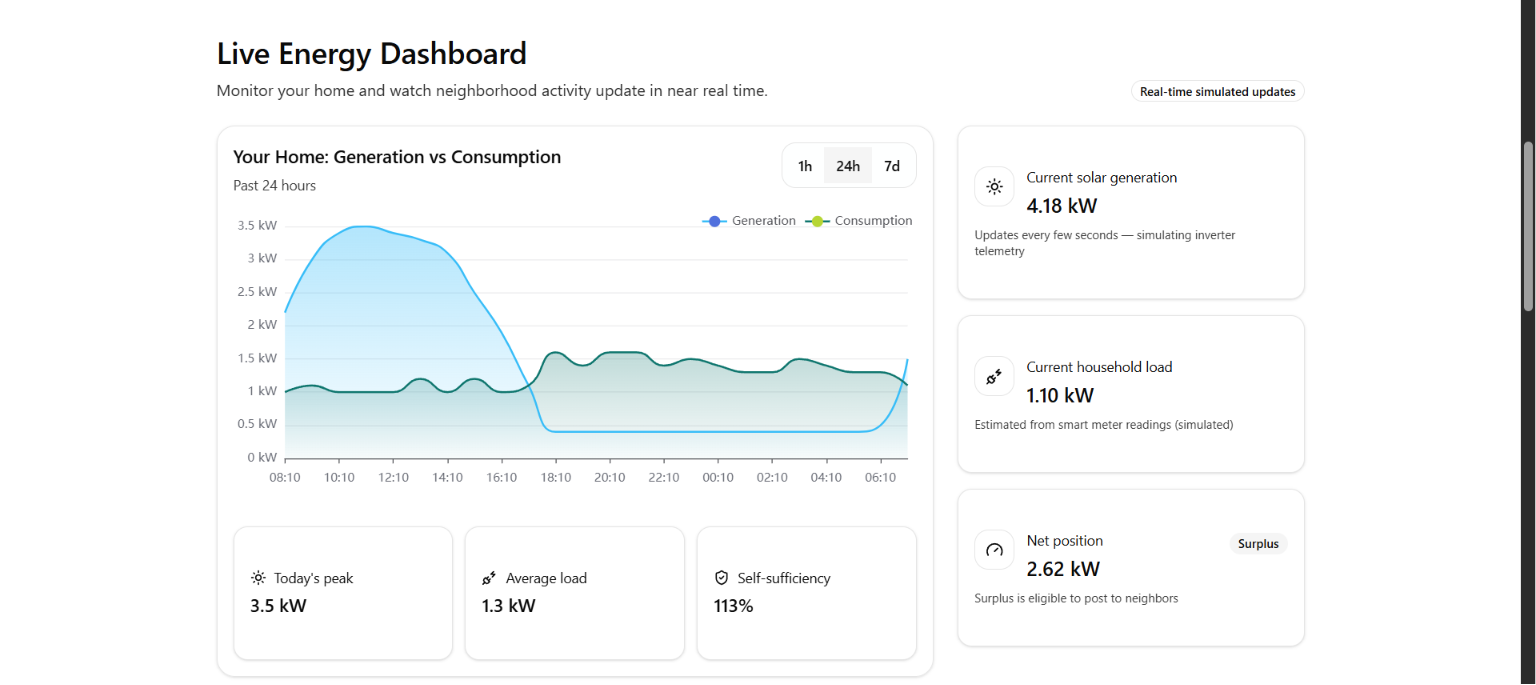
- Real-time dashboard with community metrics (total kWh traded, average price, active traders)
- Live charts showing generation vs consumption over time
- Marketplace with filtering and instant purchase flow
- Wallet system with transaction history
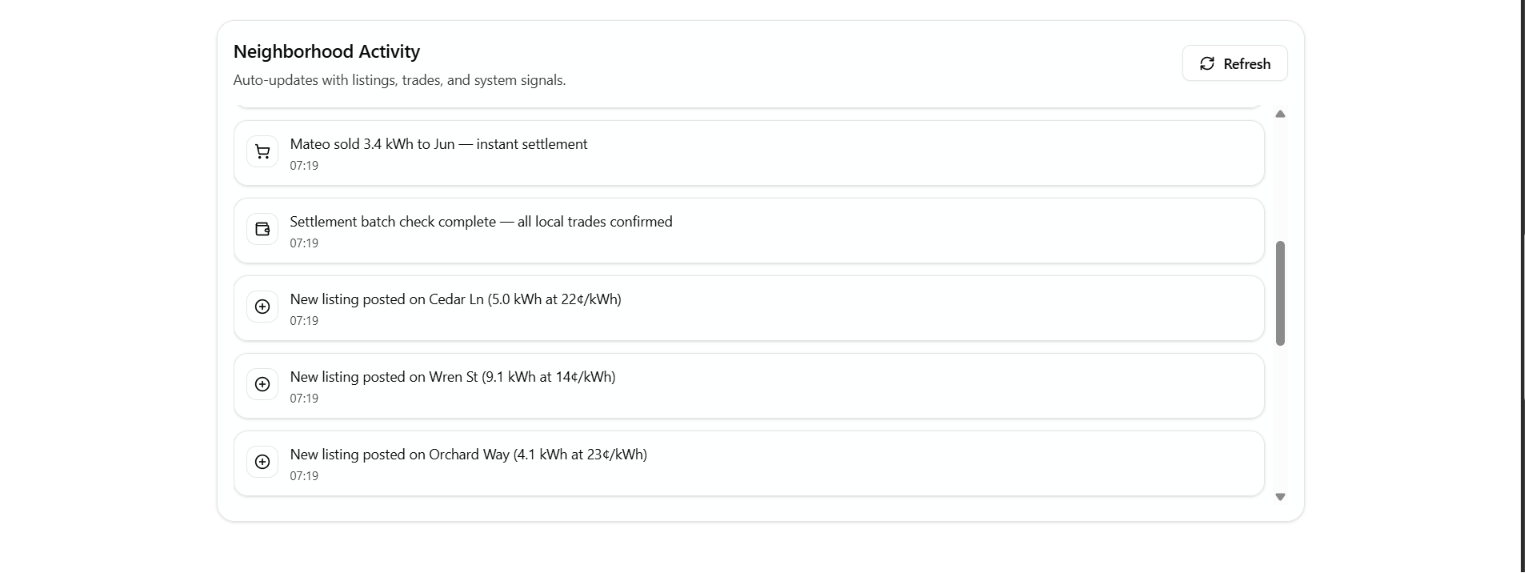
- Live activity feed that updates as trades happen
- Smooth scroll navigation between sections
The key insight is that SkyGrid does not move electrons. It coordinates who gets credited. Think of electricity like water in a shared pipe: you cannot route specific molecules, but you can account for who put energy in and who took it out. The platform is an accounting layer, not a delivery system.
How we built it
We built SkyGrid as a modern web application using Next.js 14 and the App Router architecture.
| Layer | Technology |
|---|---|
| Framework | Next.js 14 (App Router) |
| Language | TypeScript |
| Styling | Tailwind CSS |
| Components | shadcn/ui |
| Charts | Apache ECharts |
| Forms | React Hook Form |
| Icons | Lucide React |
Key Architecture Decisions:
- Event-driven communication using browser CustomEvents for cross-component updates
- Simulated real-time data using intervals with bounded randomness
- Section-based navigation with smooth scrolling for a cohesive single-page experience
- Dynamic imports for ECharts to handle server-side rendering
We focused on building reusable components with clear separation of concerns, explicit TypeScript types throughout, and a consistent design system using shadcn/ui and Tailwind CSS.
Challenges we ran into
Component Architecture
Building a component library that felt cohesive while handling complex interactions was challenging. We needed forms with validation, modals with multi-step flows, and data tables with filtering. Using shadcn/ui as a foundation helped, but we still had to carefully structure form field patterns and ensure consistent styling across all interactive elements.
Responsive Design
Creating a responsive layout that works well on mobile, tablet, and desktop required careful planning. We used Tailwind breakpoints extensively and tested each layout at multiple screen sizes to ensure nothing broke.
Server-Side Rendering with ECharts
ECharts uses browser APIs that do not exist during server-side rendering, causing Next.js to crash. We solved this with dynamic imports and SSR disabled:
const ReactECharts = dynamic(() => import('echarts-for-react'), {
  ssr: false
});
Simulating Realistic Data
Static mock data feels dead, but fully random data feels chaotic. We implemented bounded randomness with smooth transitions. For example, solar generation follows a realistic curve that peaks at midday, load increases in the evening, and prices fluctuate within reasonable bounds.
Cross-Component State
When a user posts energy in the Header component, the Live Activity Feed needs to update. Rather than prop drilling or adding a state management library, we used browser CustomEvents as a lightweight pub/sub system.
Accomplishments that we're proud of
Full Trading Flow
We built a complete user journey from posting energy to settlement. Users can post listings, browse the marketplace, filter by multiple criteria, purchase energy, and see their wallet update instantly.
Real-Time Feel
The animated numbers, live activity feed, and instant updates create a sense of liveness that builds user trust. When you complete a trade, you see your wallet balance update, the listing quantity decrease, and the trade appear in the activity feed all at once.
Clean Codebase
The project resulted in a well-structured, typed, maintainable codebase. Components are modular, types are explicit, and the architecture is clear.
Event System
The CustomEvent-based communication between components works seamlessly. Posting energy in the header triggers an update in the live feed without any prop drilling or complex state management.
Professional UI
Using shadcn/ui and Tailwind, we achieved a clean, modern interface that looks like a real energy-tech product, not a hackathon prototype.
What we learned
Energy Markets Are Coordination Problems
The biggest insight was not technical. SkyGrid does not move electrons. It coordinates who gets credited. The net flow in a grid is simply the sum of all production minus the sum of all consumption:
$$ \text{Net Flow} = \sum_{i} \text{Production}i - \sum{j} \text{Consumption}_j $$
You cannot route specific electrons to specific consumers. But you can account for who injected energy, who withdrew it, and when and where it happened. The platform is an accounting layer, not a delivery system. This reframing made the entire architecture clearer.
Iteration Speed Matters
We moved fast by avoiding premature optimization, getting the core flow right first, and refining details later. Starting with the user journey and working backward to the architecture kept us focused on what actually mattered.
Real-Time UX Creates Trust
Perceived responsiveness is as important as actual functionality. The live updates are not just eye candy. They make the platform feel trustworthy and real.
shadcn/ui Accelerates Development
The component library is accessible by default, easy to install, fully customizable, and has excellent TypeScript support. It provided a solid foundation that let us focus on business logic rather than reinventing UI primitives.
What's next for SkyGrid Energy
Real Data
Integrate with smart meter APIs to get actual production and consumption data. Connect to grid data feeds for real-time pricing signals. Implement verified delivery confirmation.
Real Payments
Add payment rails for actual money movement. Explore utility billing integration for seamless settlement. Investigate on-chain settlement using smart contracts for transparency and automation.
Real Scale
Build mobile apps for iOS and Android. Expand to support multiple regions and grid nodes. Develop operator tools for community microgrid management. Add admin panels for auditing trades and managing users.
The prototype proves the UX can work. The next step is connecting real meters, real payments, and real communities. We are not replacing the grid. We are helping neighbors trade on top of it.
Built With
- apache
- css
- javascript
- next.js14
- react
- typescript
- zod

Log in or sign up for Devpost to join the conversation.