-
skybrief-cover
-
games-that-teach
-
night-lights-and-people-correlation
-
spot-the-real-change
-
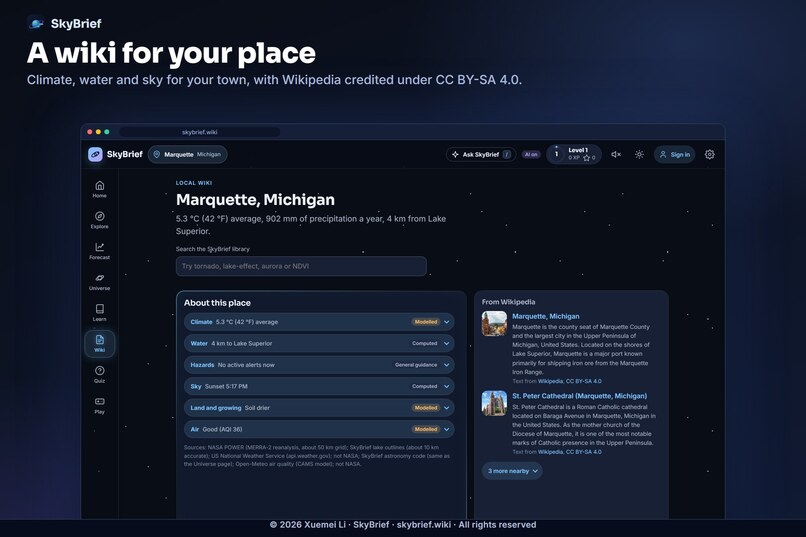
a-wiki-for-your-place
-
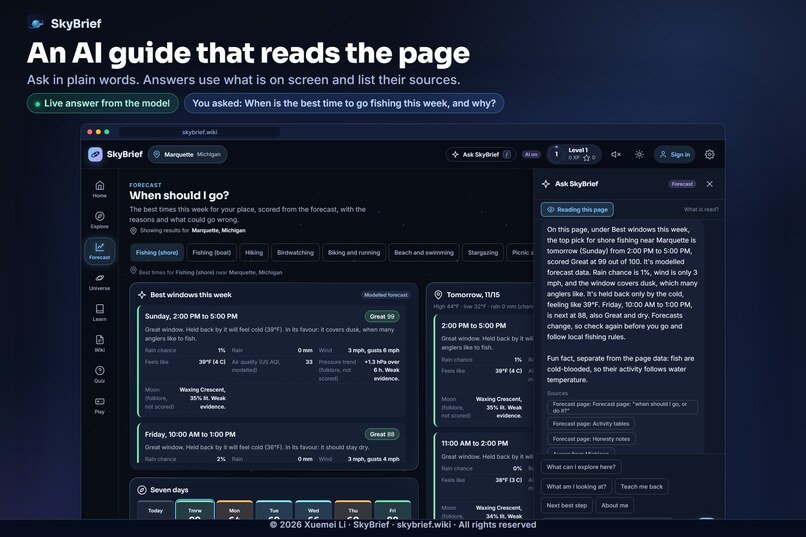
ai-guide-reads-the-page
-
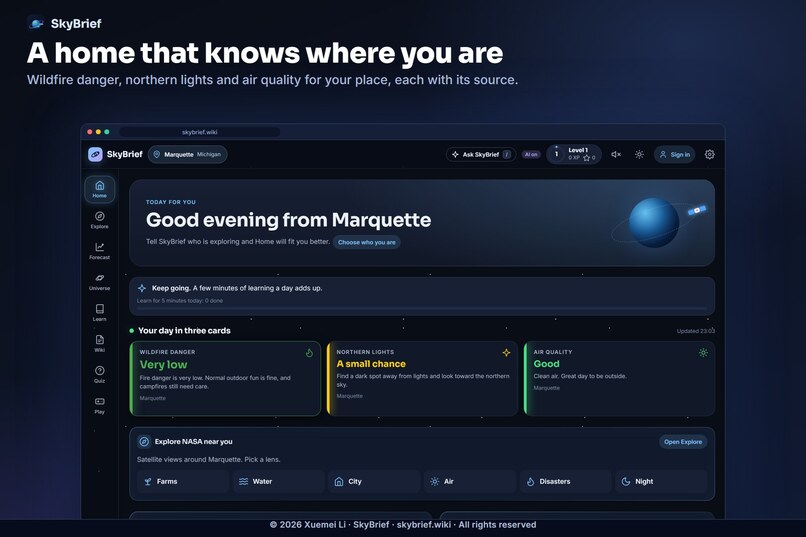
homepage-personalized
-
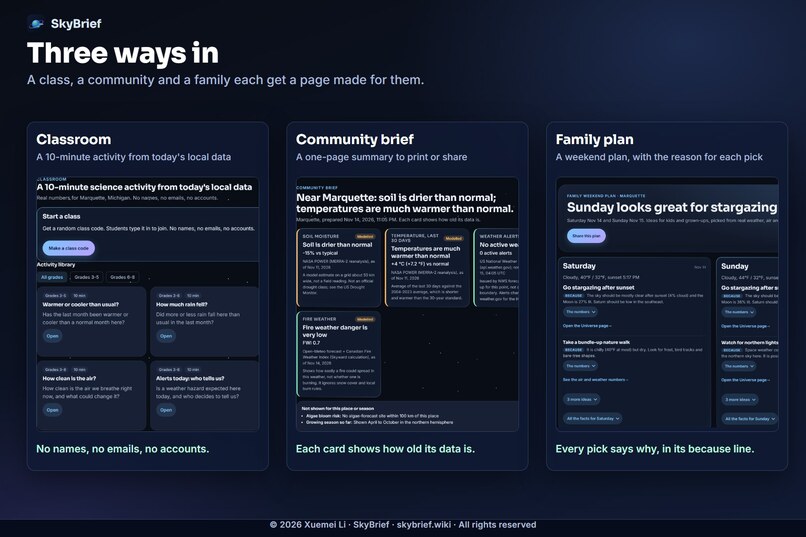
three-use-cases
-
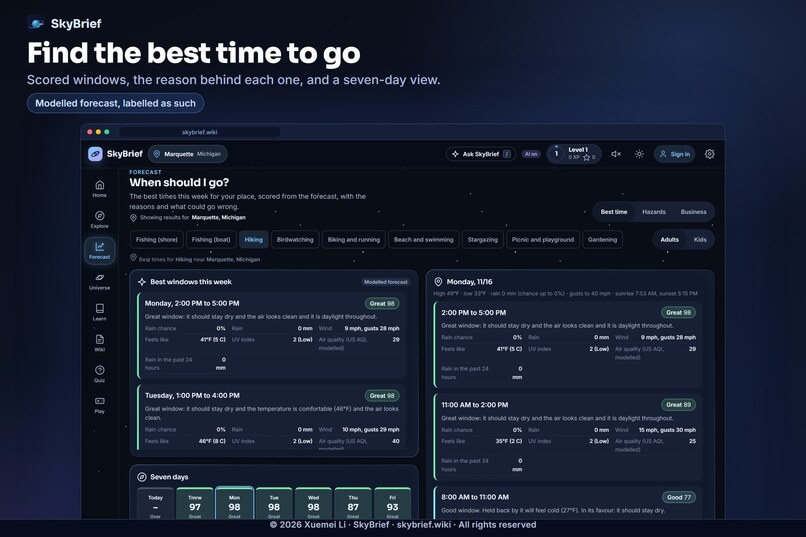
best-time-to-go
-
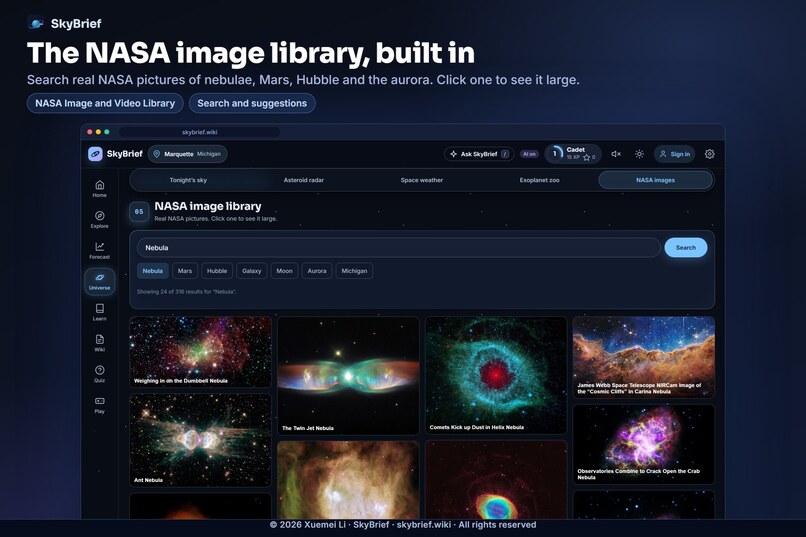
nasa-image-library
-
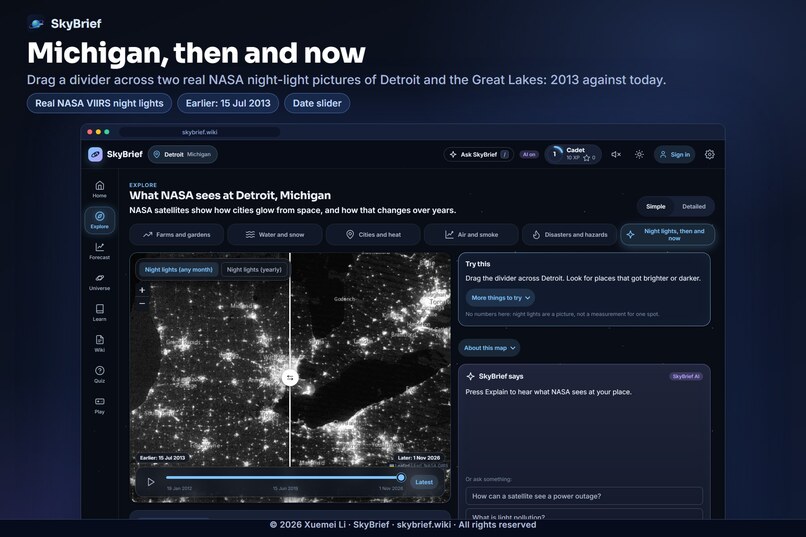
michigan-then-and-now
-
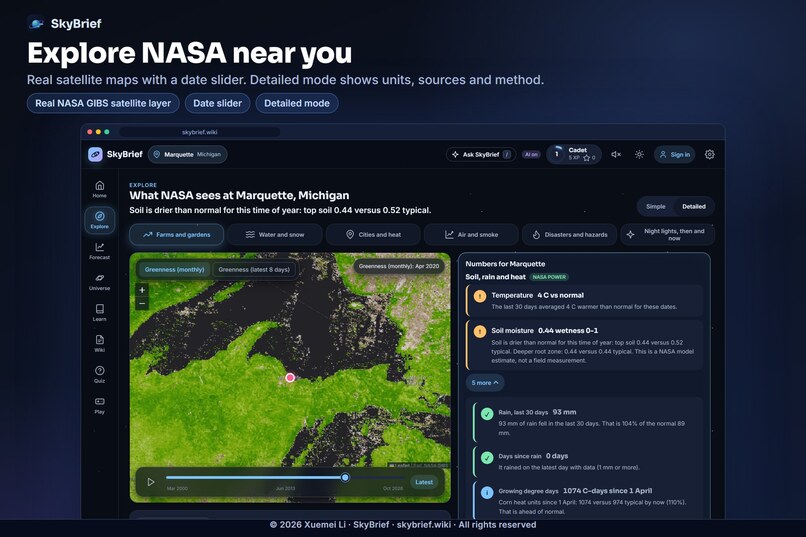
explore-NASA-near-you
Inspiration
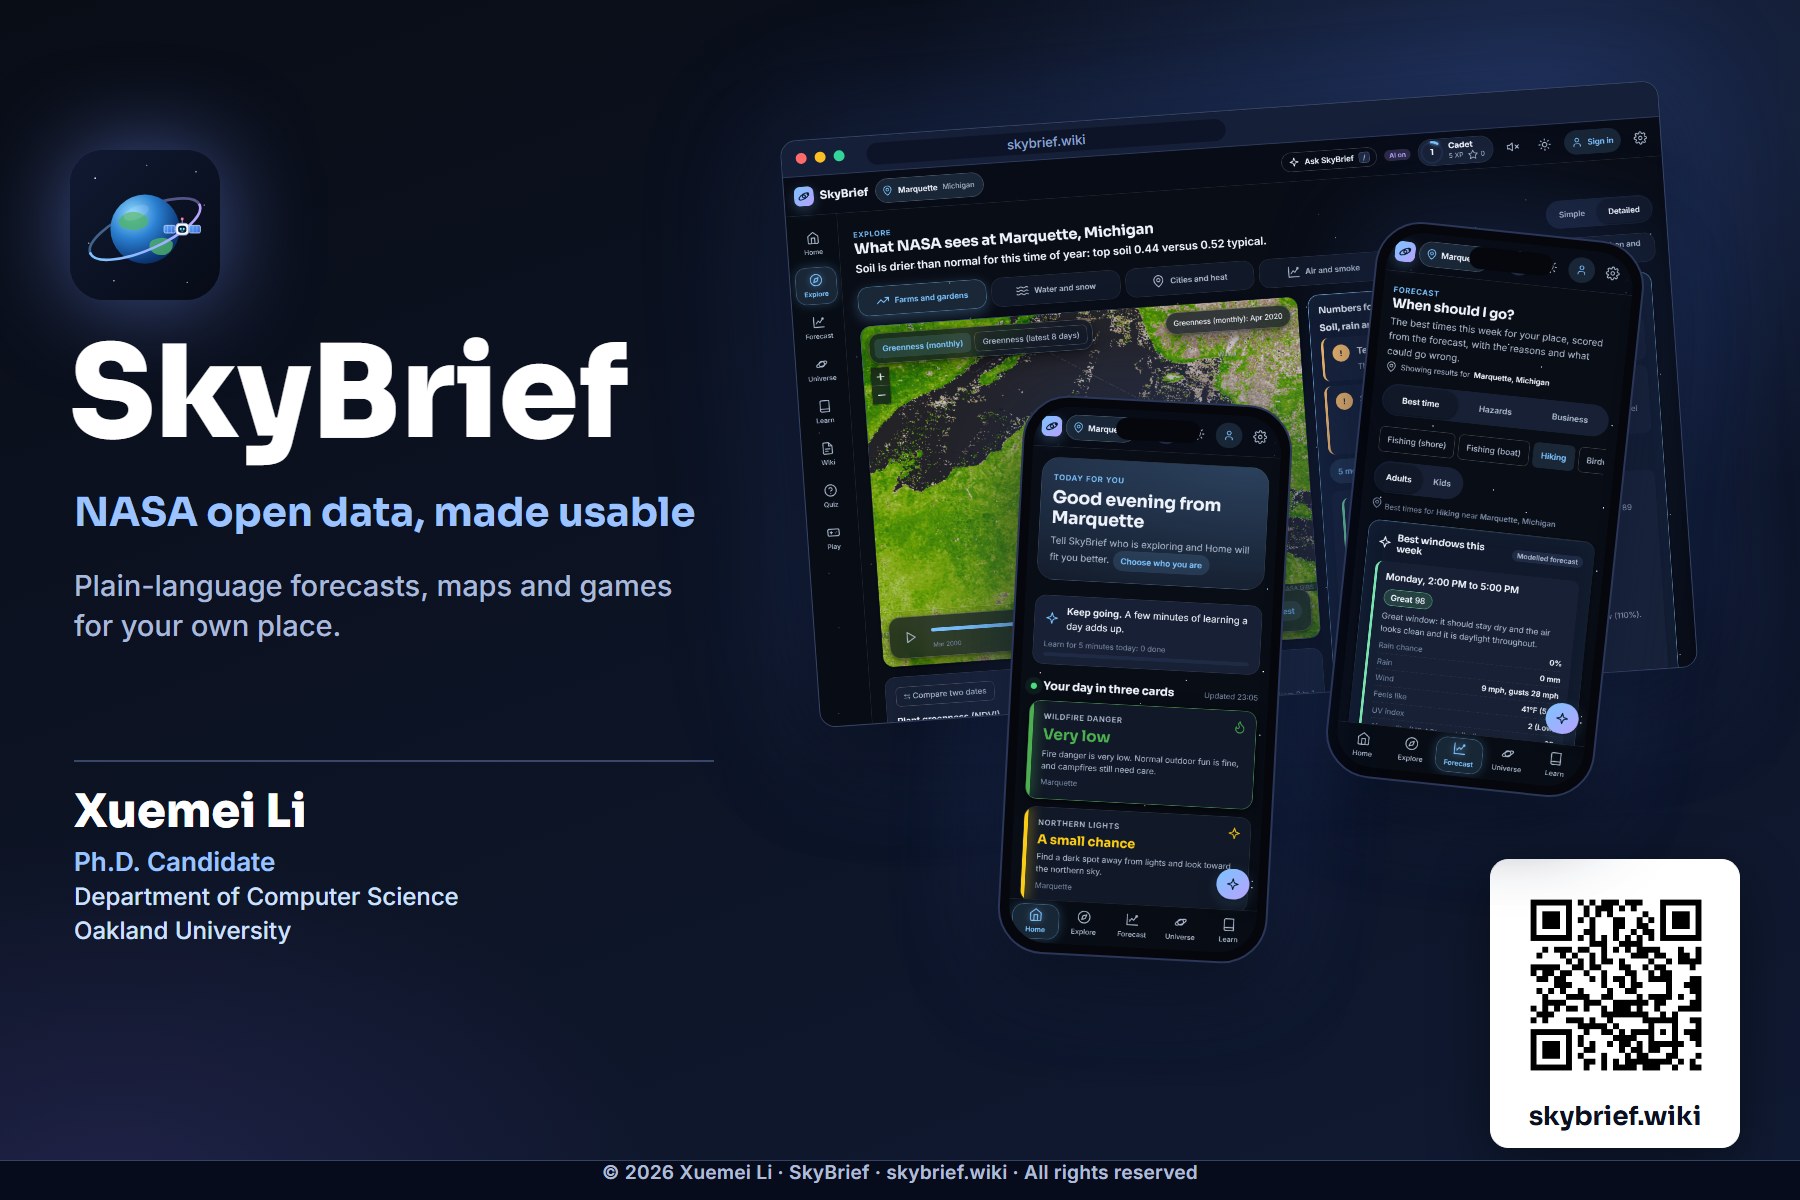
NASA gives the world a firehose of open data: satellites that see wildfires, lake algae, city heat and the lights of every town at night. Almost nobody can use it.
- A fifth-grade teacher has ten minutes before class, not ten hours to clean a dataset.
- A town clerk needs one citable page for a council meeting, not a portal of 40 download links.
- A parent wants to know whether Saturday is good for fishing, not what an FWI is.
- A curious kid gets a wall of charts, and moves on.
Opening data is not the same as making it usable. So I asked: what if NASA data answered the question you actually have, for the place where you actually live, in plain words, with its sources?
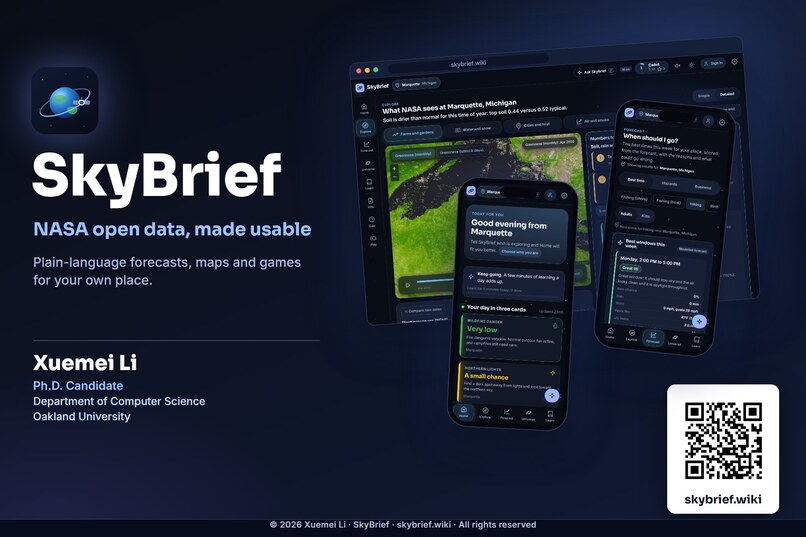
That is SkyBrief. I built it alone: design, algorithms, AI pipeline, hosting and tests, from a blank folder to a live site.
The pain points it attacks
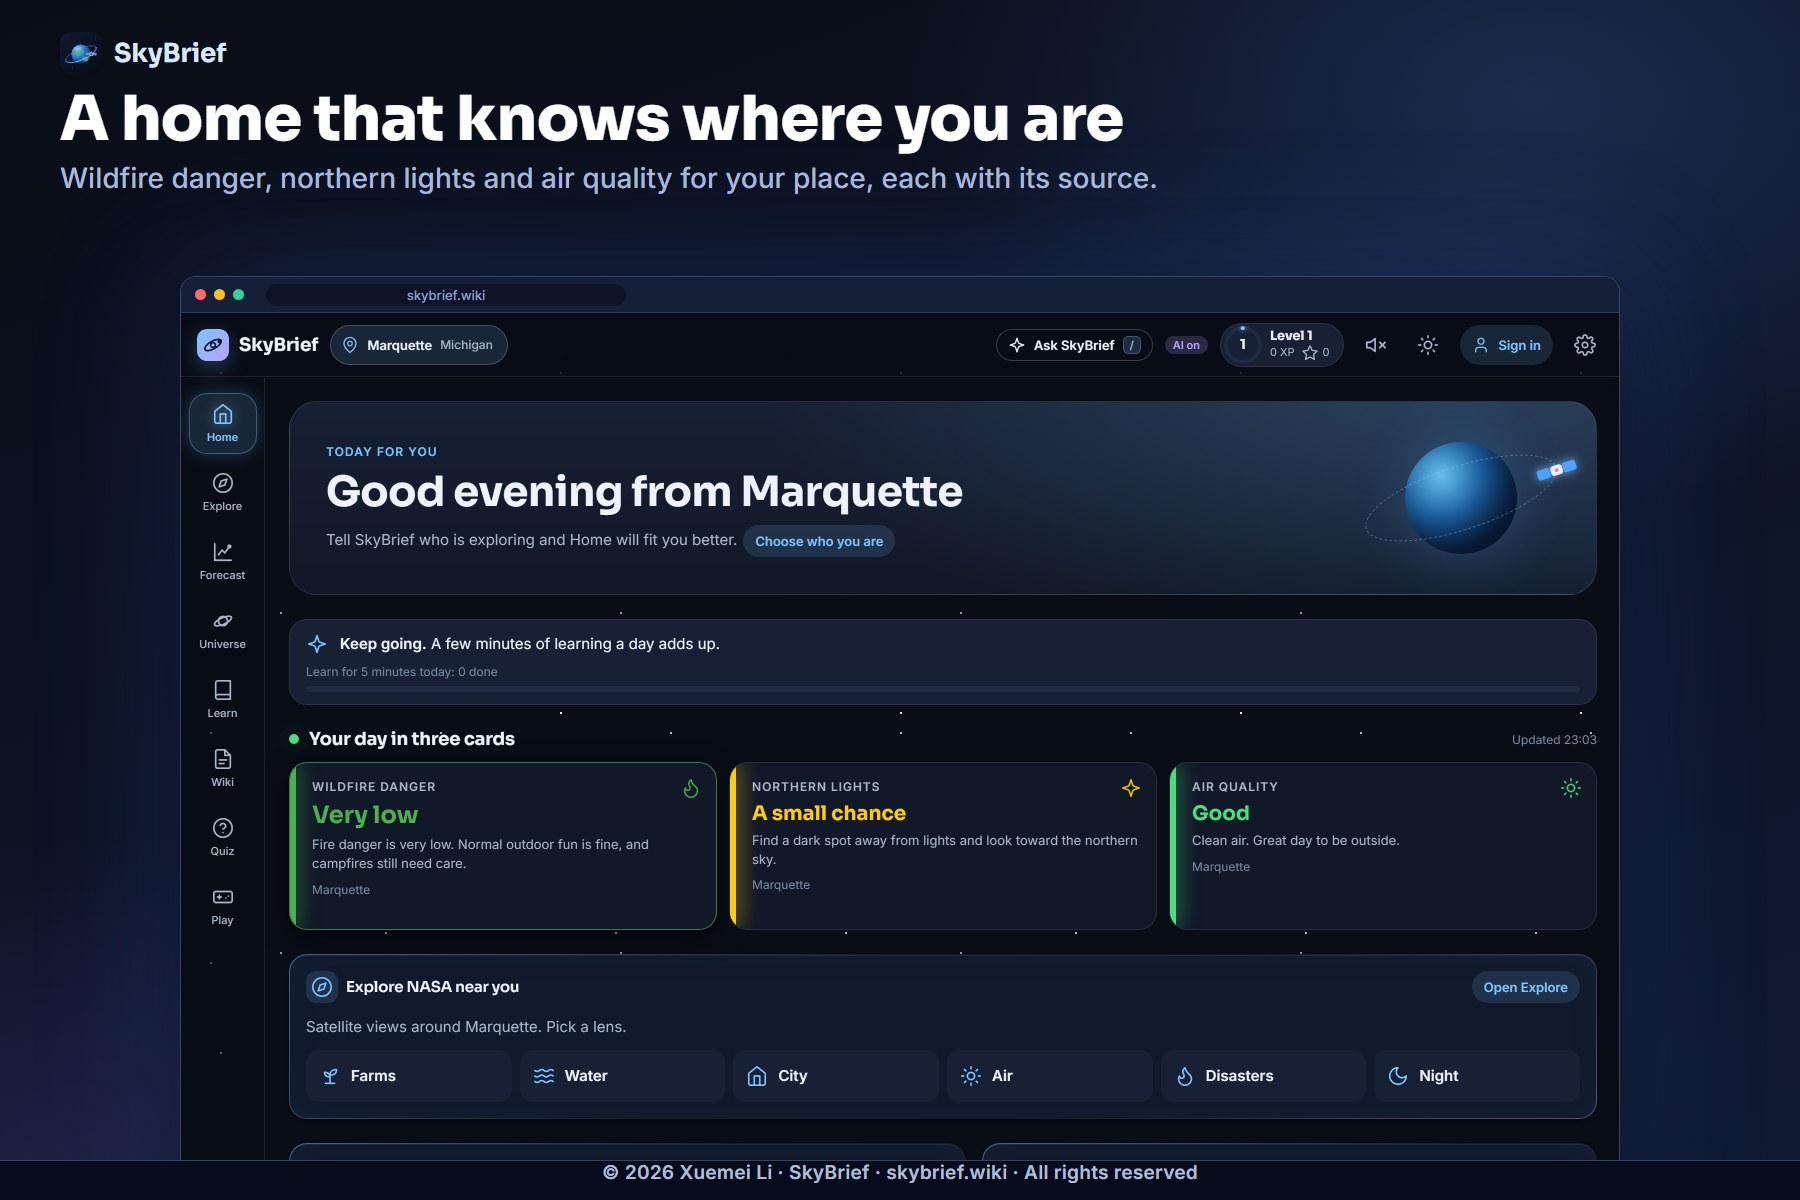
- Open data needs an expert to read it. SkyBrief gives one plain answer first, with details one tap away.
- Apps show a generic or wrong-place verdict. SkyBrief resolves your place to a region profile, and says "Not covered here yet" instead of guessing.
- Teachers lack ready, local activities. SkyBrief builds a ten-minute lesson from today's real numbers, with a printable handout.
- Town staff cannot cite a dashboard. SkyBrief writes a one-page community brief with sources, data age and caveats.
- AI chatbots answer without looking at what you see. SkyBrief's assistant reads the visible page and shows its sources to avoid AI hallucination.
- Kids' apps collect kids' data. SkyBrief has no student accounts, no ads and no tracking cookies, and uses nicknames only.
What it does: three doors, one engine
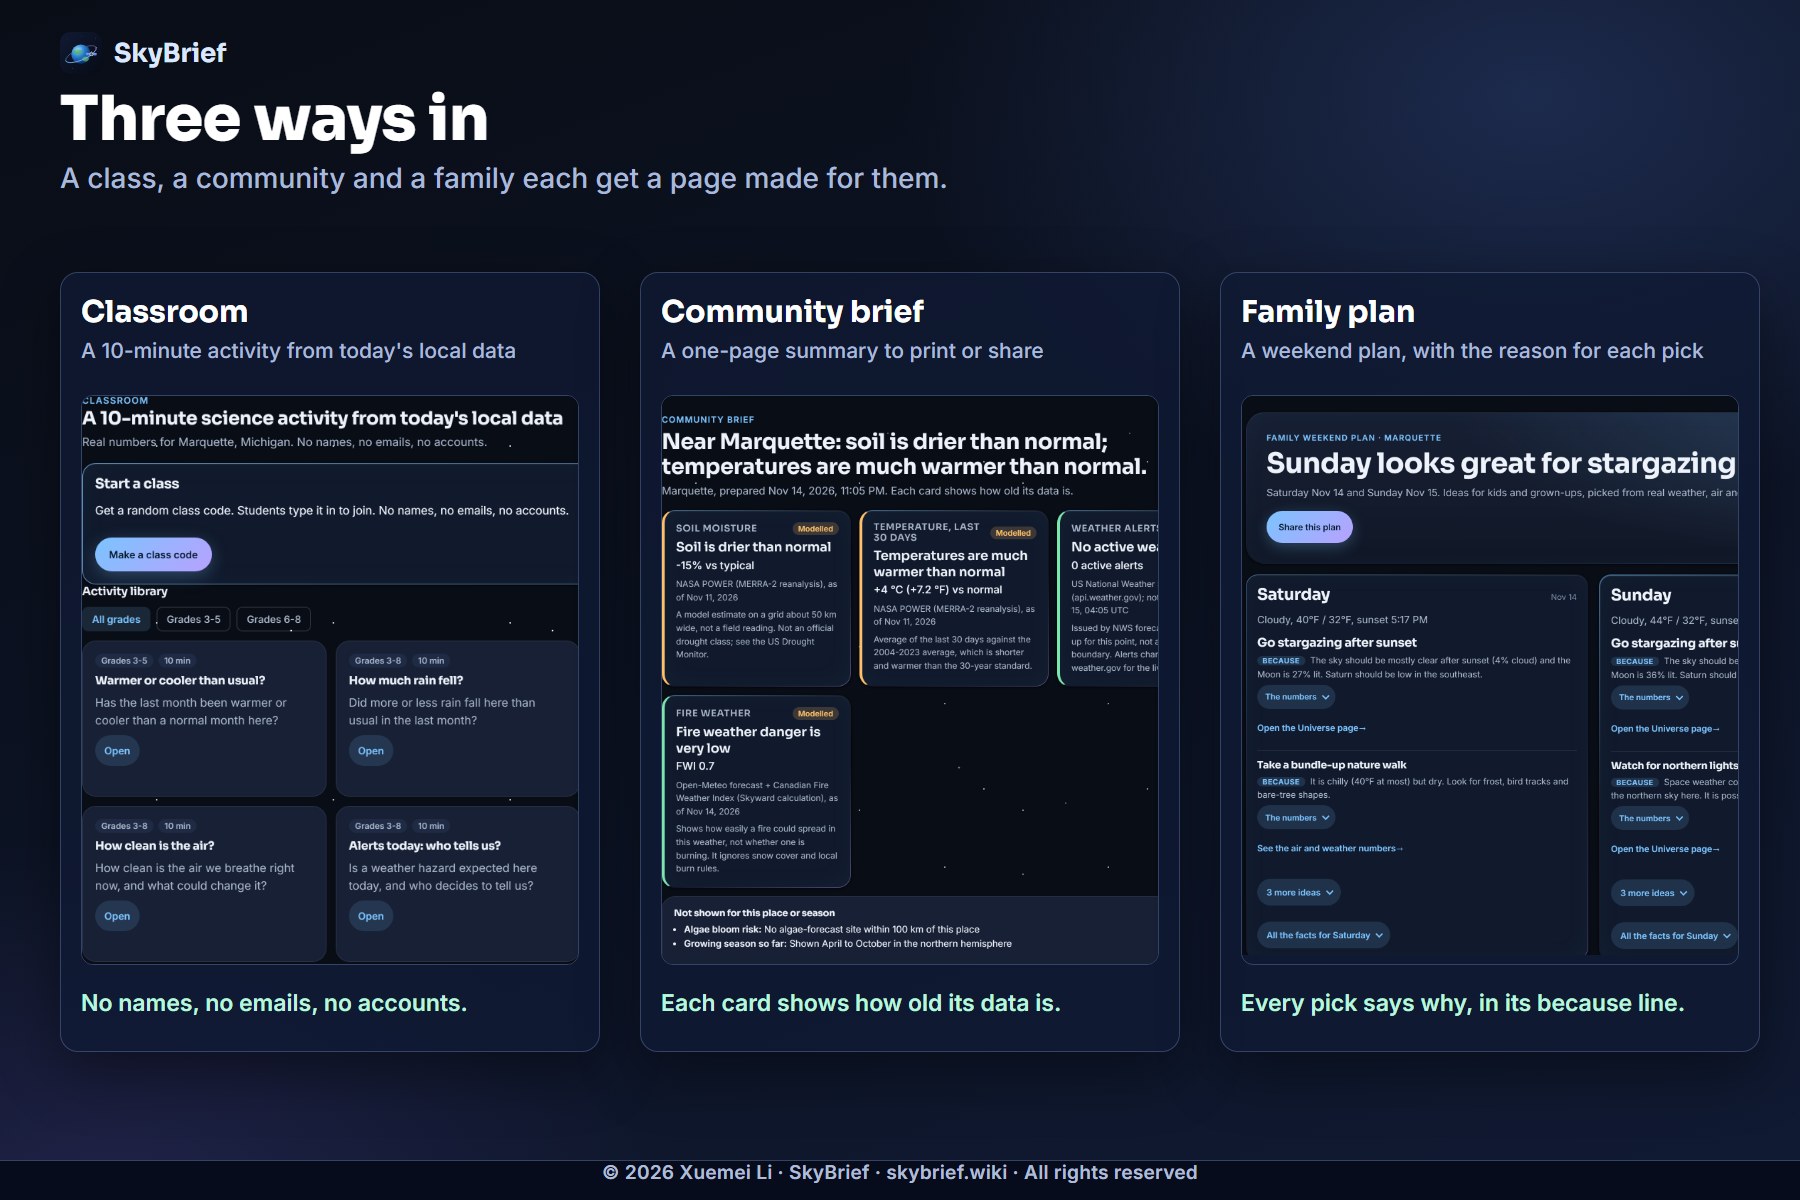
- Classroom. Anonymous class codes, ten-minute activities, suggested standards tags and a worksheet. No student names, ever.
- Community brief. A citable "what is happening near us" page for towns and libraries. Print it or embed it on a website.
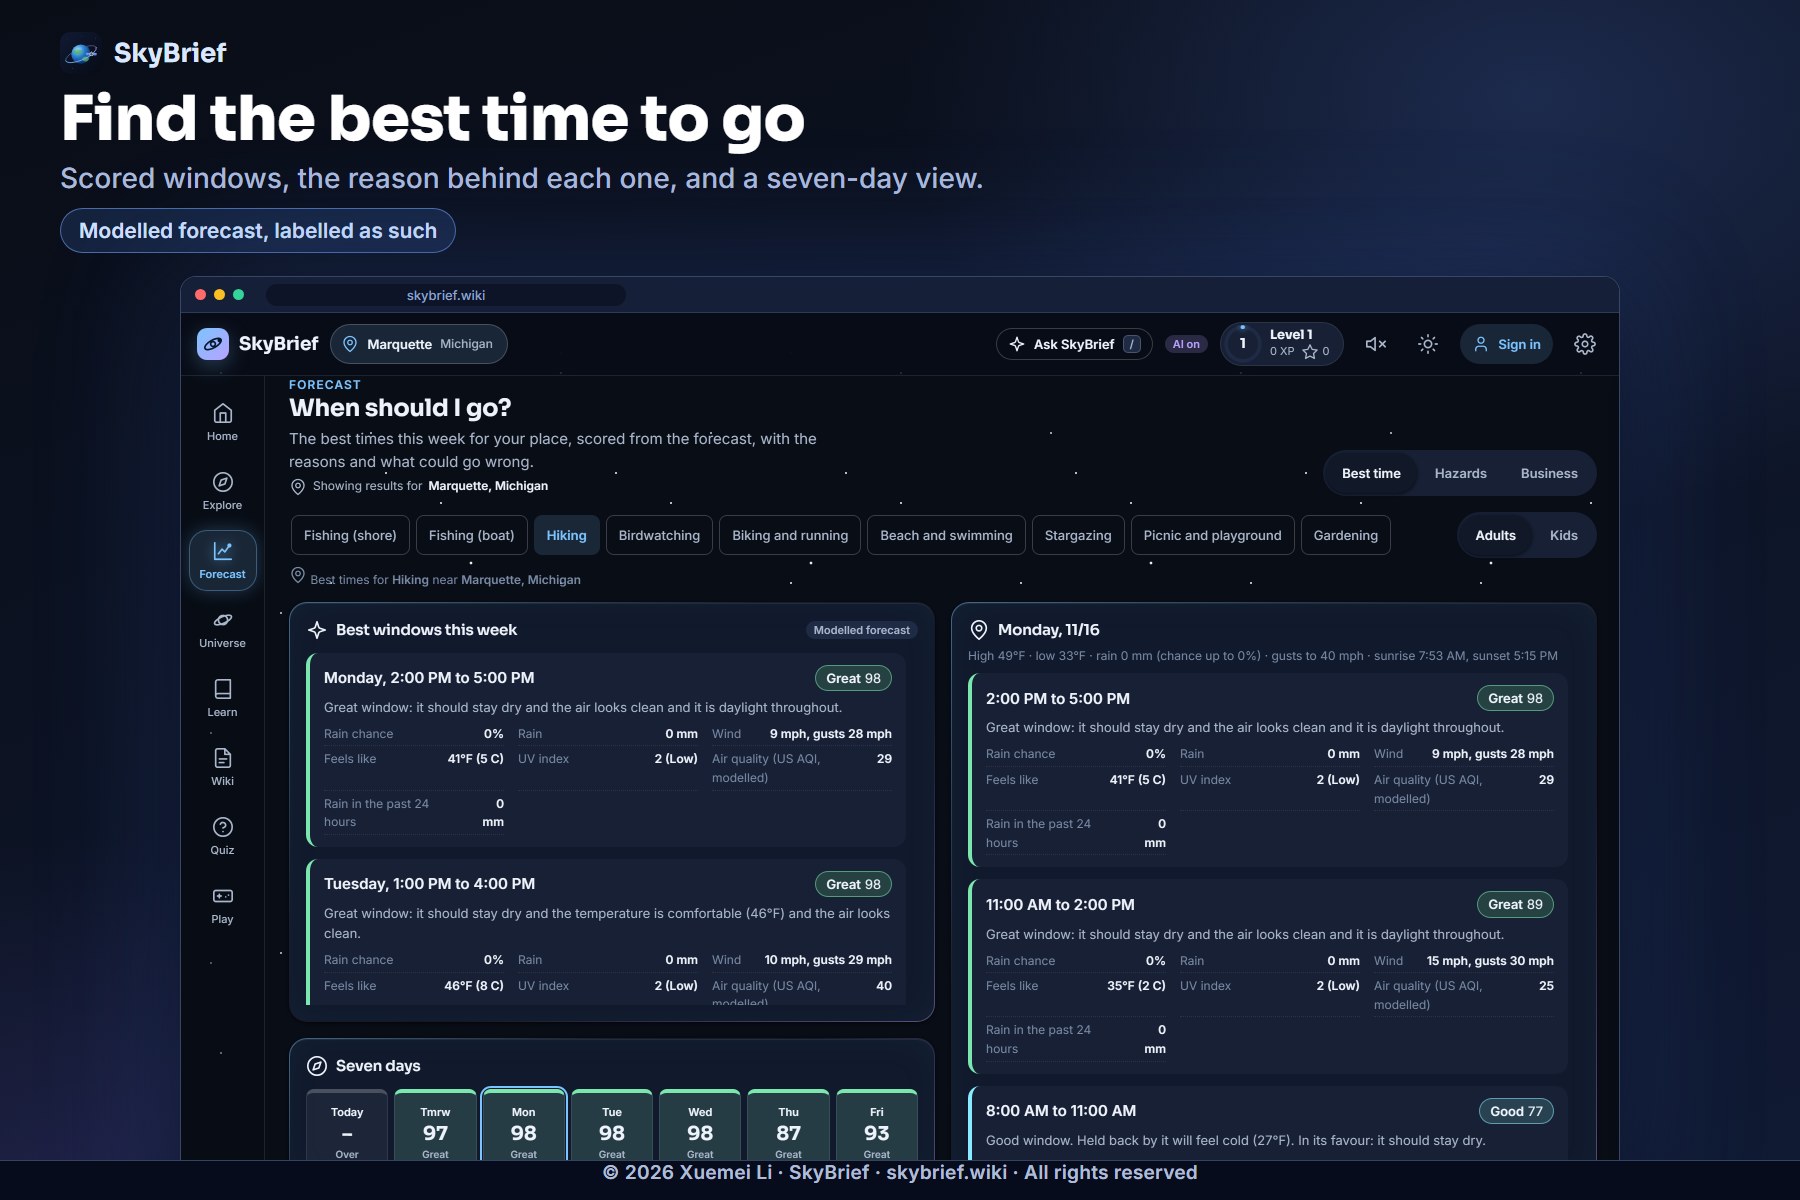
- Family plan. A weekend forecast that ranks activities with a visible because ("calm wind, good air"), plus the best time windows for fishing, hiking, birdwatching and stargazing.
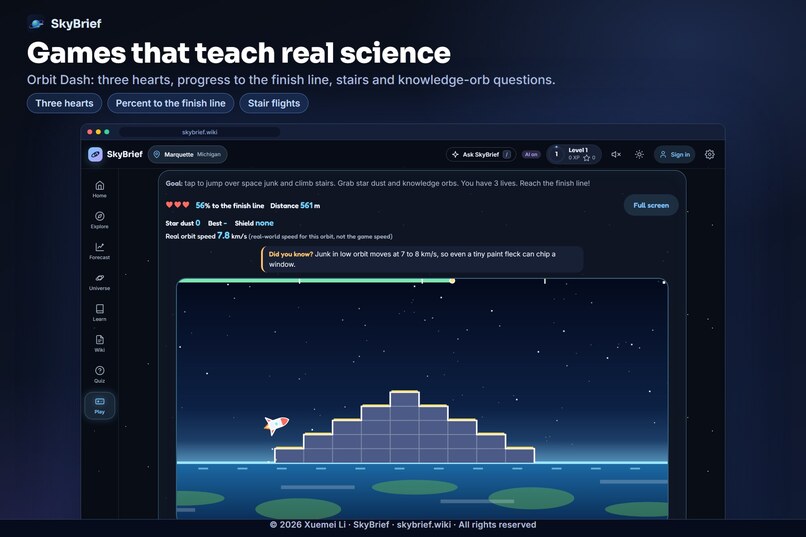
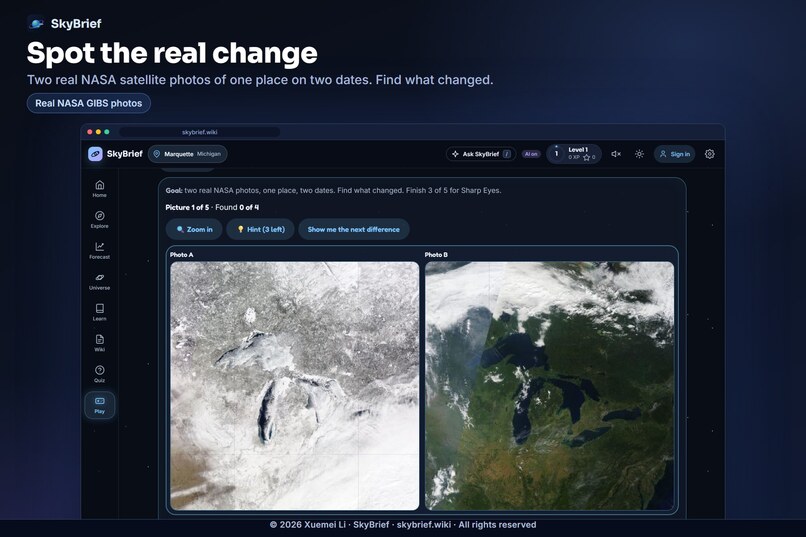
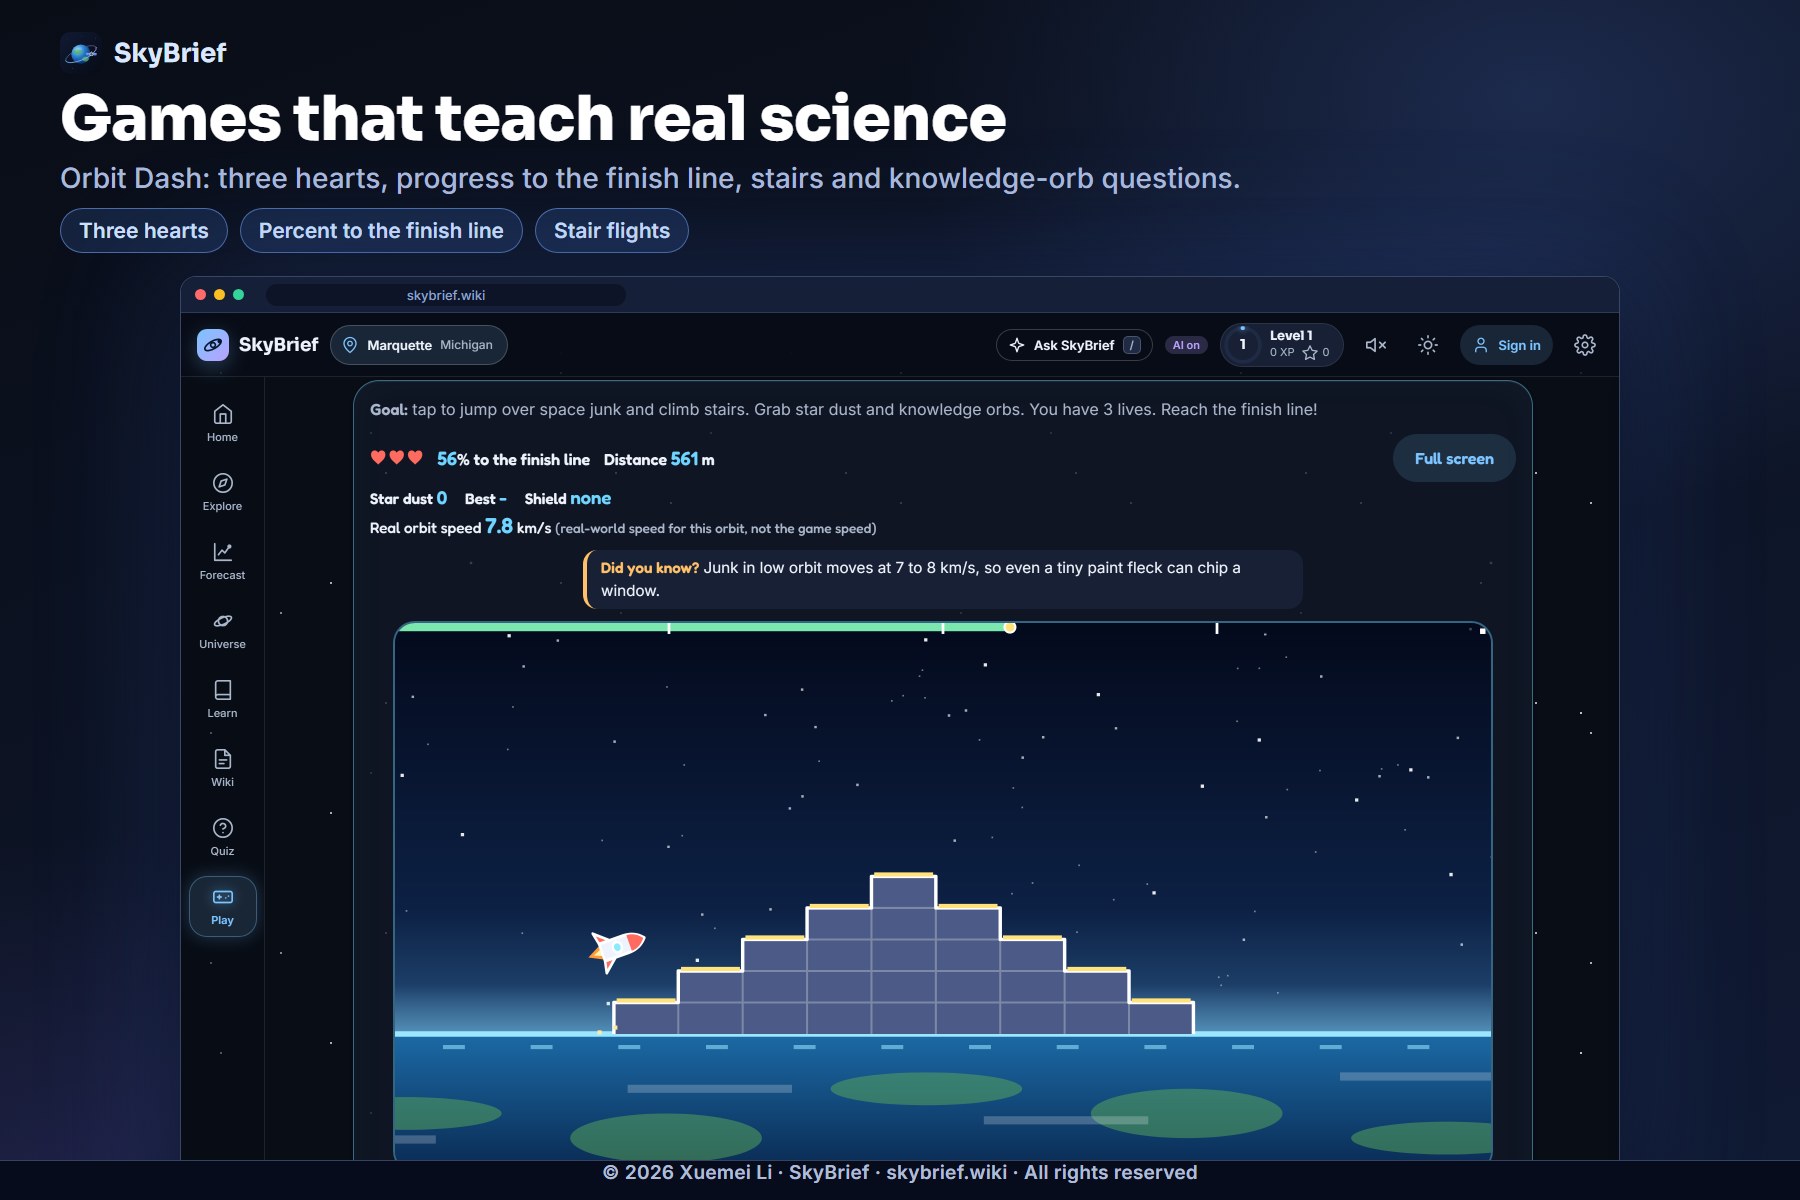
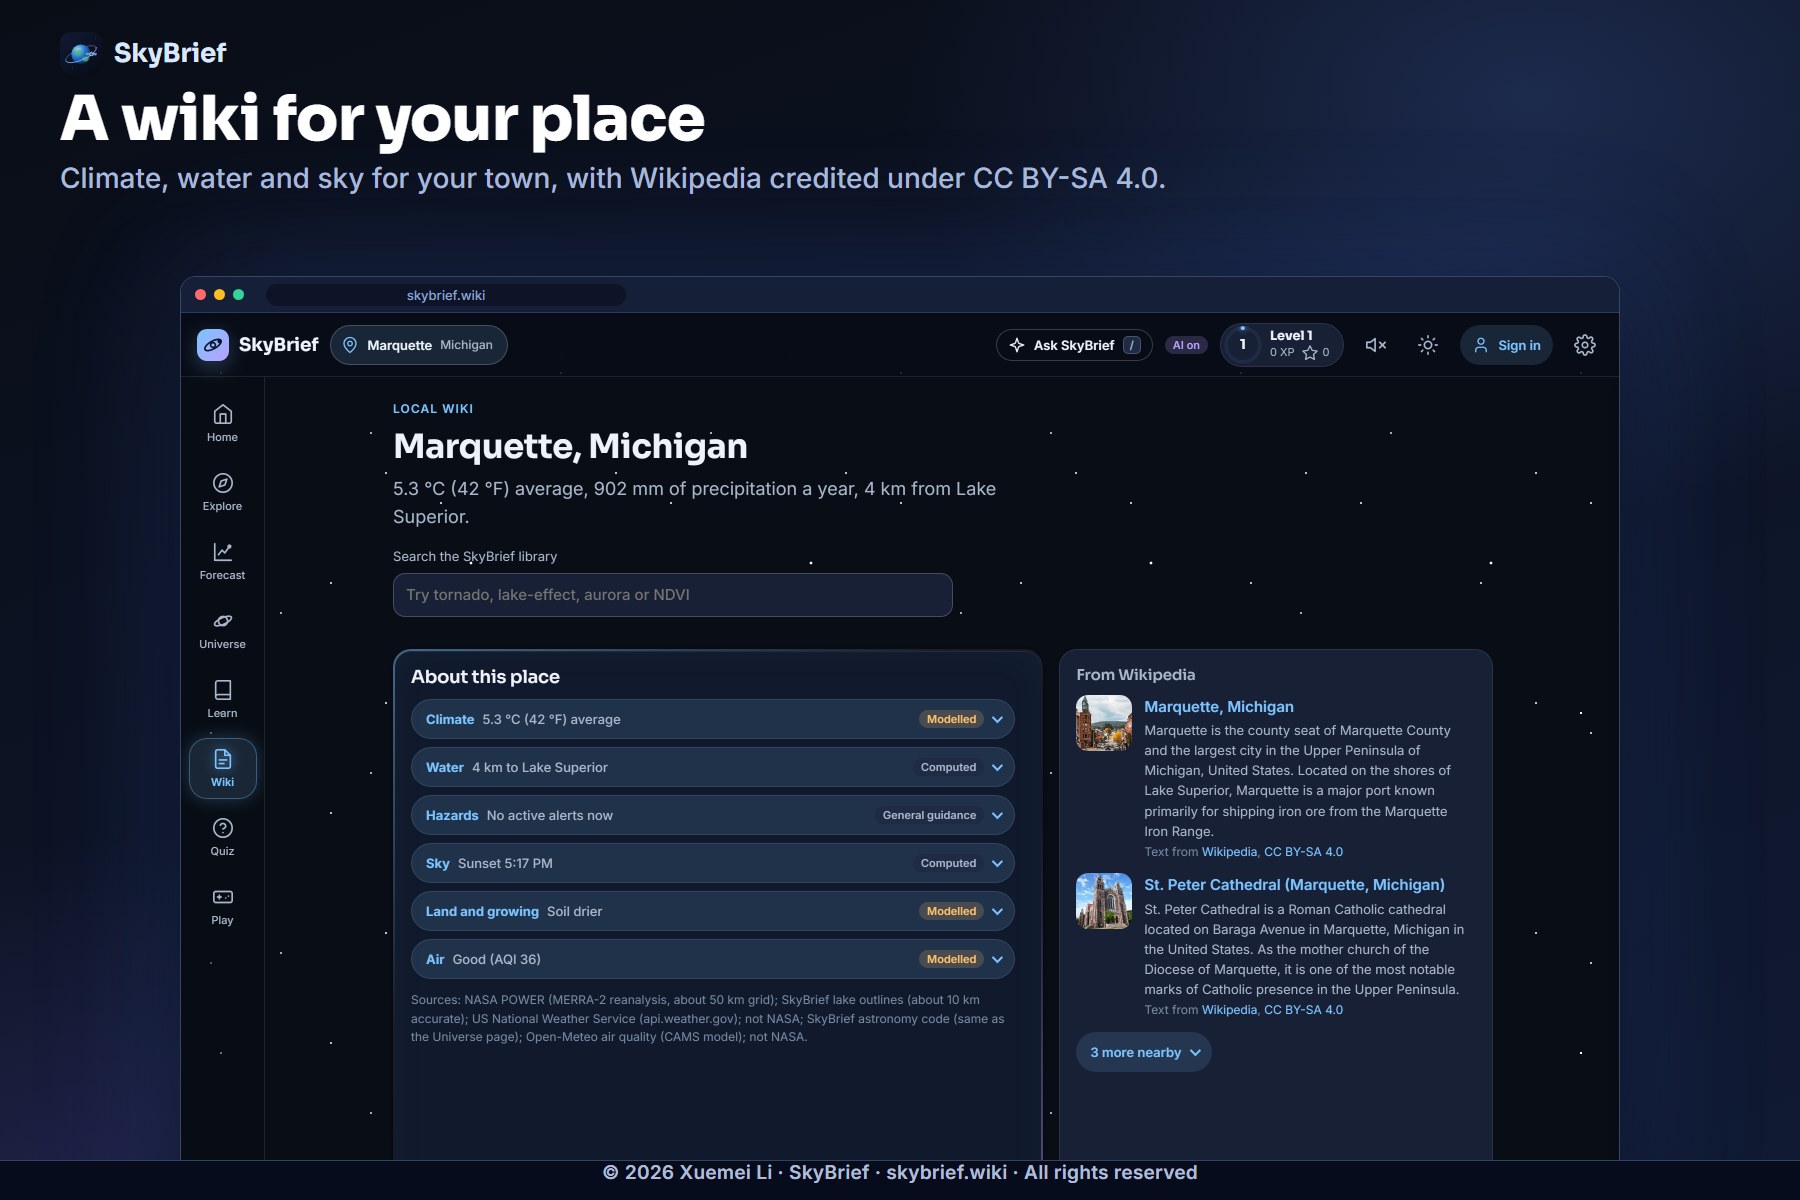
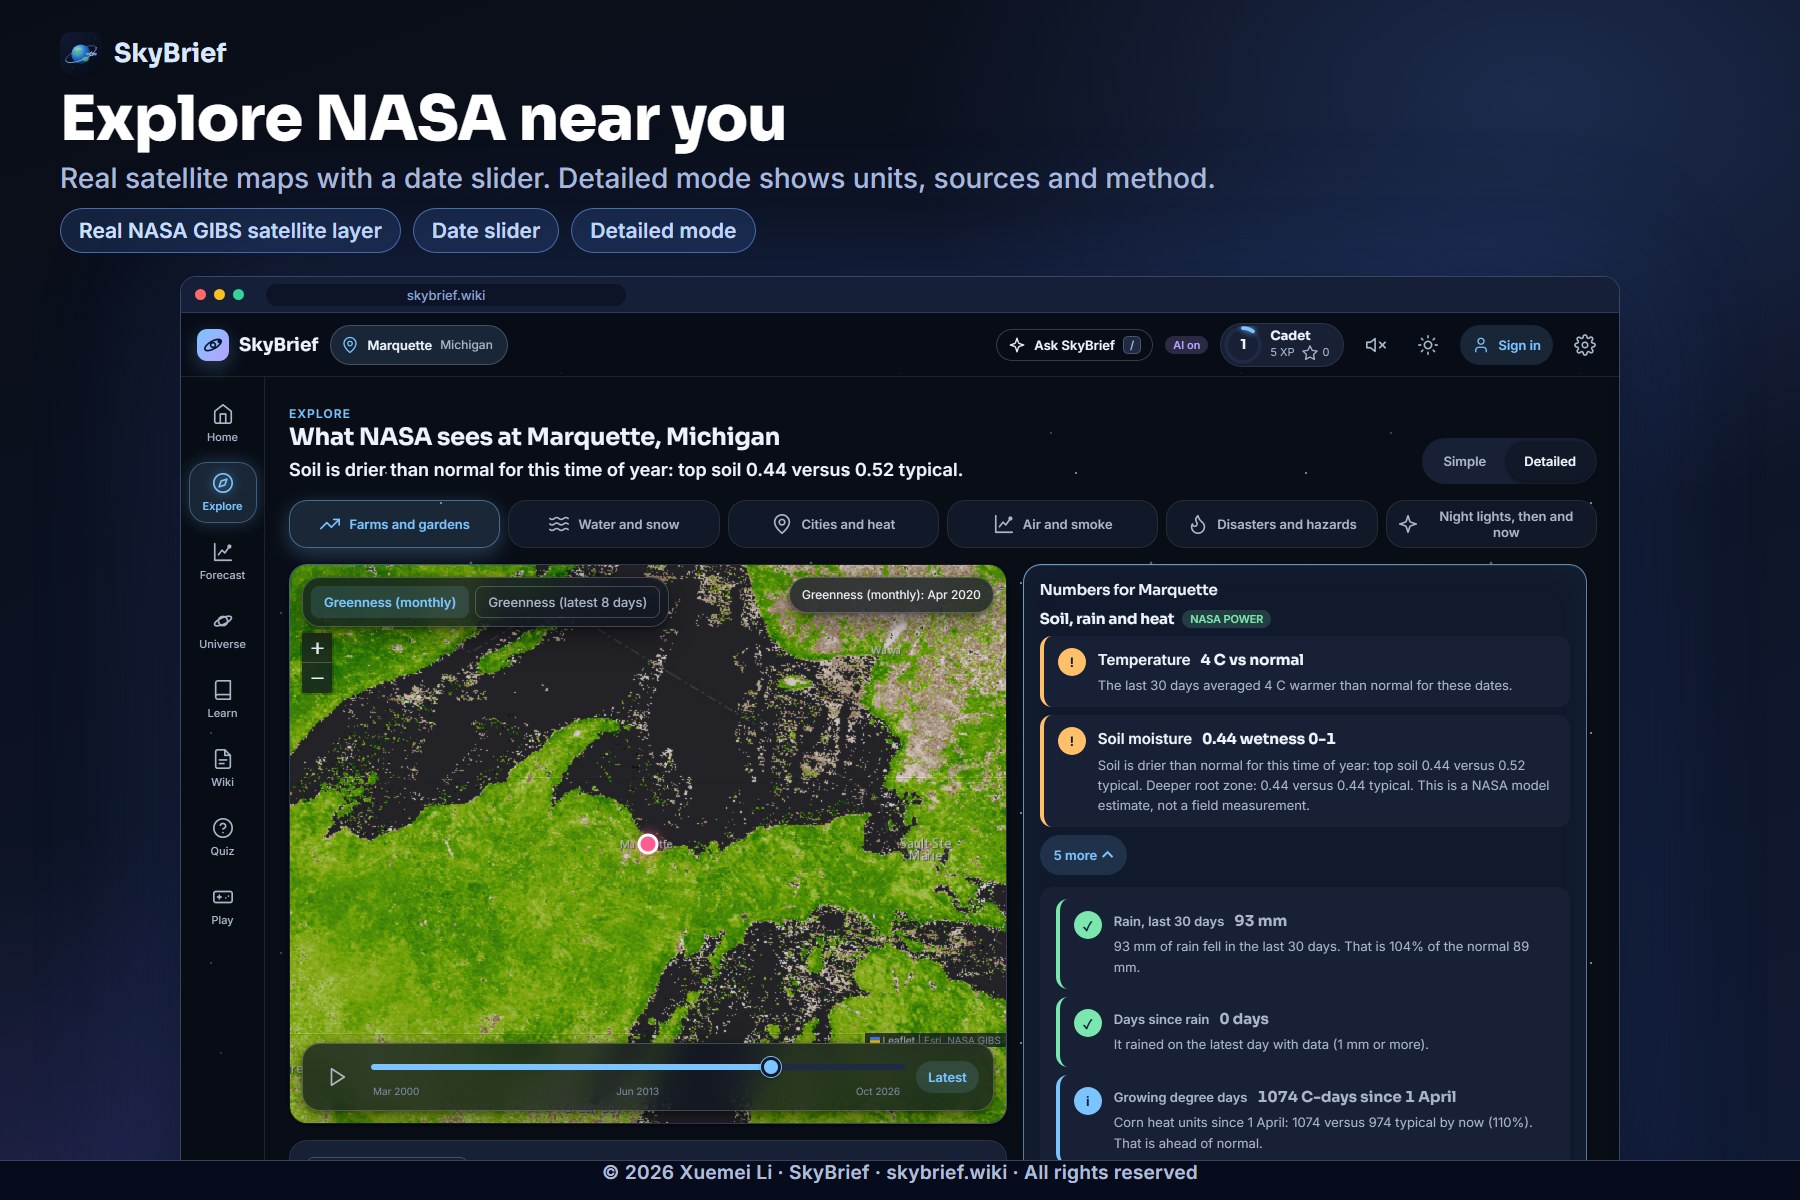
Around them: Explore (satellite layers with a time slider), Forecast, Universe (tonight's sky from real orbits, plus a phone compass that points at a planet), Learn, a local Wiki, a Quiz, and six kid-safe games. In Orbit Dash, real orbit facts are part of the gameplay, and the server replays every run to verify the score.
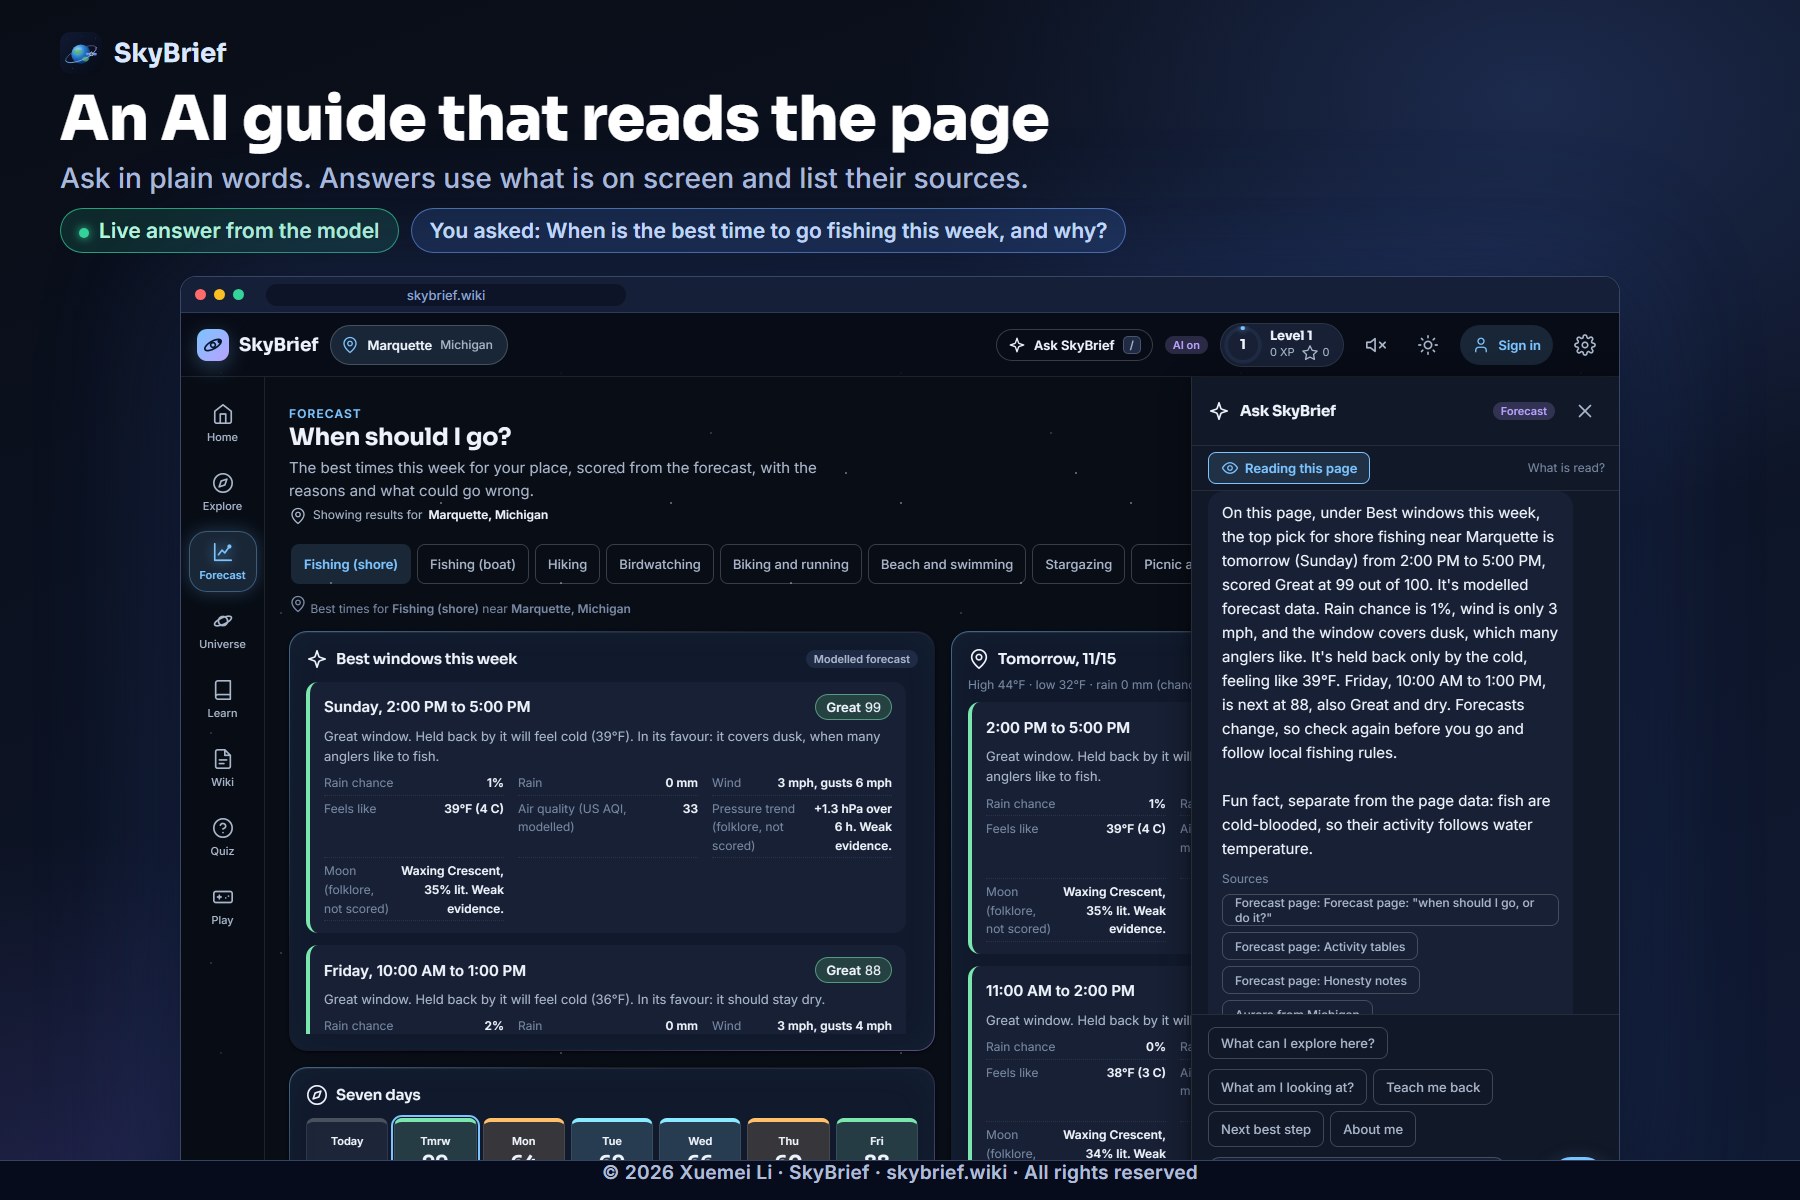
And an AI guide that reads your screen. Ask "what am I looking at?" and it answers from what is really on the page, with sources you can check.
Built to be trusted
Every number is labelled measured (a satellite or agency observation) or modelled (a computer estimate). My models are experimental heuristics, and the app says so on screen. It is not a warning system, so follow weather.gov and local authorities. That honesty is what makes the rest worth using.
How I built it
- Backend. A Node 22 server with one dependency (the MongoDB driver). It has a route registry, a TTL cache with in-flight de-duplication, token-bucket rate limits and a worker-thread pool.
- Frontend. A vanilla ES-module single-page app with Leaflet and NASA GIBS tiles, designed phone-first and keyboard-friendly.
- Algorithms I wrote myself:
- Canadian Fire Weather Index for wildfire danger.
- Monte Carlo ensemble for algae outlooks, reporting the 10th, 50th and 90th percentiles.
- Seasonal outlooks by ordinary least squares with leave-one-out checks.
- Kepler's equation by Newton-Raphson for orbits, and the World Magnetic Model, checked against NOAA's official test values, for the compass guide.
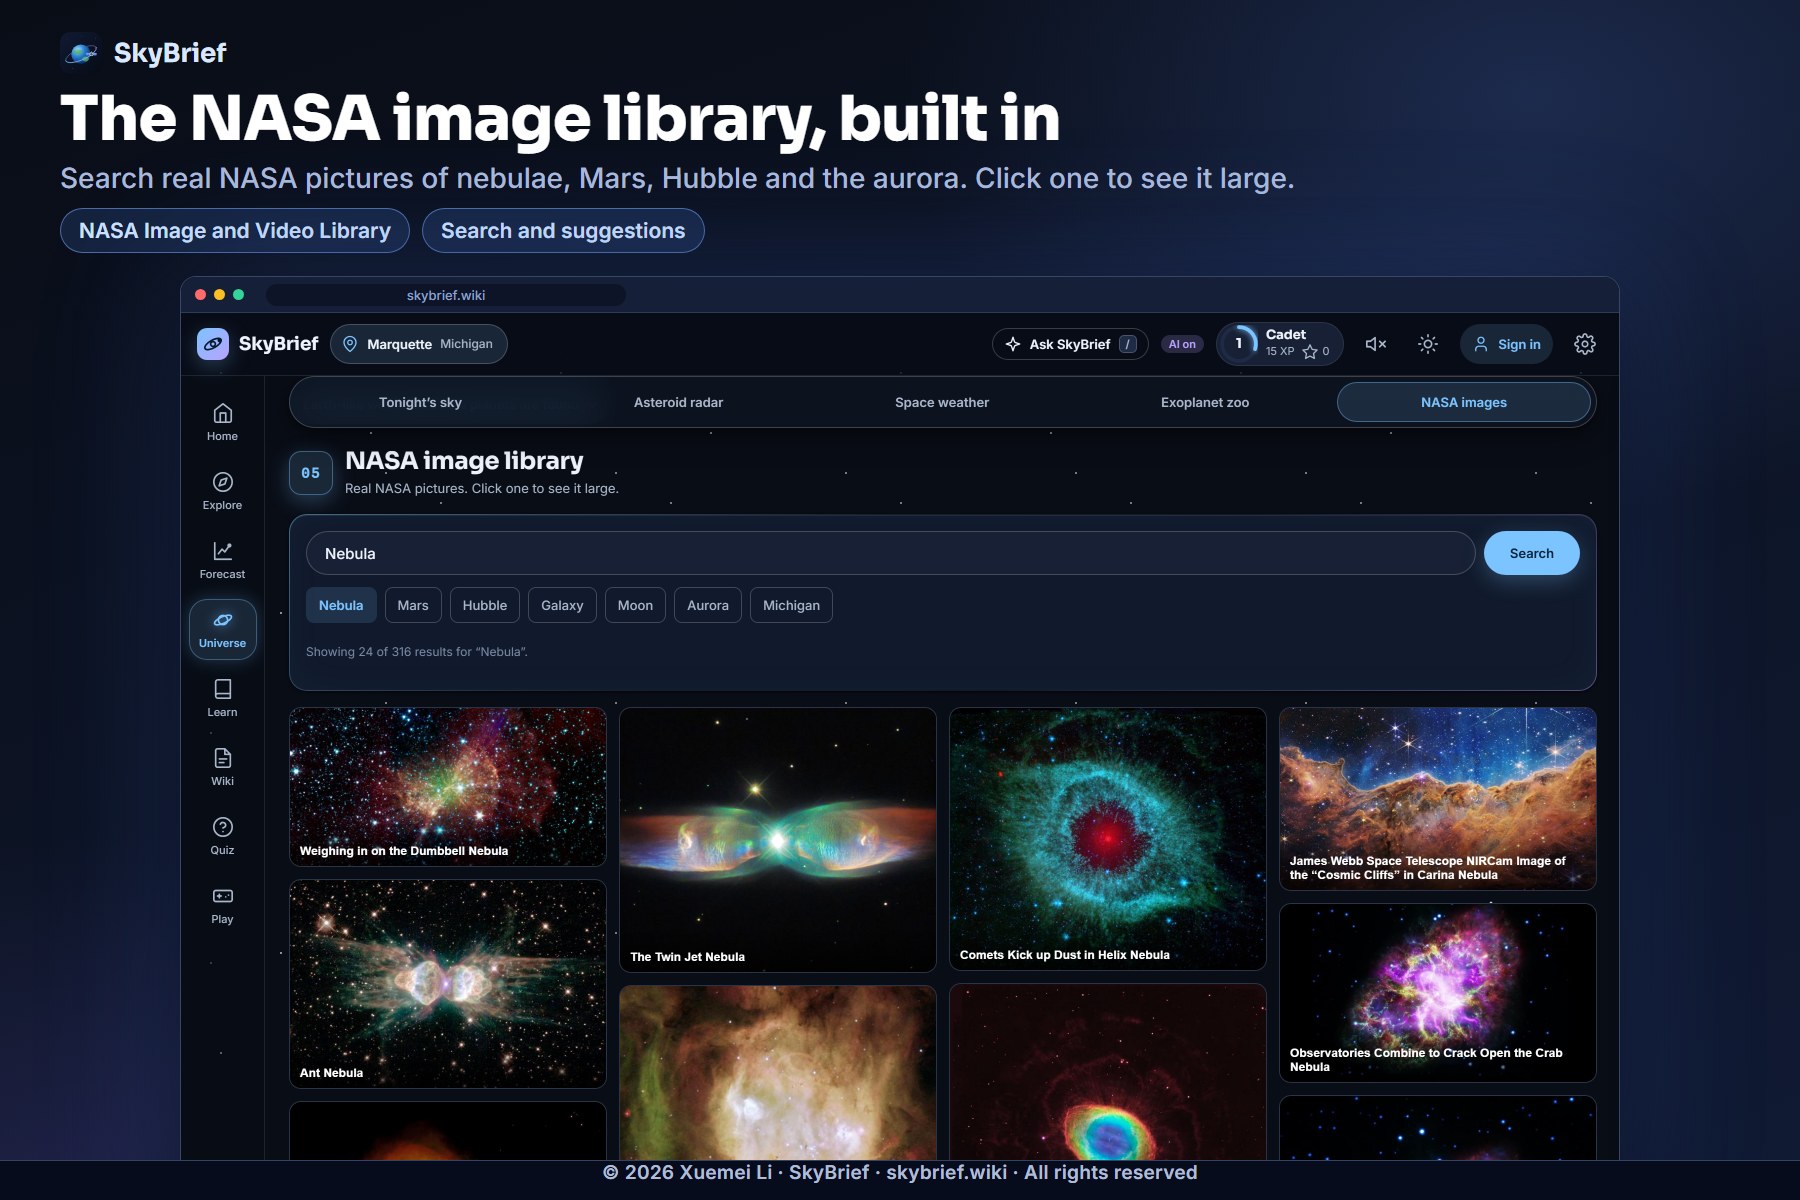
- A relevance re-ranker that filters out misleading NASA image-library hits.
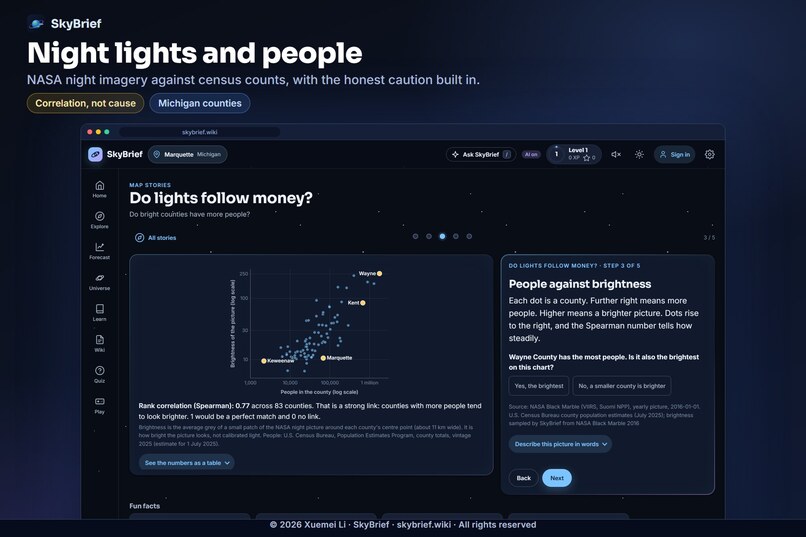
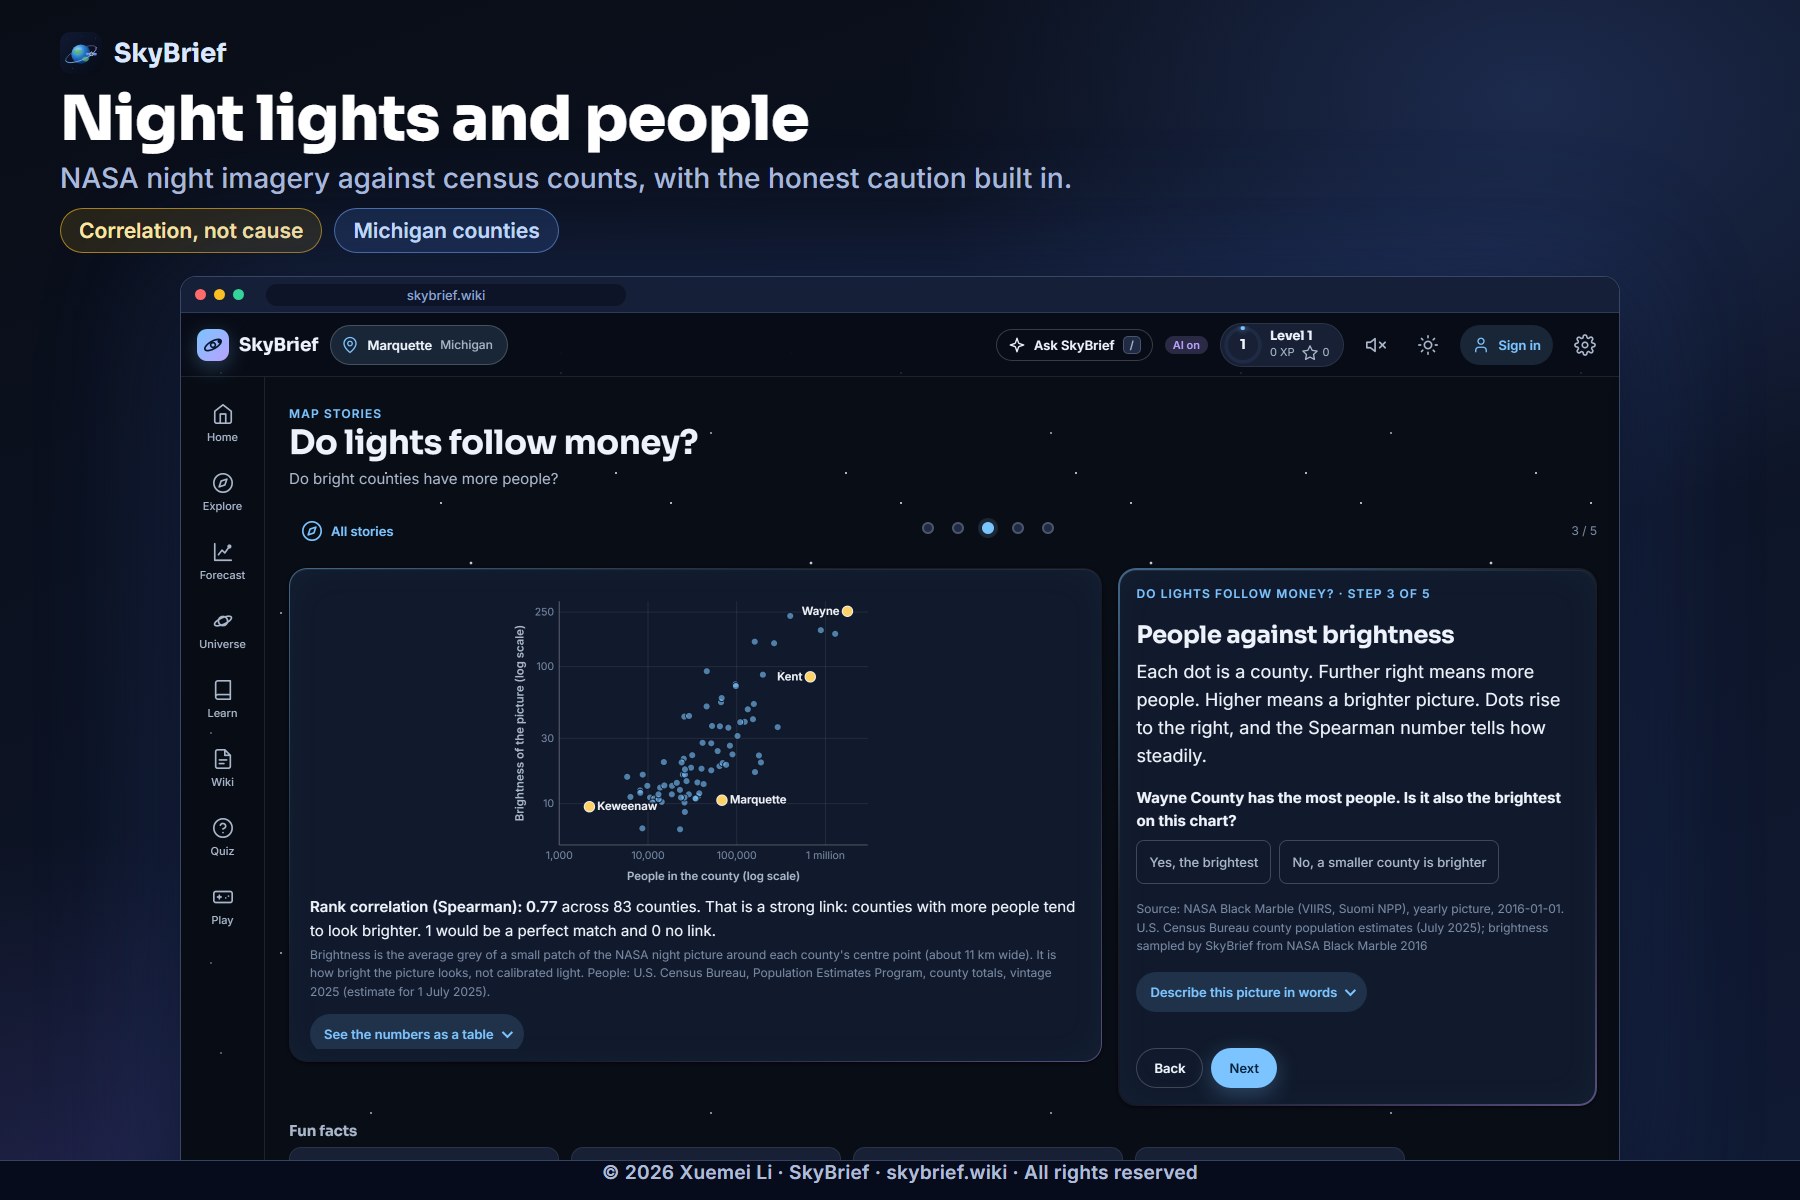
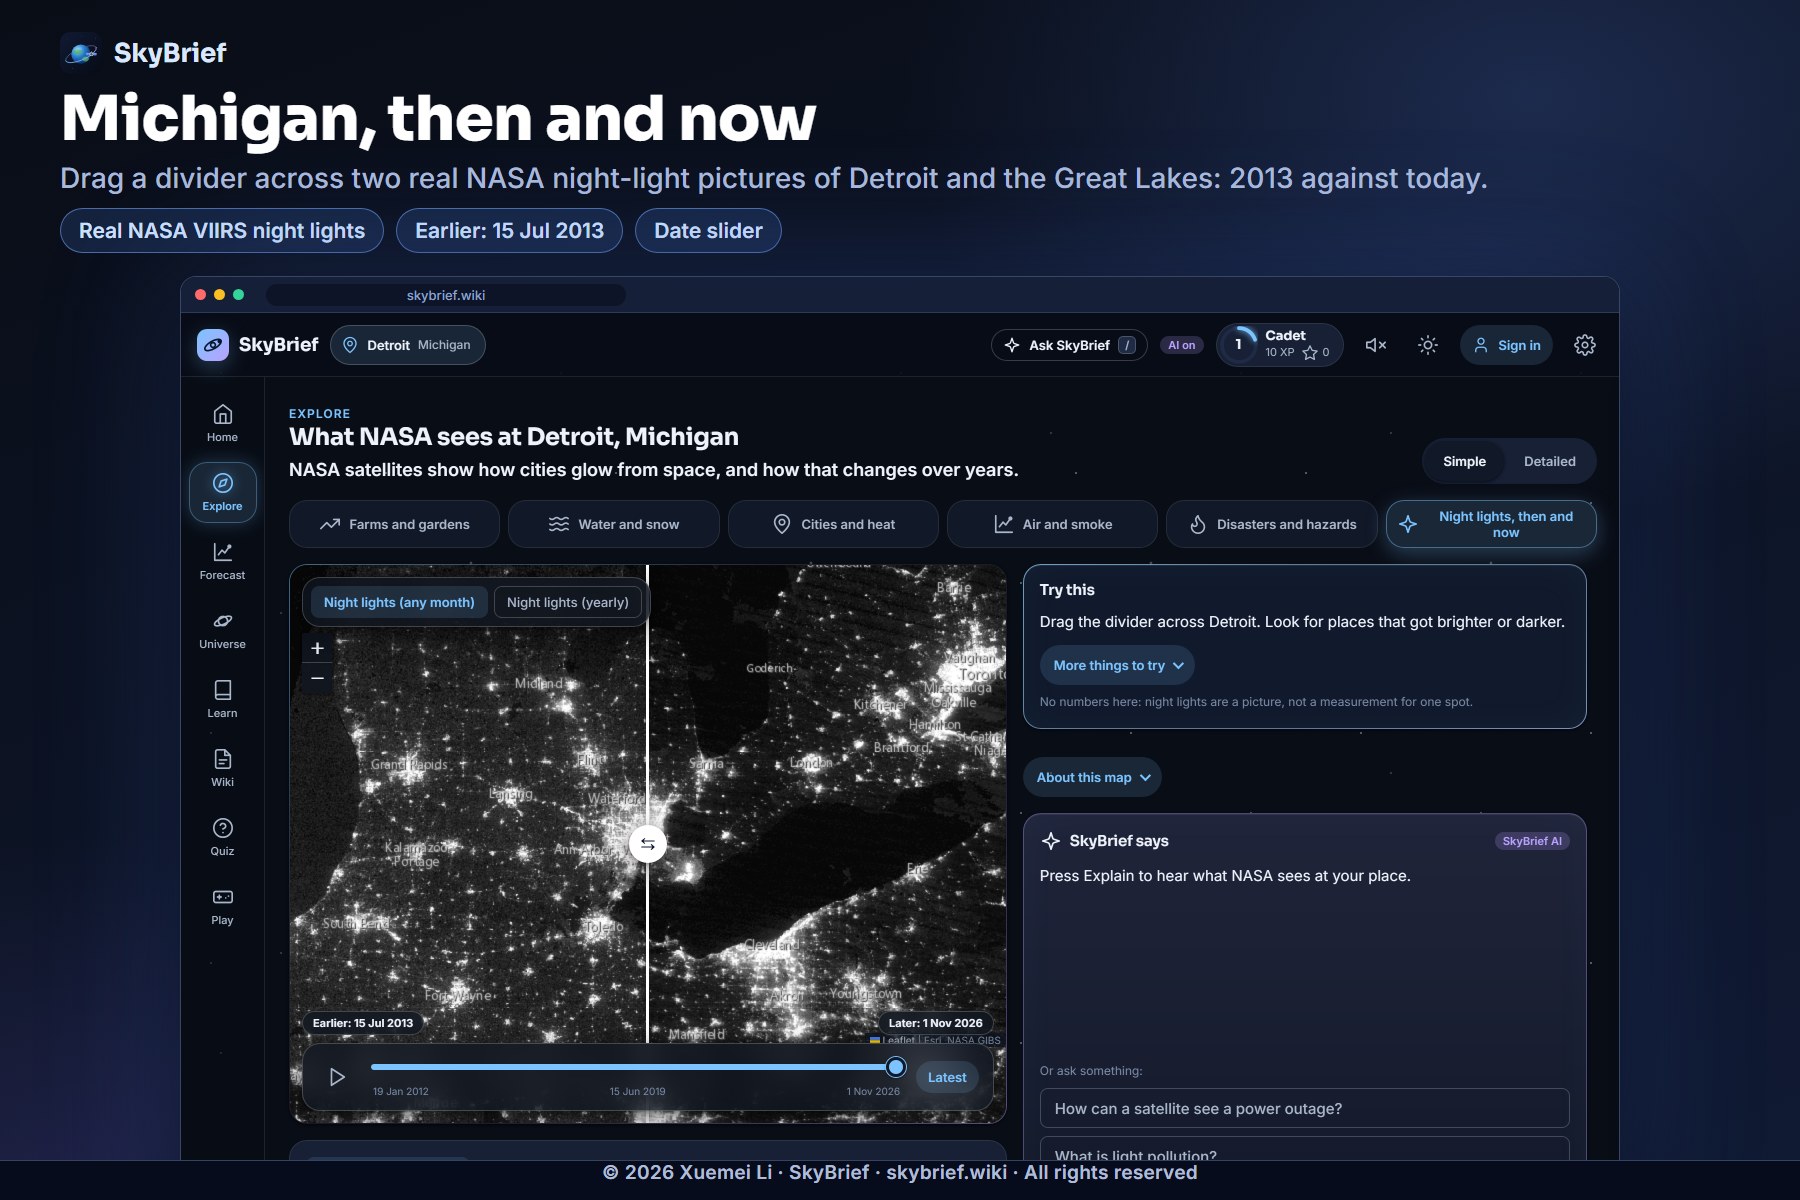
- Night lights versus county population: rank correlation \( \rho = 0.77 \) across Michigan's 83 counties (correlation, not cause).
- Screen-reading RAG. The browser snapshots the visible page and charts describe themselves. The server ranks knowledge chunks with BM25 (\( k_1 = 1.2,\ b = 0.75 \)), and a budget manager packs about 6,000 tokens of tagged context (about 55% from the screen, 25% from my knowledge base). Answers cite where they came from, and an administrator can switch the model between Claude and Gemini.
- Production, live today at skybrief.wiki. AWS Lightsail behind a Cloudflare tunnel, MongoDB Atlas, and GitHub Actions. A release deploys itself: backup first, boot on a spare port, swap in, and roll back automatically if the health check fails.
- Tested. Over 900 unit tests and about 1,450 browser tests (Playwright, desktop and phone), plus a security review whose must-fix findings were fixed.
Challenges I beat
- Making an AI answer from the screen, and proving it. A chatbot that guesses is easy; one that reads the page is not. I built a screen-reading RAG pipeline from scratch. The browser turns the visible page and each chart into tagged text chunks. The server ranks them with BM25 (\( k_1 = 1.2,\ b = 0.75 \)) against 246 knowledge chunks, then packs a 6,000-token prompt (about 55% screen, 25% knowledge). Every chunk keeps its tag, so each source in an answer traces back to a chunk, and an inspection page shows every score and token count.
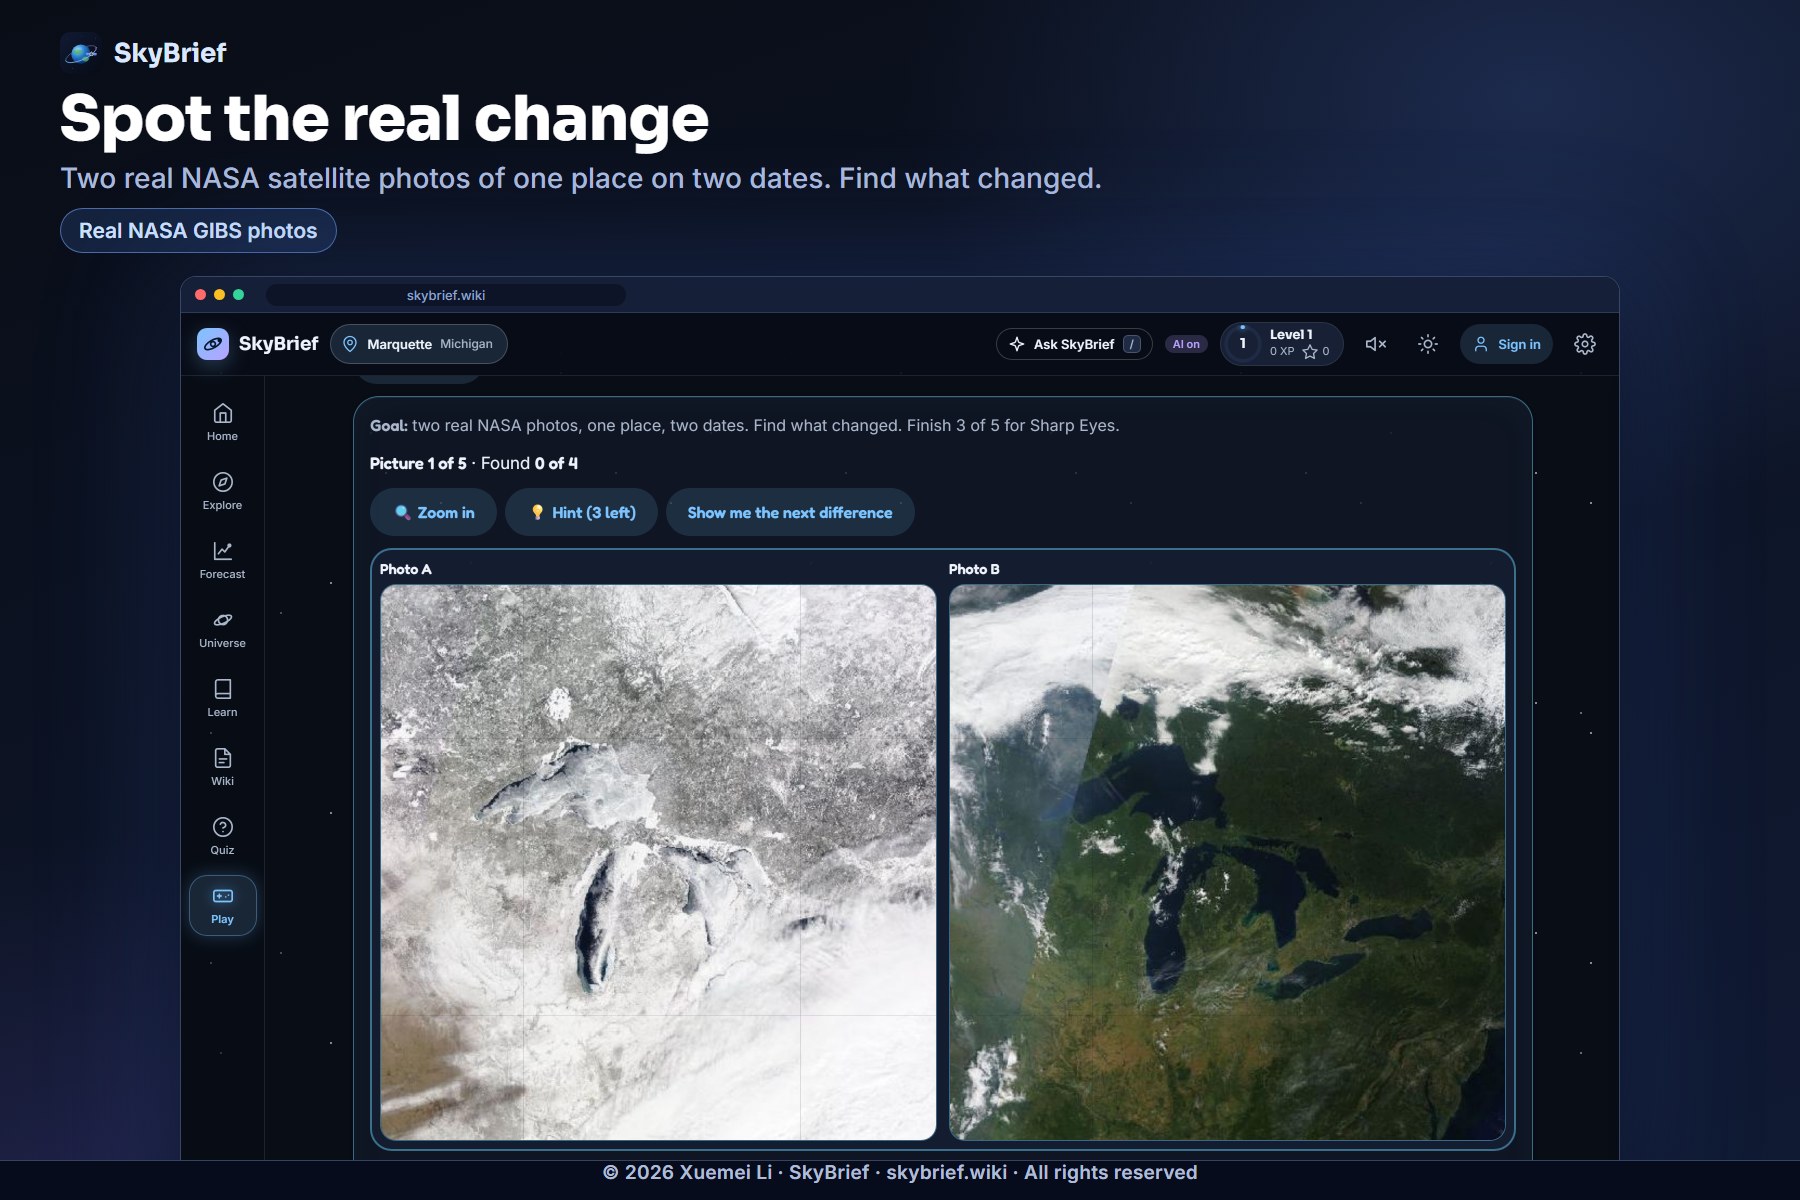
- Fusing different data into one prediction. NASA data (GIBS imagery, POWER climate, NeoWs asteroids, DONKI space weather, the Exoplanet Archive) meets weather, air quality, rivers, alerts and wildlife sightings from other agencies. Each source has its own format, freshness and failure modes, so I built a cache with in-flight de-duplication and last-good-copy fallback. Every number is labelled measured or modelled, with its source.
- Algorithms I developed, and the insights they unlock. I wrote the Canadian Fire Weather Index, a Monte Carlo algae-bloom ensemble (10th, 50th and 90th percentiles), seasonal outlooks by least squares with leave-one-out checks, and best-time windows with a visible "because". One unique insight: night lights track county population across Michigan's 83 counties at \( \rho = 0.77 \), shown as correlation, not cause.
- Reporting a weak result honestly. I tested the algae ensemble against nine years of NOAA bloom severity. It scored a Spearman of only 0.30, while spring river flow alone scored 0.72. I published both numbers, labelled the model experimental, and kept it away from any safety claim.
- A wrong verdict is worse than no verdict. An early version showed a California fire verdict for Honolulu. I replaced "nearest region" matching with inside-or-nothing coverage rules and explicit "not covered here yet" states.
- One app for desktop and phone. The layout is phone-first, with large touch targets and full keyboard support. On a phone, location services find your place, and the device compass drives a stargazer guide that points you at a planet. It uses the World Magnetic Model, checked against NOAA's official test values, to correct magnetic north.
- A classroom toolkit with no student data. Anonymous class codes, ten-minute activities from today's real local numbers, printable worksheets and handouts, interactive labs such as the Tornado Lab, quizzes, a glossary, and an assistant that answers while students learn. The classroom endpoint accepts only three fields (code, activity, event) and rejects anything else; tests search the saved data for names and addresses.
- Cheat-proof games. Orbit Dash is a deterministic, versioned simulation. A seeded generator builds the course, and the server replays every submitted run from its seed and inputs before it accepts the score. A forged score fails the replay.
- Shipping to production without losing data. Test servers once wrote to the live database, and a restart wiped test accounts. I fixed the cause: test servers now ignore production credentials, a start-up guard refuses to run the public site on an in-memory database, every deploy takes a backup first, and a failed health check rolls back automatically.
- Security with almost no dependencies. Google sign-in verifies ID tokens against Google's published signing keys using only Node's
crypto. Passwords use scrypt, session tokens are stored hashed, the server enforces a strict Content-Security-Policy with no inline scripts, and requests are rate-limited per client and globally.
What I learned
- Trust is an engineering problem, not a disclaimer. The most useful feature I built is the one that says "Not covered here yet." A wrong answer for Honolulu cost more trust than a thousand correct ones earned, so I made honesty structural: inside-or-nothing coverage rules, a measured-or-modelled label on every number, and a published weak score (0.30) for my own algae model.
- Grounding beats a bigger model. A model that sees the real page, plus a ranked, tagged, budgeted slice of verified knowledge, gives answers you can check. Retrieval quality and prompt budgeting mattered more than anything I could say to the model.
- Open data is not usable data. Every feed has its own format, freshness and failure mode. The hard part was not fetching NASA data. It was caching it, labelling it, falling back to the last good copy, and saying how old it is.
- Production teaches what tests can't. My own test servers wrote to the live database. A sign-out button silently failed because a request had no JSON body. One CSS class name collided with another and tinted a background. Each failure became a permanent guard: a test, a start-up check, or a rule that cannot be skipped.
- Never trust the client. From the game score to the classroom endpoint, anything a browser sends is a claim, not a fact. Replaying a run on the server, and accepting only the three fields I need, turned a trusting app into one I can defend.
- Plain language is harder than accuracy, and the two must be designed together. If a ten-year-old and a town clerk can both use a page, every claim on it needs a source, a label and a limit.
- One person can ship production-grade software if the guardrails ship first. Backups before deploys, automatic rollback, a secrets scan in CI and a rule that data is never touched made it safe to move fast, alone.
What's next
I have not yet interviewed teachers, librarians or town staff, so my audiences and business ideas are hypotheses, each with written go and stop rules. Next: ten real interviews, a classroom pilot, teacher review of the lessons and standards tags, and region-aware content for every state beyond the Great Lakes.
Built With
- amazon-web-services
- aws-lightsail
- claude
- cloudflare
- css3
- elevenlabs
- gemini
- github-actions
- godaddy
- google-oauth
- html5
- inaturalist
- javascript
- leaflet.js
- mongodb
- mongodb-atlas
- nasa-apod
- nasa-gibs
- nasa-power
- noaa
- node.js
- open-meteo
- playwright
- python
- wikipedia


