-
-
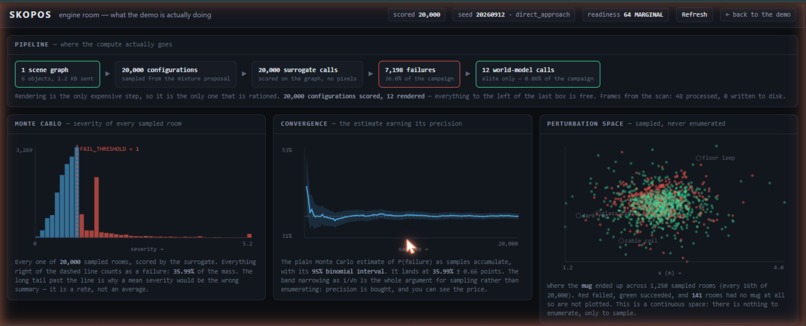
Engine
-
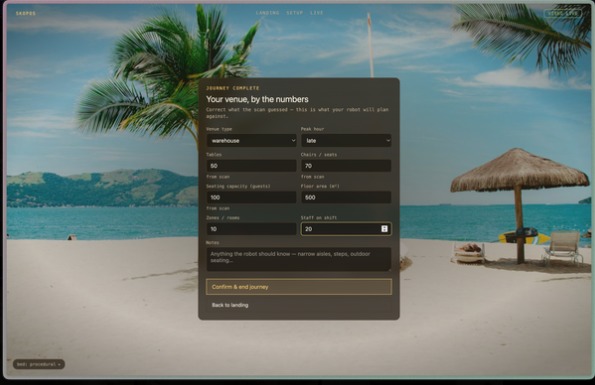
Inventory Menu
-
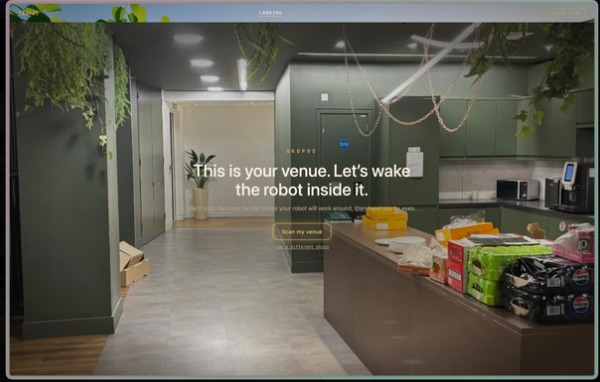
Main Lobby - Paris Gardens
-
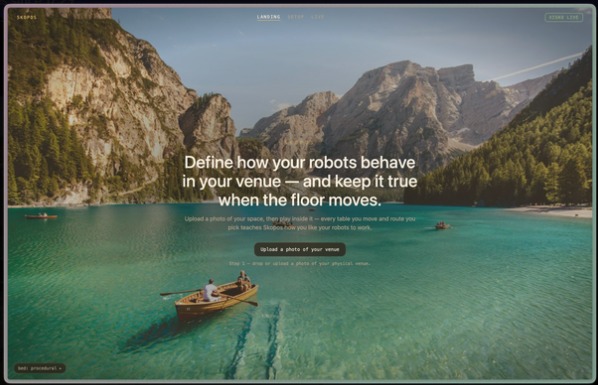
Landing Page - Skopos
Inspiration
We had been working on adversarial stress-testing of autonomous systems under distributional shift - the question of how a policy behaves when the world stops matching the distribution it was trained on. That work lives in simulators for space robotics, where the gap between the modelled environment and the real one is obvious and everybody admits it.
Then we started noticing the same question wearing different clothes.
Every home robot demo is filmed in the room it was trained in. Bright light, clean floor, furniture exactly where the engineers left it. But the robot does not fail in the lab. It fails in the ten-thousandth home, on a Tuesday, in the dark - on a surface its depth sensor cannot resolve, in a room that has been rearranged since the scan.
The industry has two answers to "will this robot work in this environment?" Ship it and find out, which is slow and expensive and discovers the worst failures in production. Or build a metric-accurate digital twin, which needs ground truth, a physics engine, and a rendering budget nobody can justify per household.
Both answers share the same mistake. They treat the scanned environment as the environment. But a scan is one photograph of a space that will have changed by the time the robot arrives. The question is not "does this work in this room?" It is:
Does this work in every plausible version of this room?
That is a statistical question. And it turns out you can answer it , live —, if you stop trying to answer it with pixels.
What it does
Skopos is a live world model of a real physical environment.
It maps the space, holds it as a structured, continuously updatable model rather than a frozen capture, and then does the thing a static twin cannot: it explores the space of plausible variations of that environment, surfaces the combinations that hold up and the ones that break, and gives deploying agents a measured Monte Carlo baseline to optimise against.
Concretely, the loop is:
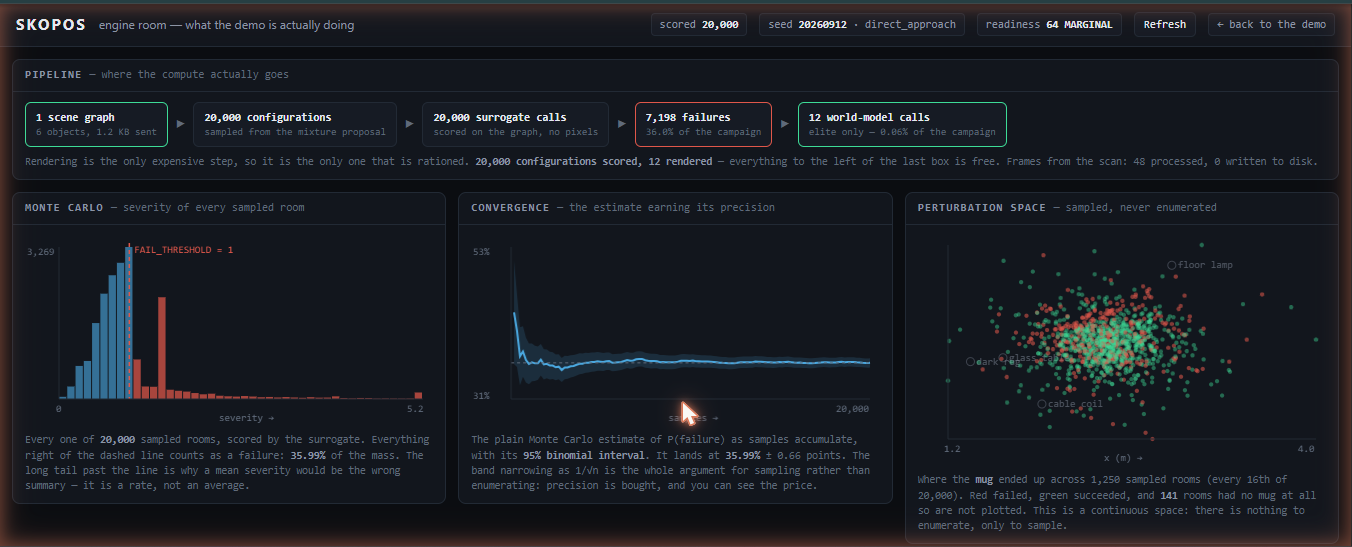
Map. Perception collapses the environment into a scene graph: objects, positions, extents, and material flags such as reflective and low-contrast, plus room-level lighting and clutter. This is the live model, and it is a few hundred bytes of structured text. Perturb. A perturbation 𝜃 θ is a continuous sample: per-object drift (𝑑𝑥, 𝑑𝑦), presence flips, a lighting value, and a Poisson count of unmodelled clutter. There is no enumerated list of "scenarios" - there is a distribution. Score. Every sampled configuration is evaluated against a task, in microseconds, on the graph rather than on rendered frames. Search. A cross-entropy method refits the sampler toward its own worst outcomes, finding rare-but-plausible failure modes rather than absurd ones. Deploy. Agents choose a strategy per configuration and optimise against the Monte Carlo baseline the campaign established.
The output is a readiness estimate with an honest uncertainty interval, a ranked attribution of which object in the environment is responsible for the failures, and a set of configurations worth a human's attention.
And the whole thing runs live. You can drag an object across the map and watch the estimate re-measure.
How we built it: The statistical core Readiness is a Monte Carlo estimate of a failure probability under an environment prior
Twenty thousand samples give a standard error on the order of 1/𝑛 , which is why the number on screen converges rather than jumps. You are watching an estimator settle.
Re-weighting instead of re-sampling:
Different environments have different priors - how much things drift, how often something is missing, how bright it usually is. Estimating each one separately costs a full campaign each, and that kills "live."
So Skopos samples once from a defensive mixture proposal and reweighs. The proposal mixes every target prior plus one deliberately over-dispersed component.
Refusing to lie:
Importance weights can collapse onto a handful of samples, at which point the estimate is noise wearing a number's clothes. So every re-weighted estimate carries its effective sample size, so the search finds failures that could actually happen rather than pathological ones. Five iterations, four hundred samples each, refitting the proposal to its own worst decile and blending toward the fit so convergence is visible across iterations.
It works, and the way it works is the nicest result in the project: it was never told what makes an environment dangerous, and it discovers darkness. The proposal's mean lighting collapses from 0.68 to 0.06 and the failure rate climbs from 46% to 90+%.
Agent strategy selection:
Strategy choice here is genuinely one-step — pick an approach, observe the outcome, no state transition — so a contextual bandit is the honest model rather than a full RL policy pretending to be one. LinUCB over four arms: Each tick draws a fresh perturbed environment from the same proposal the campaign uses, so the agent adapts to exactly the distribution the readiness number is measured over. The entire model is five numbers per arm — and they are drawn on screen, exploration bonus rendered separately from the mean, because a model small enough to display should be displayed.
The build: engine.py is stdlib-only and is the fixed dependency nothing else is allowed to modify. bandit.py is pure-Python LinUCB. privacy.py holds the ledger and a startup assertion. app.py is FastAPI with a single WebSocket. The front end is vanilla JavaScript with no build step and no external requests — every chart drawn on a raw from engine output. recorder.py makes any run reproducible from a seed and replayable with nothing on the network. selftest.py checks every claim in the README, including grepping the codebase to enforce that nothing is trained.
No API keys, no npm, no network required to run it.
Privacy, as an architectural property
Frames become a scene graph in memory and are then dropped. Only structured text crosses the network. The UI shows the exact payload live alongside counters for frames processed, frames discarded, frames written to disk, and a permanent pixels transmitted: 0.
There is exactly one escape hatch, it defaults off, and when it is on the startup log shouts and the panel turns red. If a provider is ever configured to upload reference imagery, the privacy banner downgrades itself to REDUCED BY CONFIGURATION and states how many images left the device.
This fell out of the architecture rather than being bolted onto it. Scoring on the graph instead of on frames is what makes the privacy claim cheap to keep.
Challenges we ran into:
Making "live" and "statistically honest" compatible. These pull in opposite directions. Live means sub-second response; honest means enough samples for the confidence interval to mean something. Re-weighting rather than re-sampling was the resolution, but it introduced its own failure mode — weight collapse - which then needed the ESS gate. Every performance shortcut bought a new way to be wrong, and each one had to be closed explicitly.
Deciding when not to show a number. This was harder than any of the maths. The instinct when a verdict is unreliable is to show it with a caveat. But a caveated number is still a number, and people act on numbers. Replacing the headline verdict with a hatched panel felt like removing a feature. It is the feature.
Keeping the surrogate honest about being a surrogate. The scoring function is hand-written. There was constant pressure to present it as more than that. We settled on making every coefficient a named constant, writing the limitations into the README before anyone asked, and stamping mock renders with the words MOCK RENDER inside the image itself so a screenshot cannot misrepresent them.

Log in or sign up for Devpost to join the conversation.