-
-

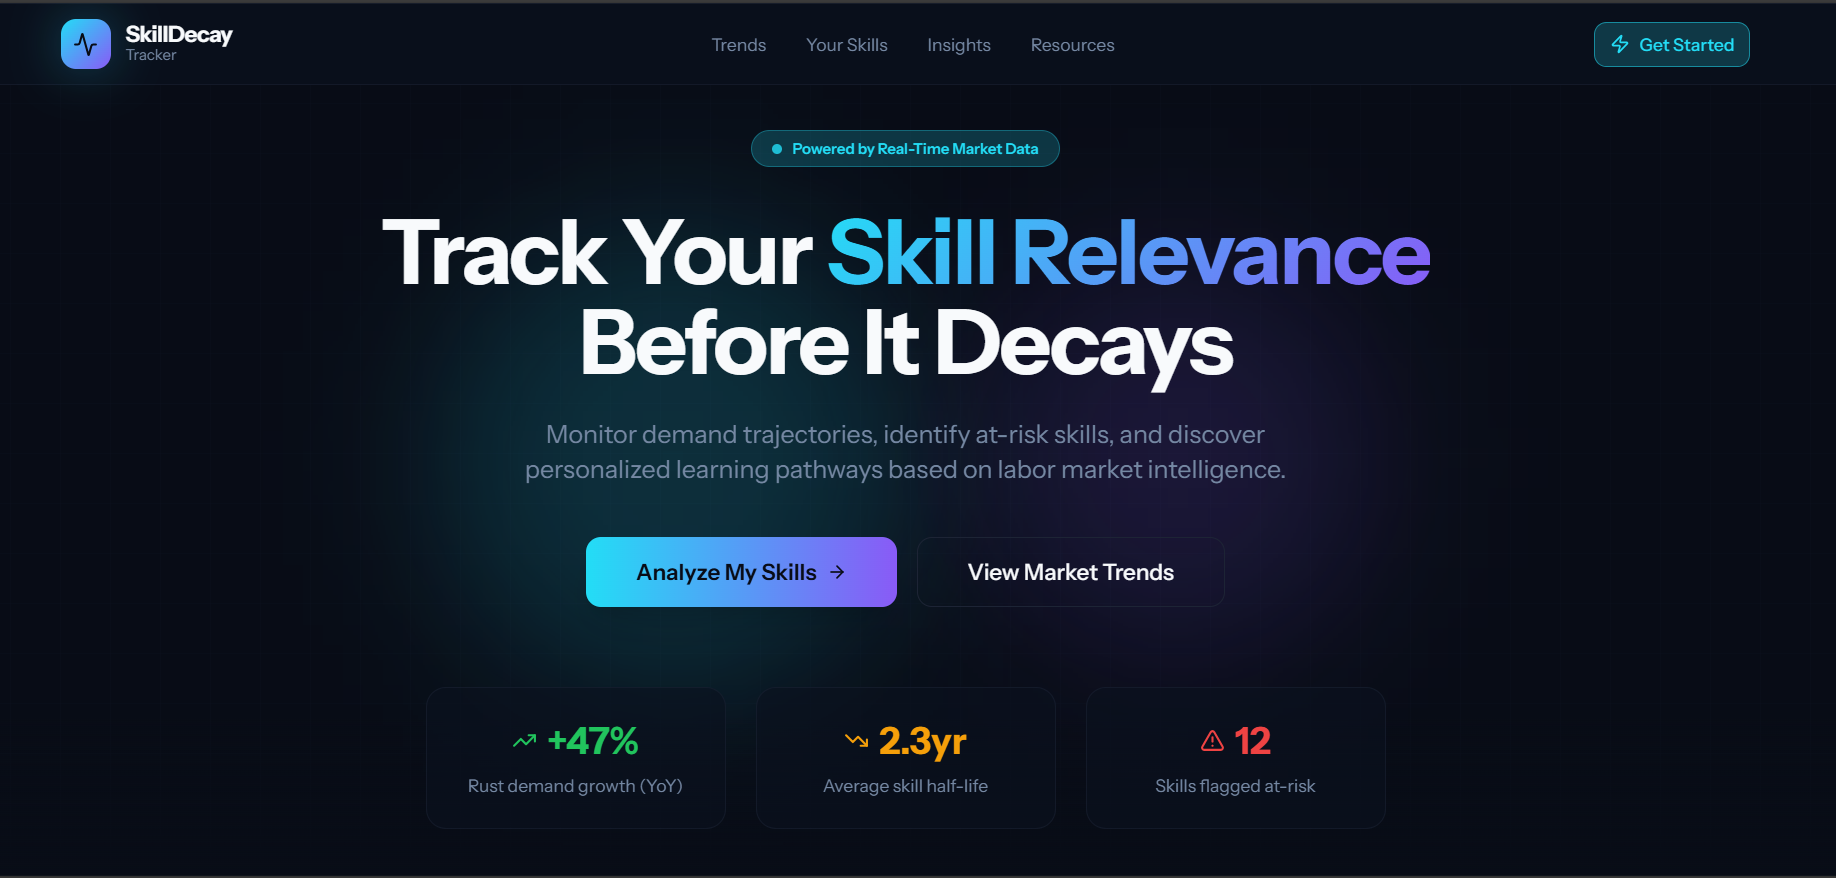
Track which professional skills are fading and get data-driven guidance to upskill before it’s too late
SkillDecayTracker
Inspiration
The professional world moves fast, and skills can quickly lose relevance. I noticed peers — and myself — spending time learning technologies that were fading in demand. This inspired SkillDecayTracker, a tool to track skill trends and guide upskilling decisions.
What it does
SkillDecayTracker analyzes trends from job postings, GitHub, and Stack Overflow to highlight:
- Skills losing relevance 📉
- Skills growing in demand 📈
- Adjacent skills to pivot into 🔄
- Suggested learning resources and micro-projects 📚 Users input their skills and career goals, and the platform provides actionable insights to prioritize learning.
How we built it
- Frontend: Next.js + TailwindCSS for a responsive dashboard
- Backend: FastAPI serving trend and skill data
- Data: Pre-collected datasets, GitHub topics, Stack Overflow trends
- NLP: spaCy + keyword extraction for skill mapping
- Visualizations: Chart.js for trend lines and risk bands
- Deployment: Vercel (frontend) + Render (backend) + Supabase for data
Skill Decay Model
We compute the trend slope ( m ) using linear regression: m=n∑(xy)−∑x∑yn∑(x2)−(∑x)2m = \frac{n\sum(xy) - \sum x \sum y}{n\sum(x^2) - (\sum x)^2}m=n∑(x2)−(∑x)2n∑(xy)−∑x∑y Where ( x ) represents time periods and ( y ) represents skill demand metrics. python# Example: compute skill trend slope import numpy as np slope = np.polyfit([1,2,3,4], [50,45,40,30], 1)[0] print("Trend slope:", slope) Risk Classification: Skills with ( m < -5 ) are flagged as high-risk for decay.
Challenges we ran into
- Limited access to real-time labor market data → used static datasets for MVP
- Normalizing skill mentions across multiple platforms
- Presenting trends clearly without overwhelming the user
- Avoiding overpromising skill predictions → used risk bands instead of exact "half-life"
Accomplishments that we're proud of
- Built a working dashboard showing skill decay trends
- Developed adjacent skill recommendations using cosine similarity: ( \text{similarity}(A,B) = \frac{A \cdot B}{||A|| \cdot ||B||} )
- Designed a simple, intuitive visualization for fast decision-making
- Laid the foundation for a data-driven career guidance tool
What we learned
How to combine multiple data sources into actionable insights Translating abstract skill trends into user-friendly visualizations Ethical AI: providing guidance without overpromising The importance of transparency — showing confidence intervals rather than false precision
What's next for SkillDecayTracker
Integrate more real-time labor market data (LinkedIn API, Indeed scraping) Add personalized alerts for at-risk skills Recommend micro-projects and courses automatically Expand to team and enterprise skill tracking Implement collaborative filtering: ( \hat{r}{ui} = \bar{r}u + \frac{\sum{v \in N(u)} \text{sim}(u,v)(r{vi} - \bar{r}v)}{\sum{v \in N(u)} |\text{sim}(u,v)|} )


Log in or sign up for Devpost to join the conversation.