-
-
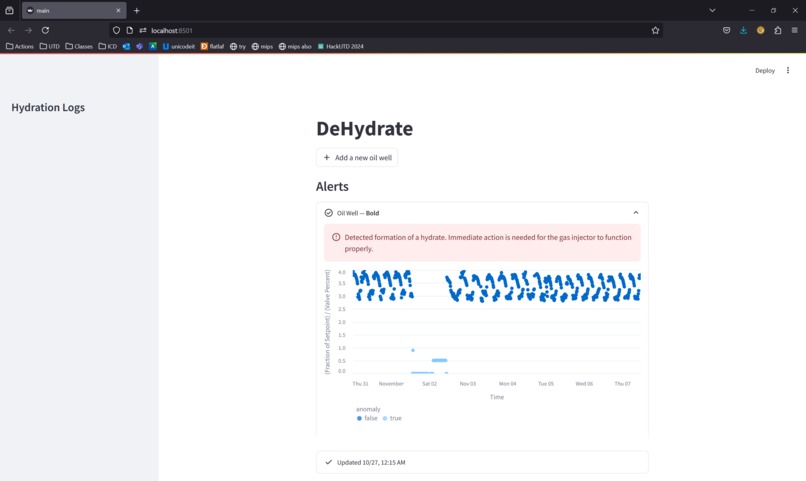
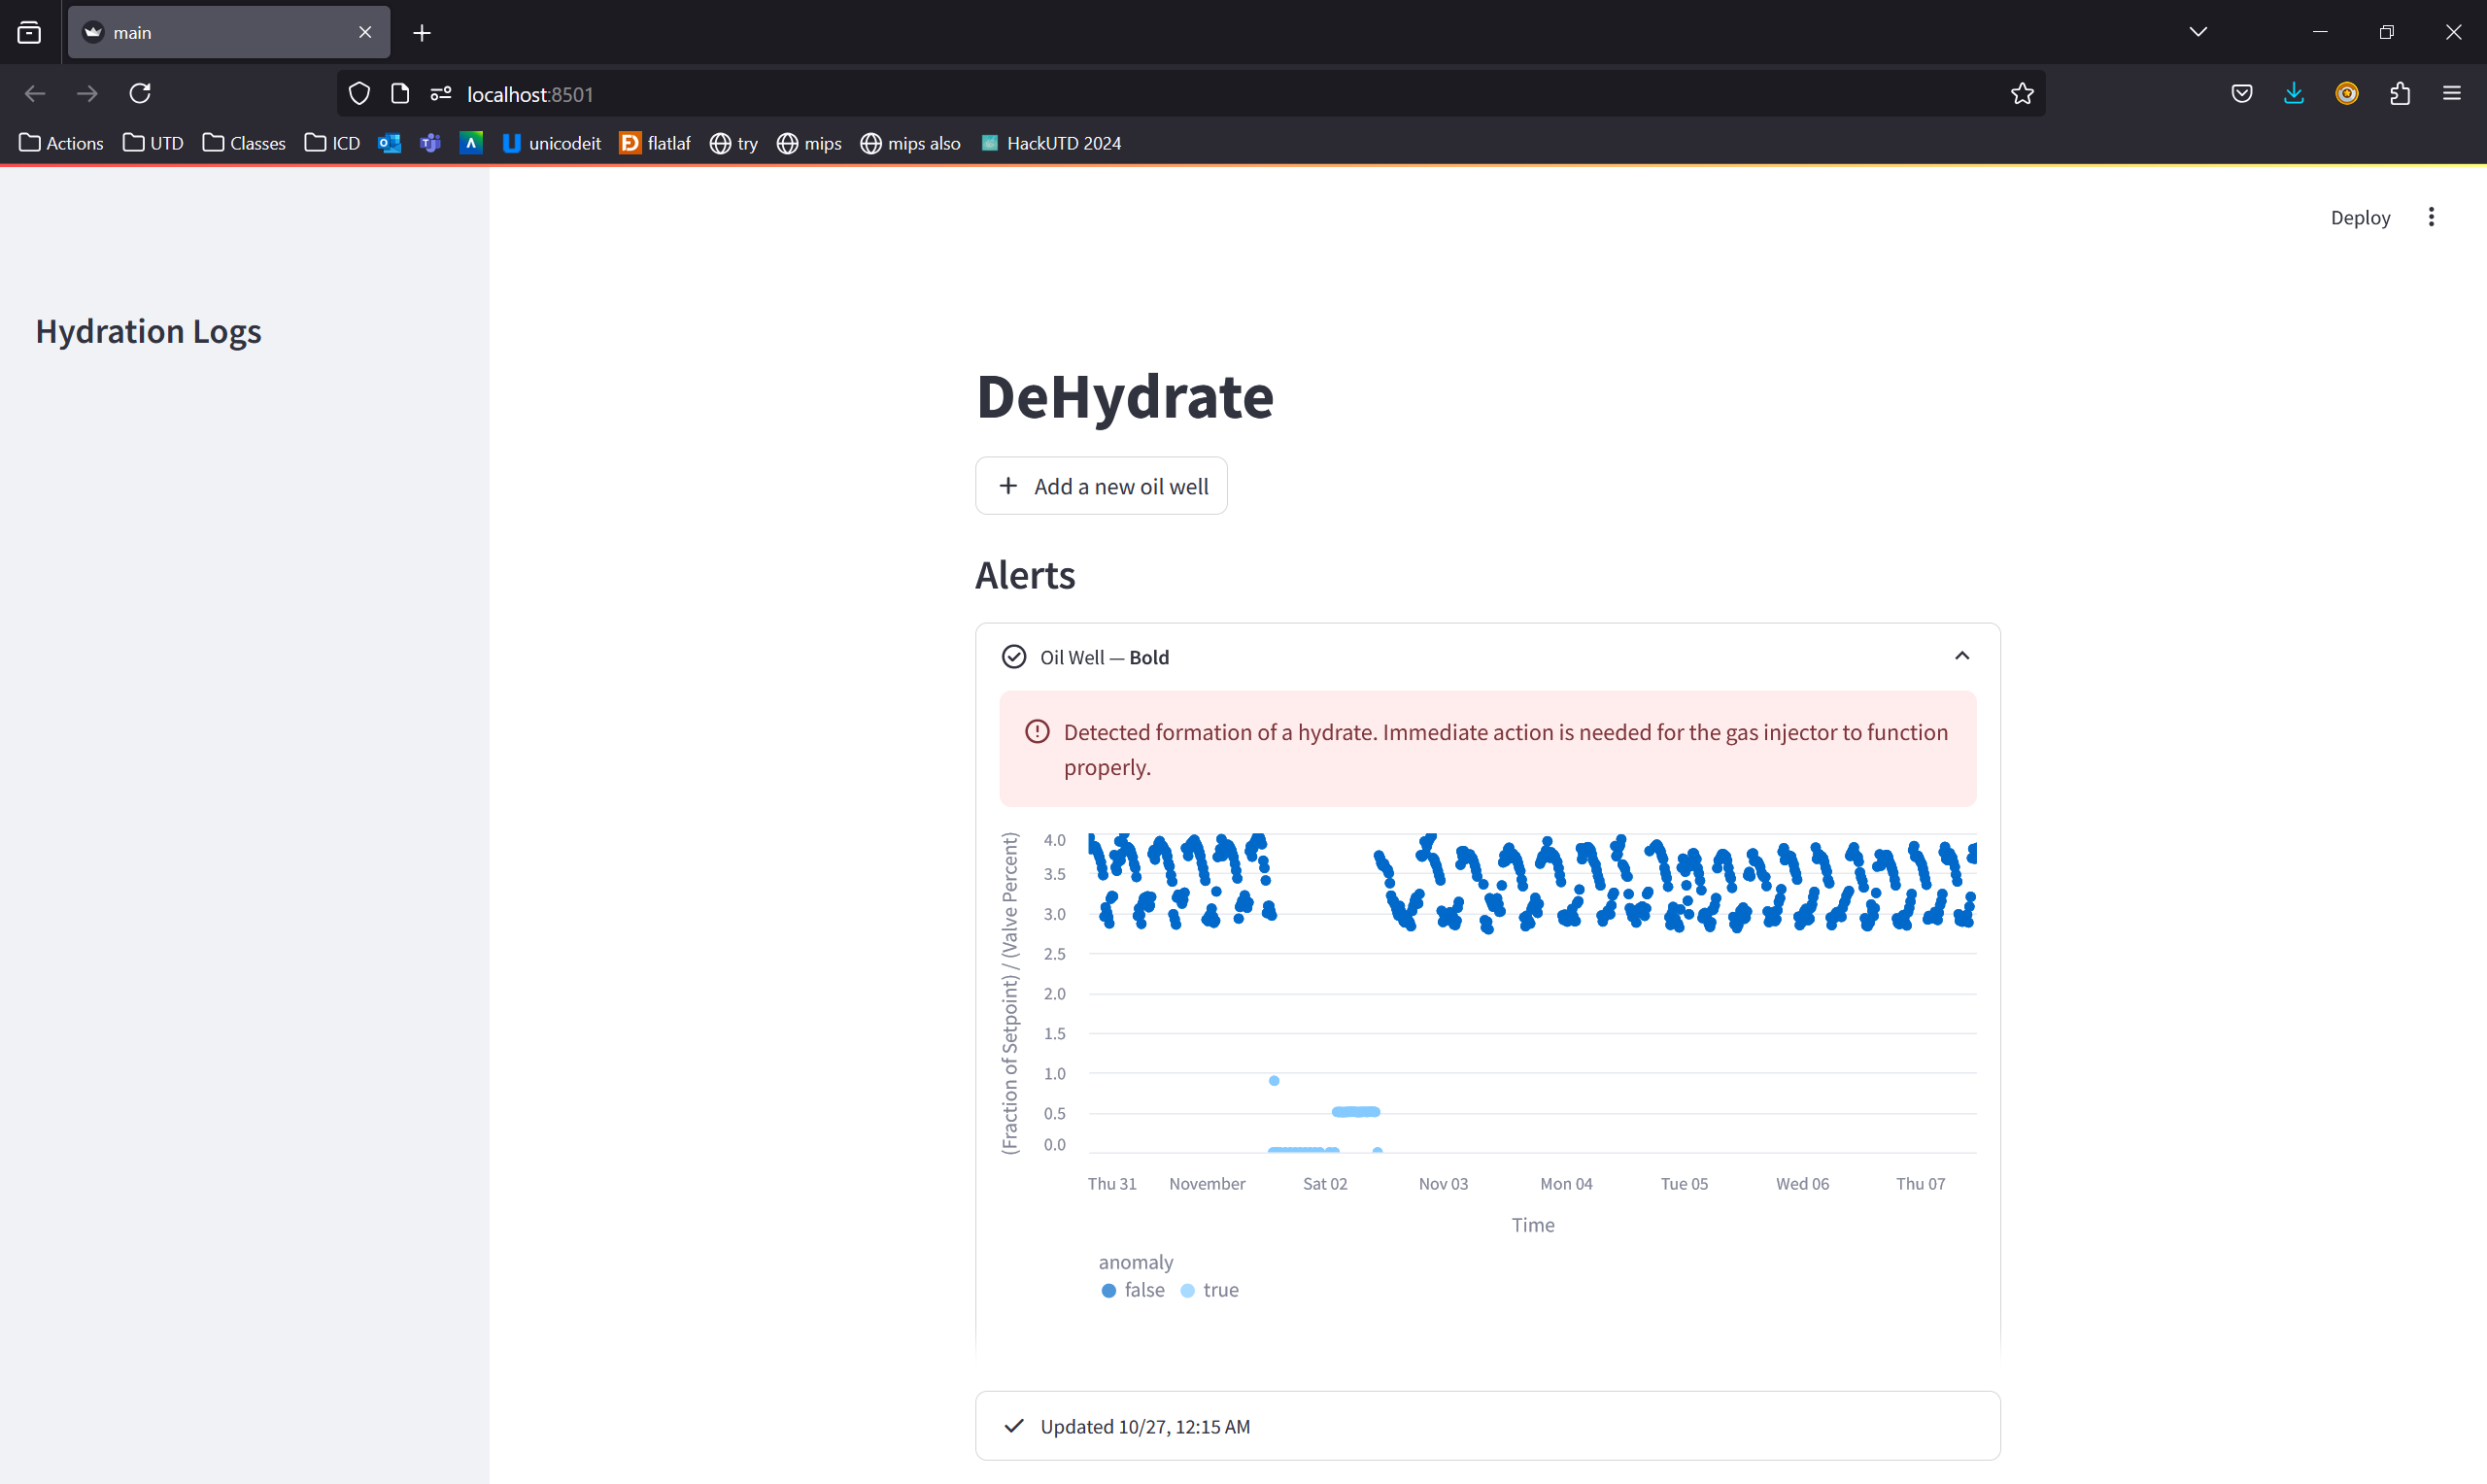
The main page
Inspiration
We wanted to do a data focused challenge. We were excited about potentially designing something that could make the jobs of lease operators easier and improve the efficiency of one of America's most important industries.
What it does
Our project takes in CSV files representing oil well data. It then analyzes this data to detect anomalies which are likely hydrates. It provides detailed log information as well as real-time alerts to users to help fix problems as soon as they arise. Our app simulates a real-time input by slowly increasing the time manually. We also have detailed graphs with the sensor readings as well as anomalies.
How we built it
We built our project in Python using Streamlit for our frontend. After analyzing the data, we came up with what we thought was the best way to detect hydrates: measuring current flow divided by goal flow divided by what percent open the valve was, and applying a linear regression model. This allowed us to easily determine when the flow was significantly lower than we expected. Then, we made error alerts and notifications whenever we detected an anomaly, and displayed graphs using built in Streamlit functions.
Challenges we ran into
While Streamlit was pretty simple to start out with, it was difficult to do any complicated formatting or displays in Streamlit. In particular, it was really difficult to make push notifications in the app because it wasn't a Streamlit feature. Additionally, we struggled a little bit with trying to implement a Fourier transform on a non-uniform data set. The circumstances of how we streamed the data was also a challenge; in a practical case, the site would update in real-time to reflect live data from sensors and meters, but we had to do the best we could to adapt that strategy to a static dataset.
Accomplishments that we're proud of
We are proud that our project is able to quickly and accurately analyze data and provide relevant real-time information to end users, while being easy to navigate and tell exactly where and when hydrates are forming.
What we learned
We learned how to use Streamlit to develop front end using Python. We also learned more about using Python for data analysis, including the Pandas library.
What's next for DeHydrate
If we had more time, we would implement more advanced data analysis, potentially using Machine Learning or a Fourier Analysis approach, to be able to better predict the formation of hydrates. We would also use a cloud database instead of storing the files locally.
Built With
- python
- streamlit


Log in or sign up for Devpost to join the conversation.