-
-
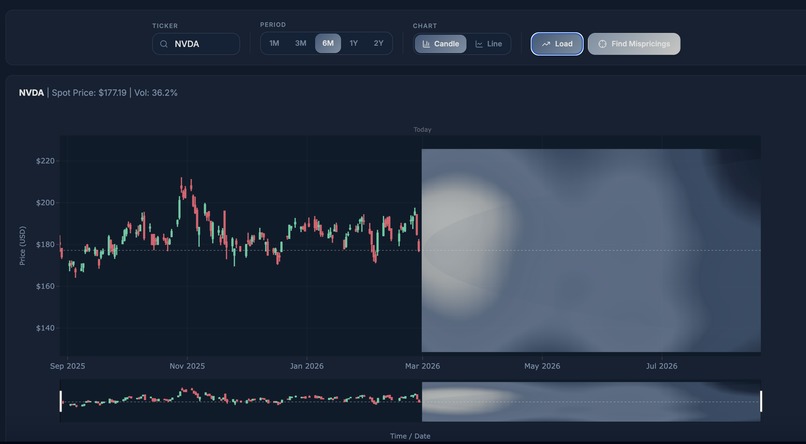
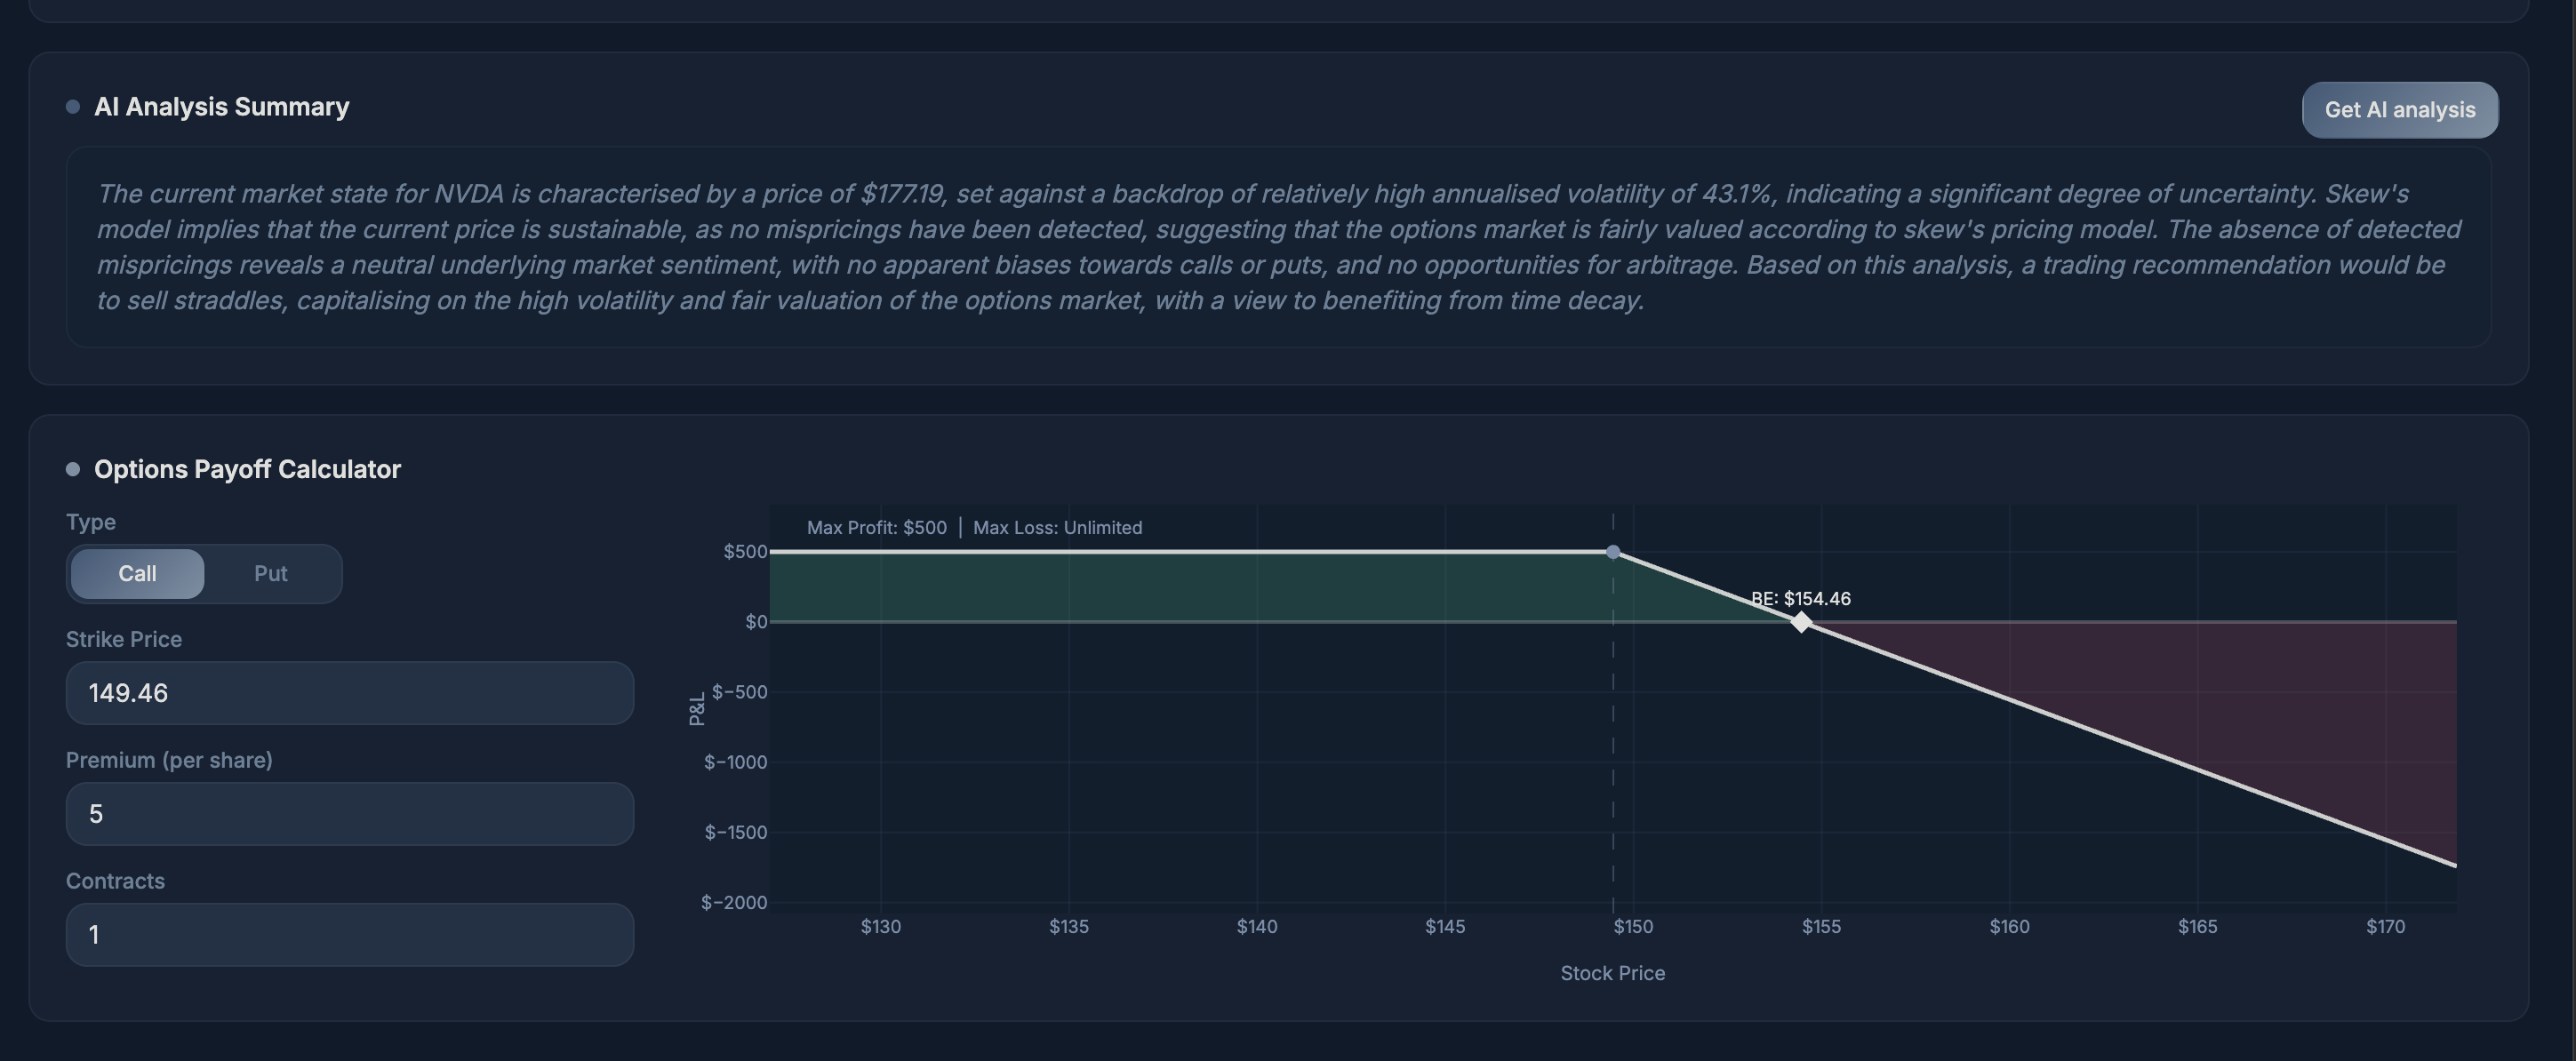
UI
-
AI Generation
-
Mispricings
skew.
Inspiration
Options markets are opaque by design. Institutional desks have proprietary pricing models, real-time vol surface infrastructure, and physics-trained quants. Retail traders get a chain of numbers and a heatmap. We wanted to close that gap.
We were frustrated that the dominant pricing model, Black-Scholes, is a 50-year-old formula that every serious practitioner knows is wrong, yet it remains the default reference point for nearly everyone outside of top-tier firms. The vol smile exists. The market misprices options relative to their true risk-neutral distribution. We wanted to make that visible.
SKEW was built on one belief: that with the right combination of physics-informed neural networks, ensemble ML, and vol surface modelling, a retail trader can see what institutional desks see.
What It Does
skew is a real-time options intelligence platform with three interconnected layers:
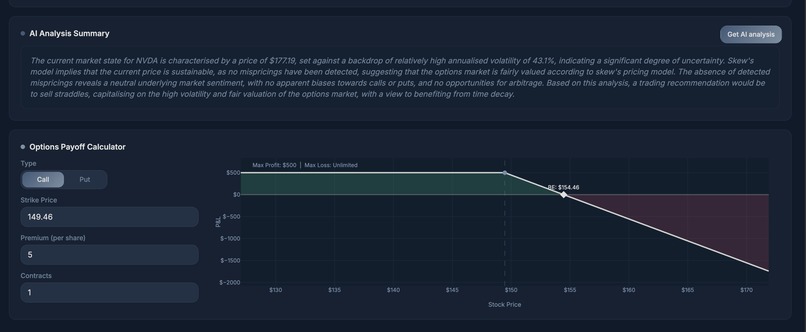
The Mismatch Engine fetches the live options chain for any ticker, filters to realistic strikes within 30% of spot, computes Black-Scholes reference prices, fits a volatility surface, and runs four ML models (Neural Net, XGBoost, LightGBM, CatBoost) to reprice every contract. The best-performing model is selected automatically per ticker. Contracts where the ML reprice diverges significantly from the BS benchmark are flagged as mispriced, ranked by edge, and returned to the frontend as actionable signals with vol anomaly classification (VOL_SPIKE, VOL_CRUSH, NORMAL).
The PINN Overlay trains a Physics-Informed Neural Network on the Black-Scholes PDE in real time for the requested ticker. Rather than assuming a flat vol surface, the PINN learns the option price surface V(S,t) by minimising a combined loss across data fit, PDE residual, and boundary conditions. It then extracts the implied risk-neutral terminal price distribution via Breeden-Litzenberger, giving a physics-grounded probability distribution over future prices including mode, bands, and percentiles.
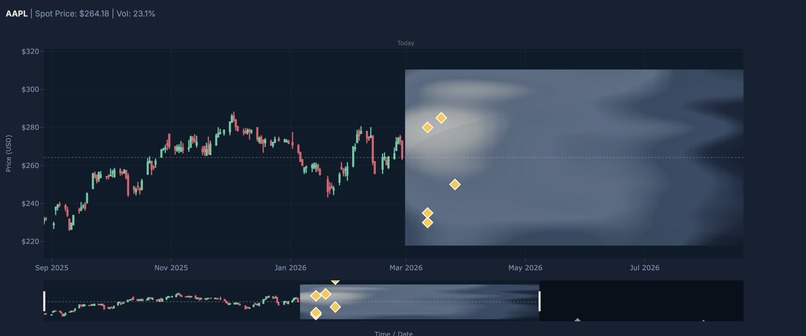
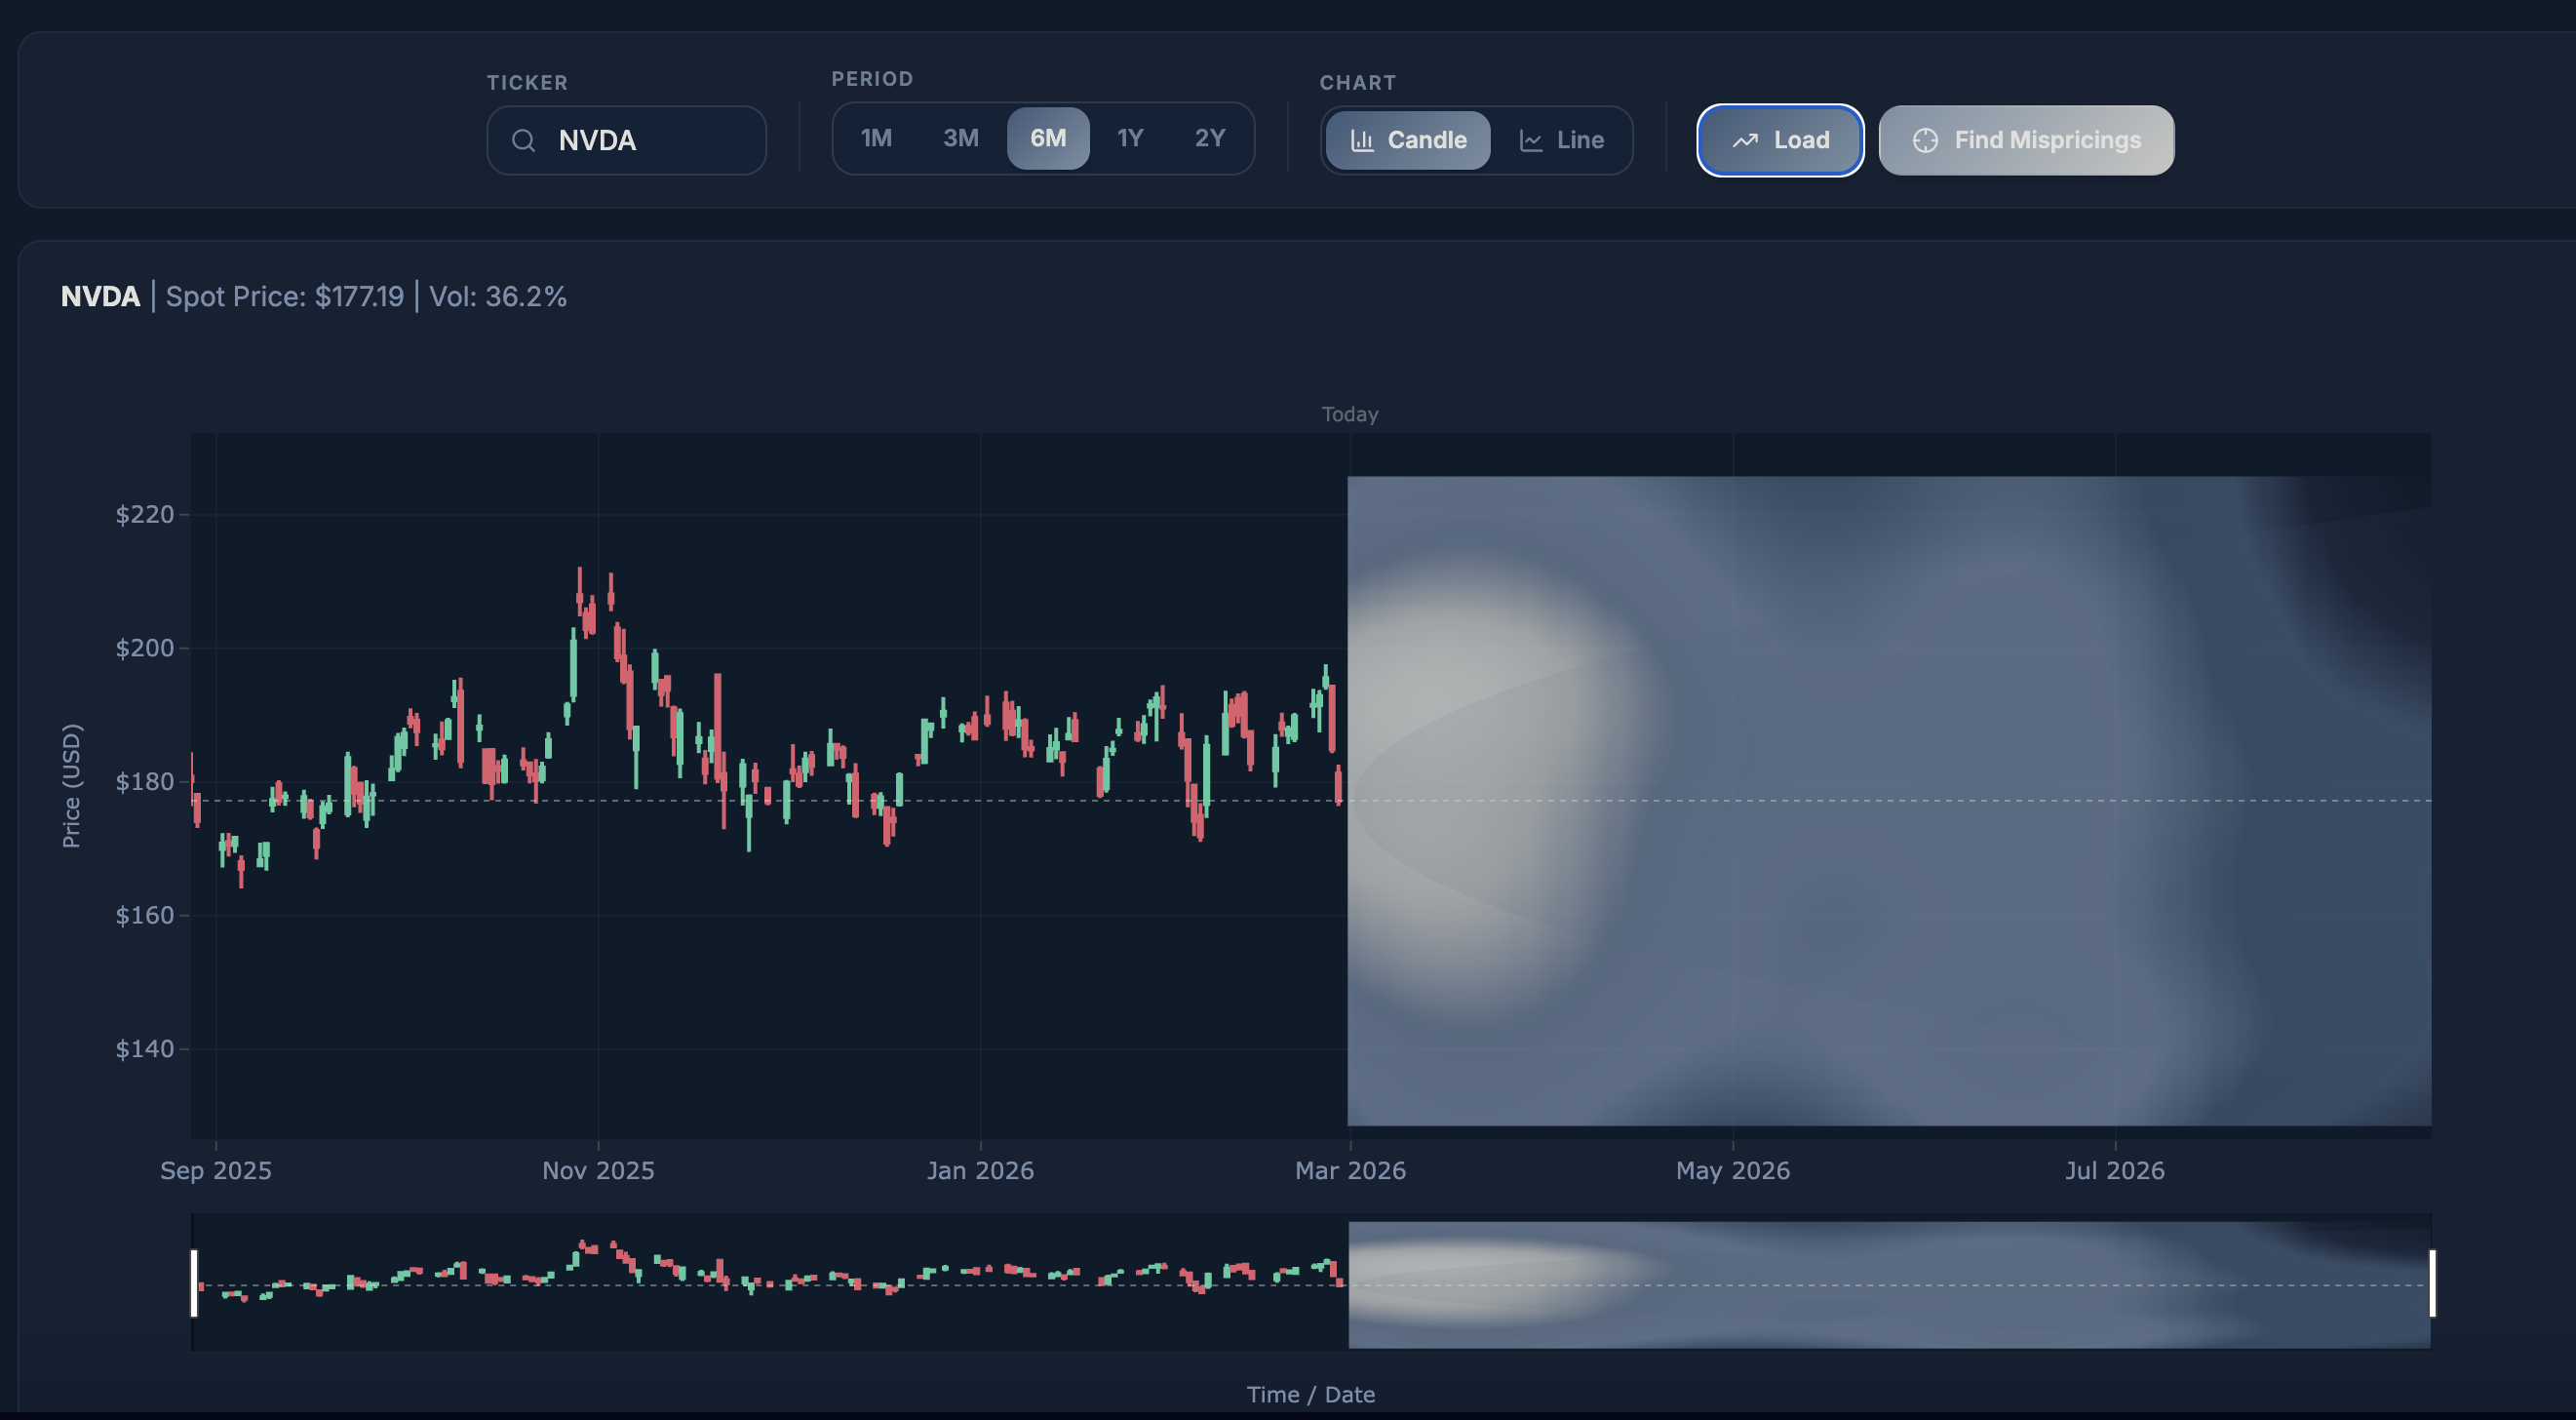
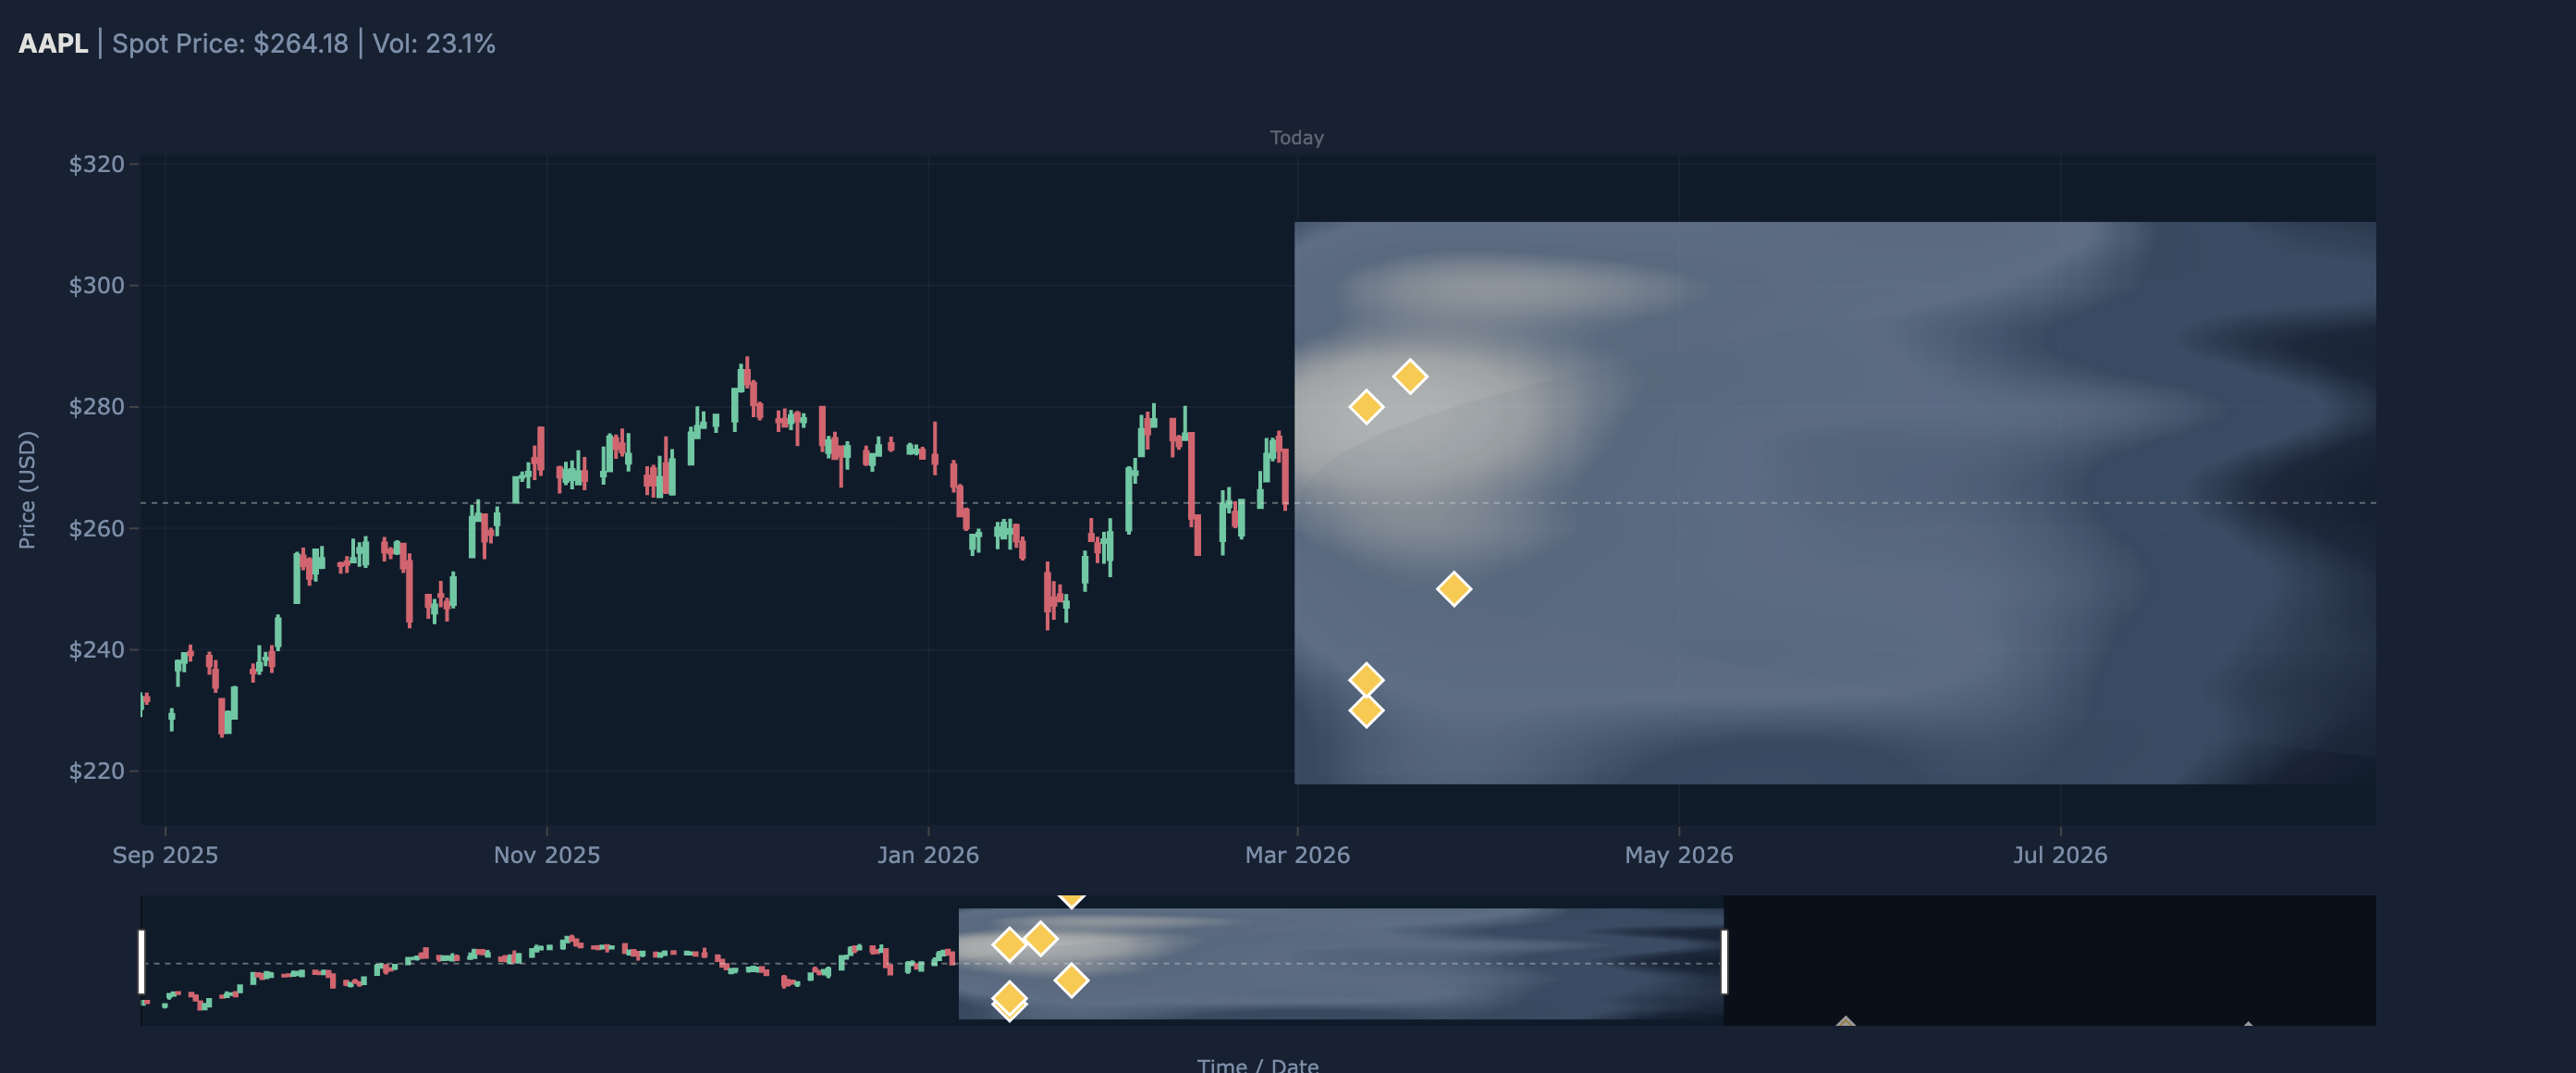
The Visualisation plots both overlays on top of a live candlestick chart with a volatility cone and options heatmap. Mispriced contracts appear as markers positioned at (expiry date, strike), sized by divergence and coloured by vol signal. The PINN distribution appears as a shaded band and mode line anchored from today to the nearest expiry.
How We Built It
The team divided across three modules that connect through a shared FastAPI backend.
Ananth built the Mismatch Engine: the full options data pipeline from yfinance ingestion through BS pricing, implied vol computation, vol surface fitting, ML training and scoring, and the divergence ranking system. The backend exposes a /mispricings/{ticker} endpoint that runs the full pipeline and returns ranked signals in a typed API contract.
Kamai built the PINN framework and backend infrastructure: the PyTorch physics-informed neural network trained on the BS PDE, the Breeden-Litzenberger distribution extraction, the GBM calibration from historical price data, and the FastAPI server that orchestrates both engines and exposes endpoints to the frontend. The PINN trains asynchronously and caches results per ticker, with a polling mechanism so the frontend doesn't block.
Jack built the frontend in Lovable: the candlestick chart, vol cone, options heatmap, and the overlay rendering logic that consumes both API endpoints and plots PINN bands and mispricing markers on the same coordinate system.
The stack is Python (FastAPI, PyTorch, XGBoost, LightGBM, CatBoost, sklearn, scipy, yfinance) on the backend, and React on the frontend, connected via a live ngrok tunnel during the demo.
Challenges We Ran Into
PINN loss balancing was non-trivial. Data loss, PDE residual loss, and boundary condition loss operate at different scales. Without normalising option prices by the spot price, the PDE coefficients and MSE terms were orders of magnitude apart, causing the physics loss to dominate and the network to ignore data entirely. Normalising all terms by the current price brought the three losses onto the same scale and stabilised training.
Ticker-specific model training was a hard lesson. ML models trained on one ticker produce completely wrong reprices on another because price scales, vol regimes, and strike distributions are entirely different. A CatBoost model trained on AAPL is useless on NVDA. The fix was ticker-specific model caching: each ticker trains and saves its own set of model files, loading from disk on subsequent calls.
The merge explosion took time to diagnose. The top opportunities query selects the best N contracts by divergence, but merging vol surface data back on (K, type) caused row multiplication because the same strike exists across many expiry dates. The fix was to pin each contract to its nearest expiry before the merge using sort_values("T").drop_duplicates(keep="first").
Git coordination mid-hackathon, with one person restructuring the entire folder layout while another was still committing to the old structure, caused significant branch divergence. We resolved it through branch discipline and explicit PR reviews before merging to main.
Accomplishments That We're Proud Of
The PINN actually converges to a meaningful distribution in real time for arbitrary tickers. Training a physics-informed neural network that satisfies the Black-Scholes PDE, not just fits historical data, and extracting a proper risk-neutral density from it via Breeden-Litzenberger is not a trivial result. The fact that it runs live, per-ticker, in under a minute is something we're proud of.
The Mismatch Engine's automatic best-model selection means the system self-calibrates. For a ticker like NVDA where CatBoost achieves RMSE of 0.33 against a BS baseline of 2.06, the system correctly identifies and uses CatBoost. For a different ticker where XGBoost wins, it switches automatically. No hardcoded assumptions.
The two engines are genuinely complementary. The PINN gives you the physics-grounded view of where price should be distributed. The Mismatch Engine tells you which specific contracts the market has priced inconsistently. Together they give a more complete picture than either alone.
What We Learned
Physics-informed networks are sensitive to problem formulation in ways that standard supervised models are not. The choice of normalisation, loss weighting, and boundary condition specification directly determines whether the network learns anything useful. Getting the PDE residual to be meaningful required understanding the mathematics, not just tuning hyperparameters.
Ensemble ML for options pricing works best when models are trained on the specific instrument they're pricing. The features (S, K, sigma, T, r) are the same across tickers, but the distributional properties of the training data are not. Ticker-specific training is not optional.
Designing a clean API contract upfront, and treating it as a shared interface that all three team members code against, was the single most important coordination decision we made. It let the frontend and backend develop in parallel without blocking each other.
Git discipline matters more under time pressure, not less. The temptation to commit directly to main to save time creates exactly the kind of diverged branch situation that costs more time to unpick than the commit saved.
What's Next for SKEW
The most immediate addition is a live signal tracker: saving flagged mispricings with timestamps and checking whether prices moved toward the model's predicted fair value over the following 3–5 days. This turns the system from a theoretical signal generator into an empirically validated one.
On the modelling side, the vol surface fitting currently uses XGBoost on moneyness and time to expiry. Replacing this with a proper SVI (Stochastic Volatility Inspired) parametric surface would give a more arbitrage-free representation and better anomaly detection at the wings.
The PINN currently trains a new network per ticker per session. A pre-trained network fine-tuned on live data, rather than trained from scratch each time, would reduce latency significantly and make real-time polling practical.
Longer term, SKEW's architecture is the foundation for a systematic options strategy backtester. With historical options data via Polygon.io, the mismatch signals can be tested against realised outcomes, turning the divergence flags into a quantified edge with empirical win rates and expected returns.
Built With
- black-scholes-pde
- breeden-litzenberger-theorem
- catboost
- fastapi
- geometric-brownian-motion
- javascript
- lightgbm
- lovable
- numpy
- pandas
- python
- pytorch
- react
- scikit-learn
- scipy
- tailwind-css
- xgboost
- yfinance


Log in or sign up for Devpost to join the conversation.