-
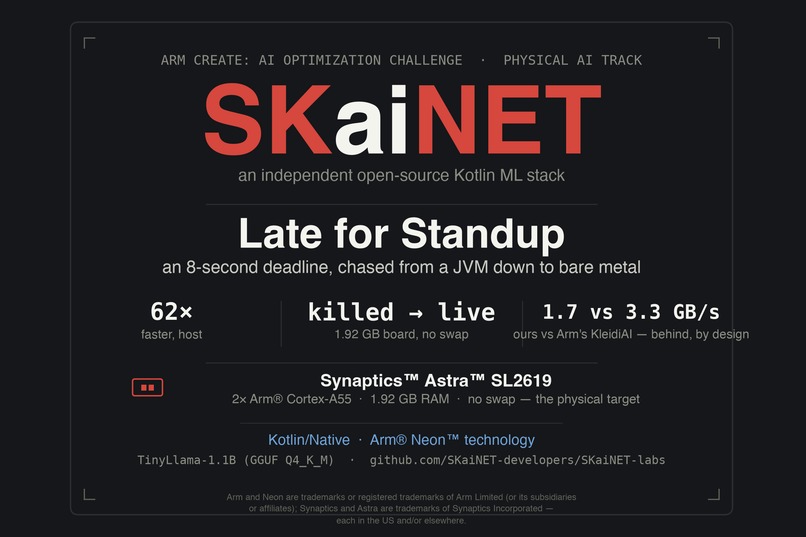
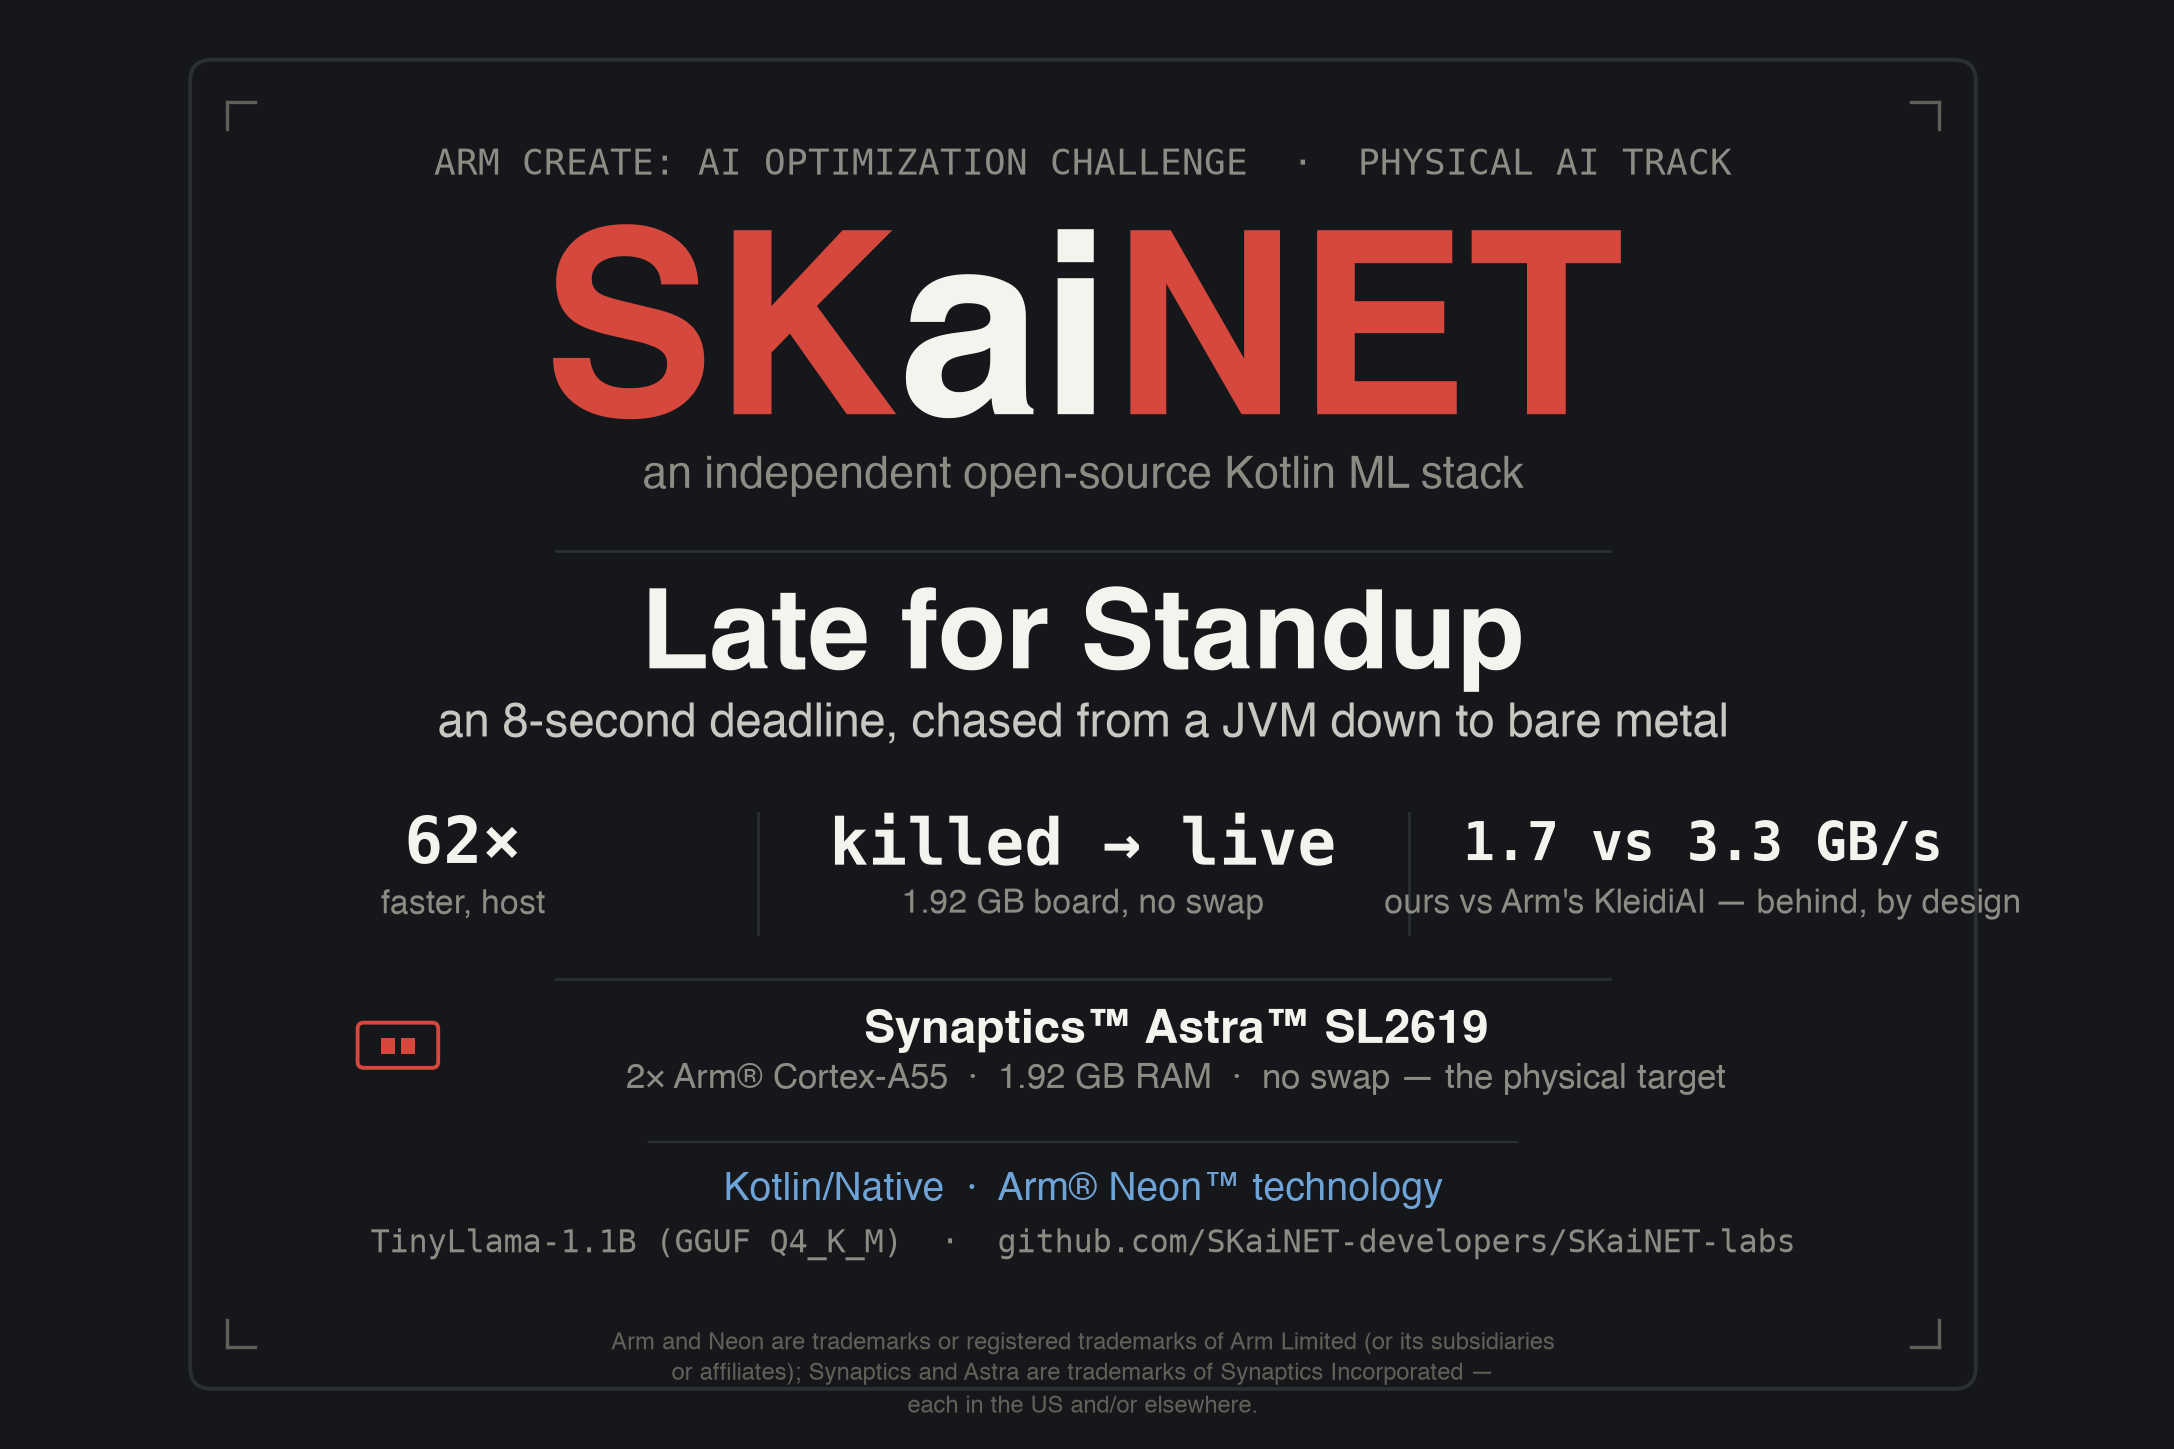
Badge
-
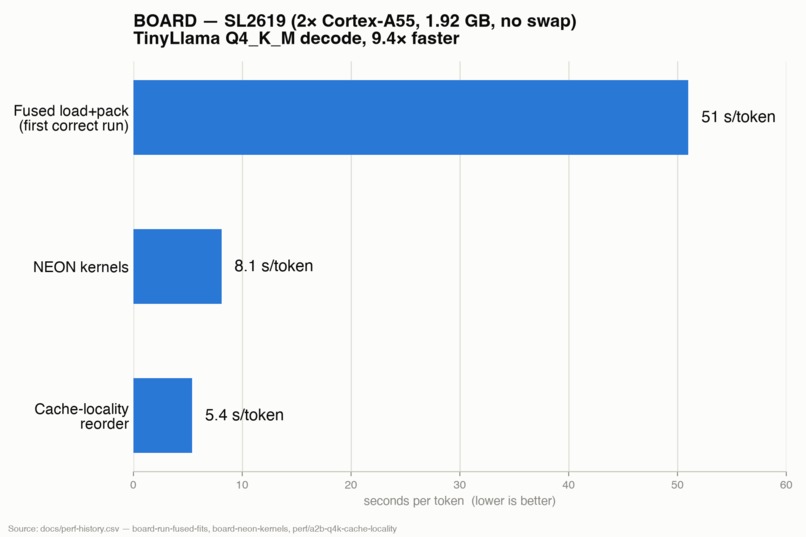
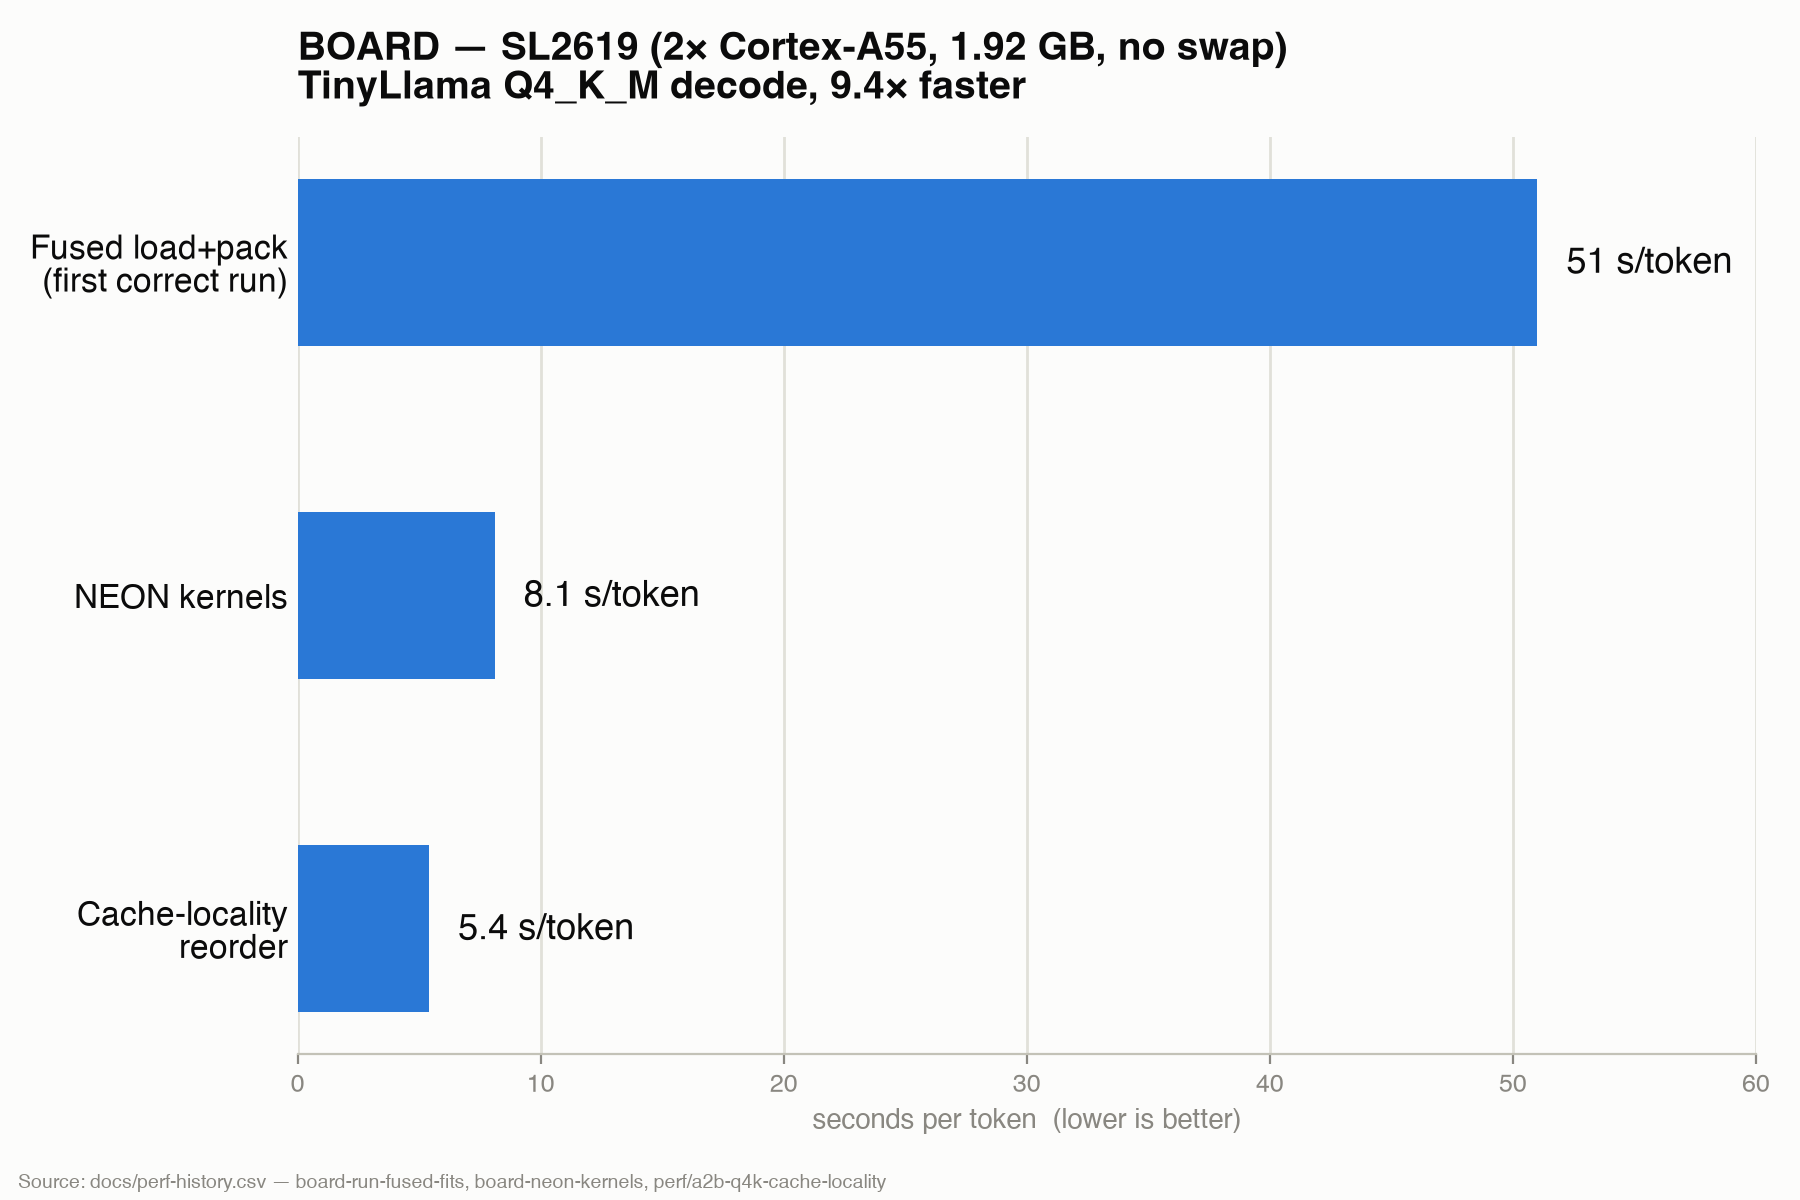
Board decode: 51 → 5.4 s/token
-
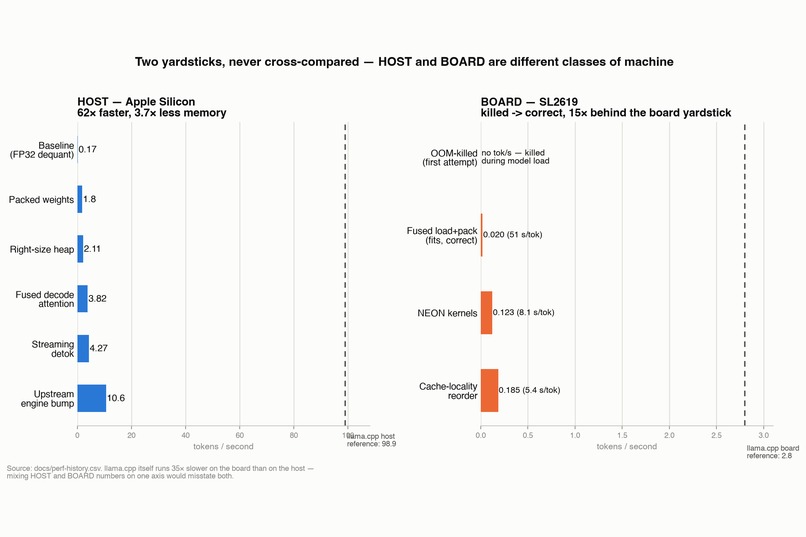
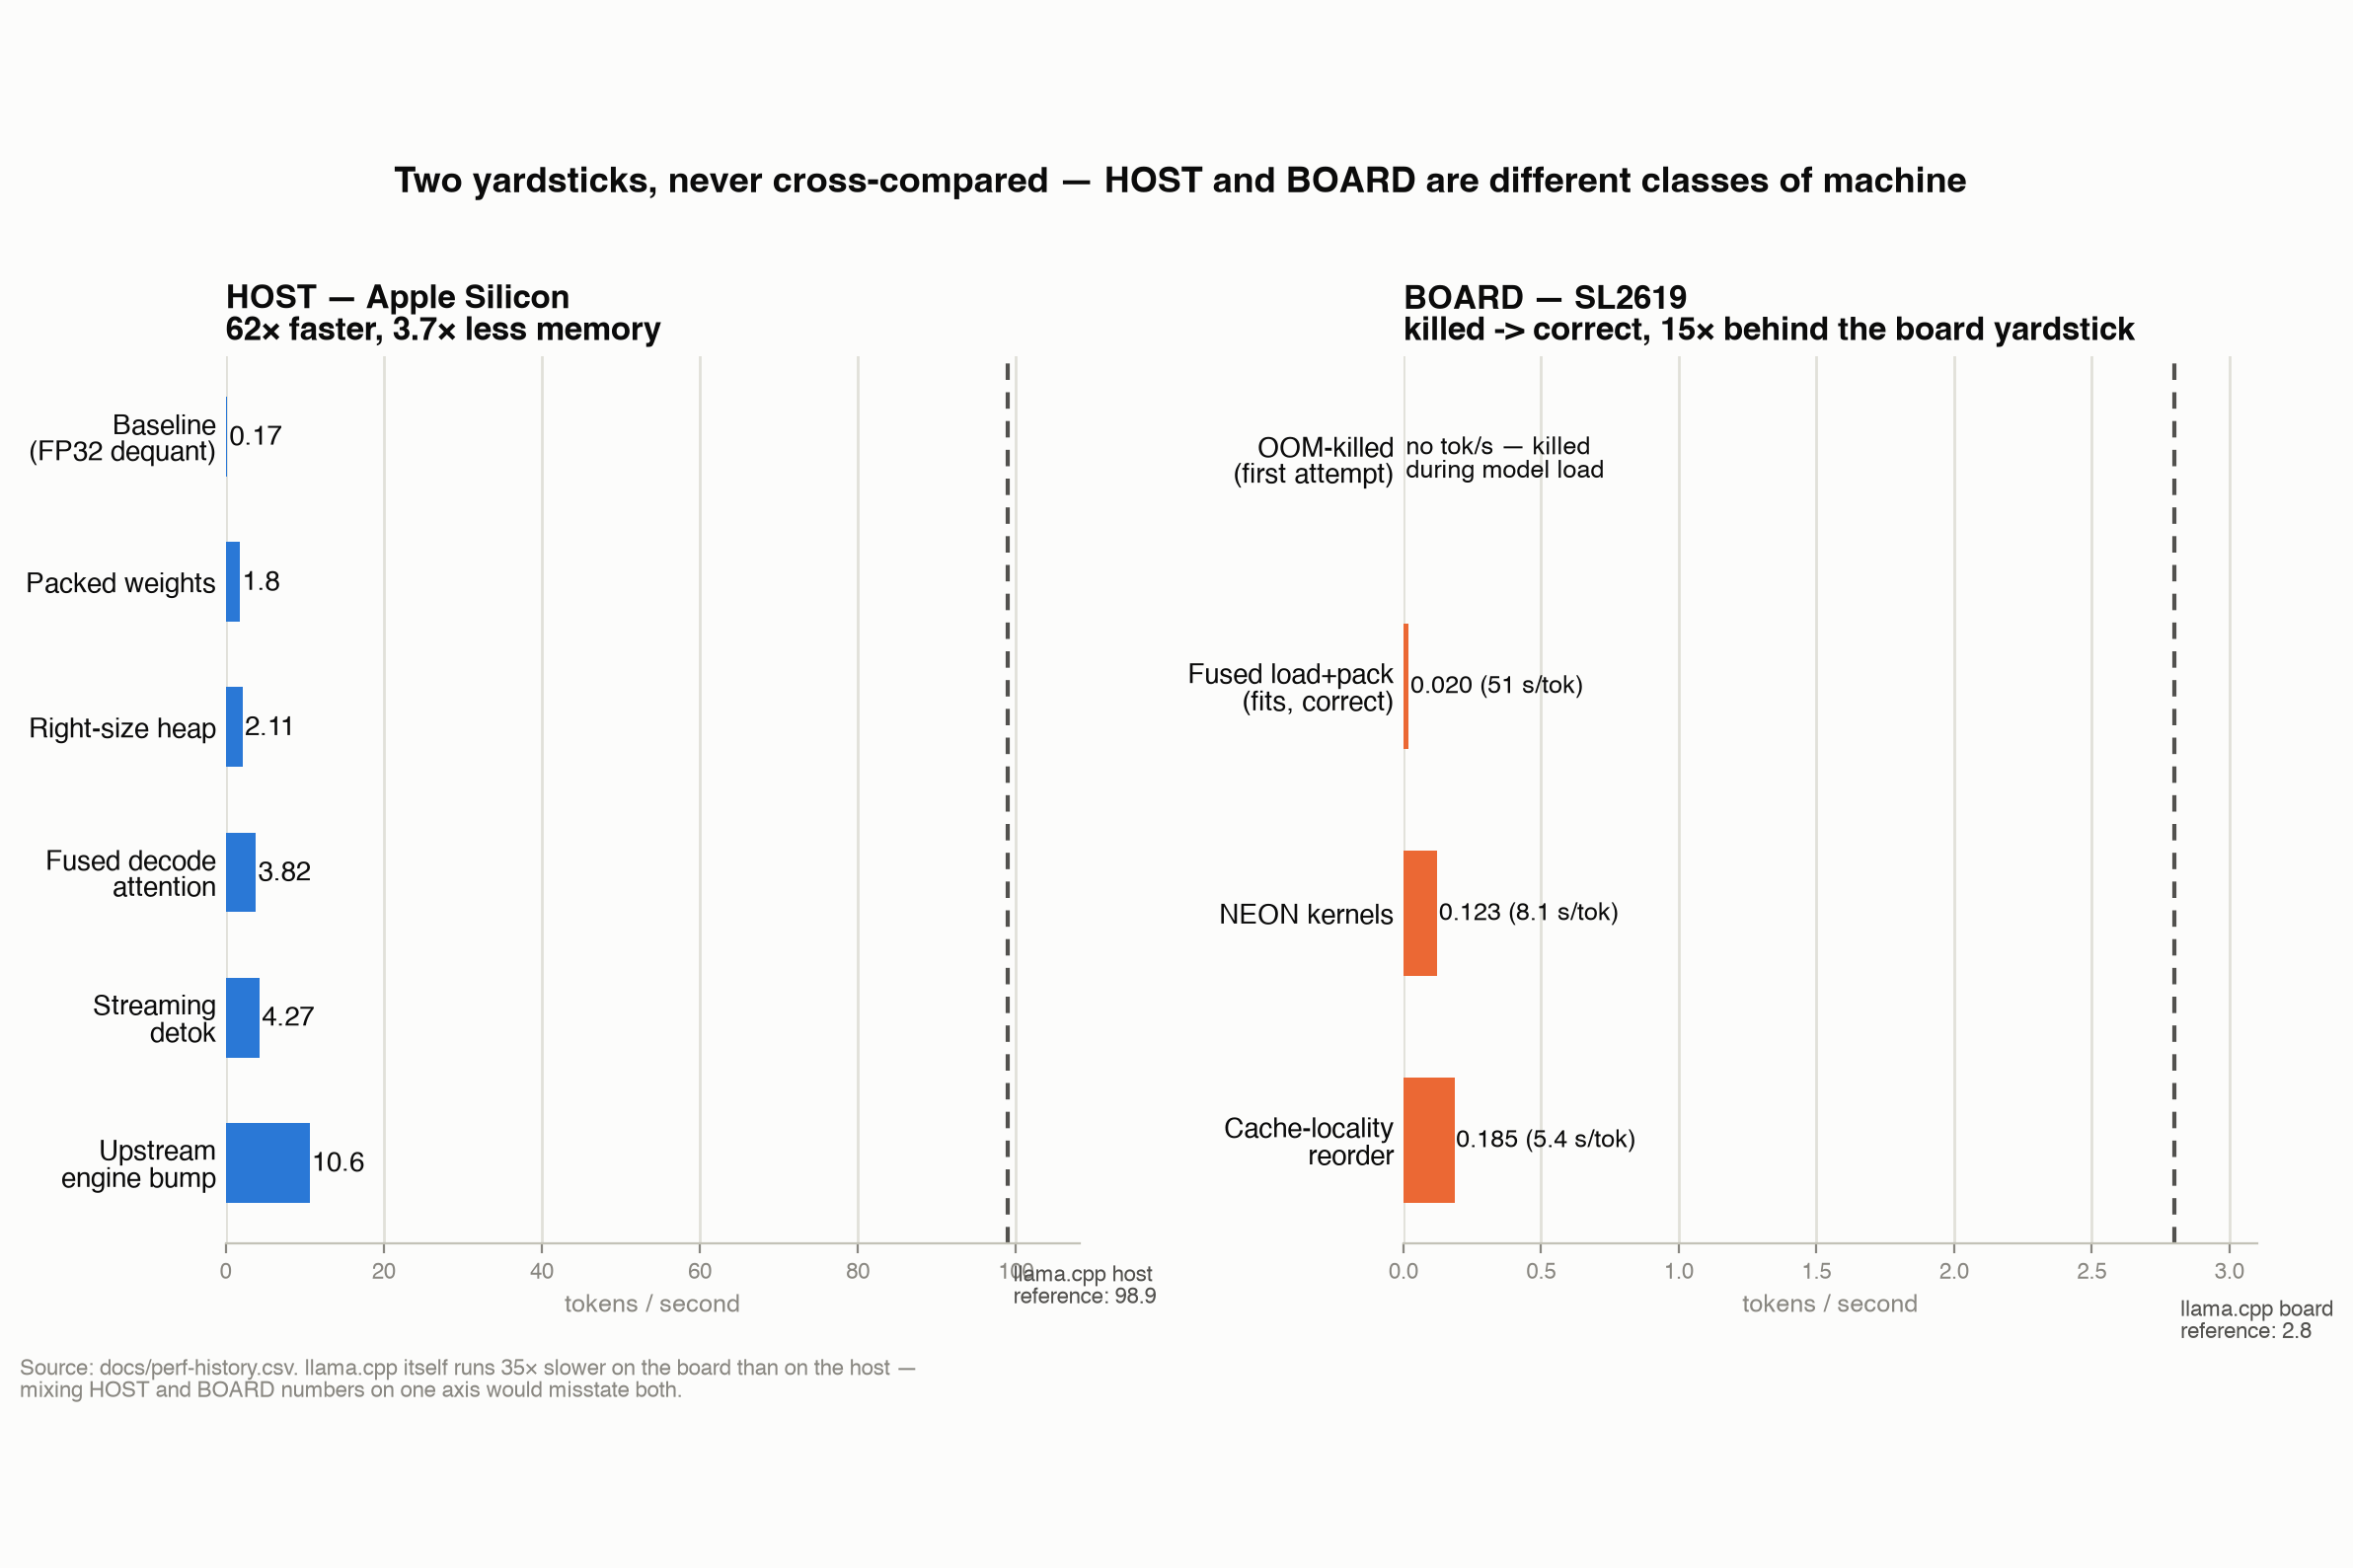
Two yardsticks, never cross-compared
-
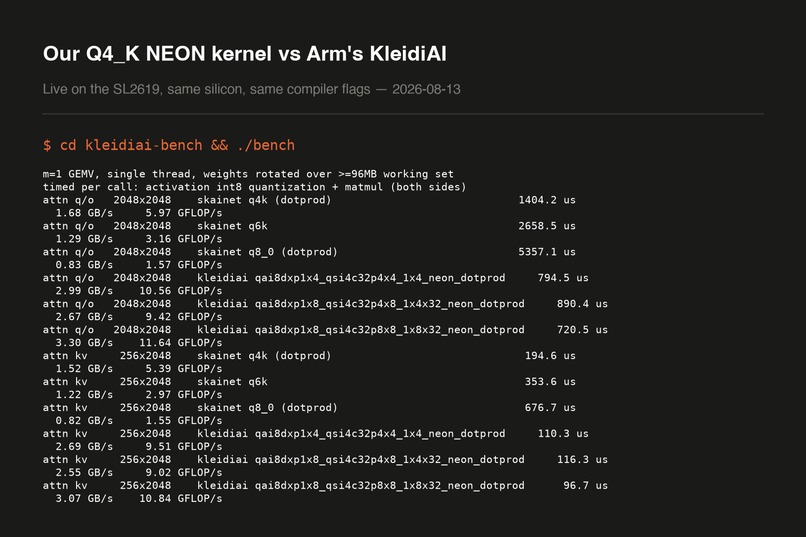
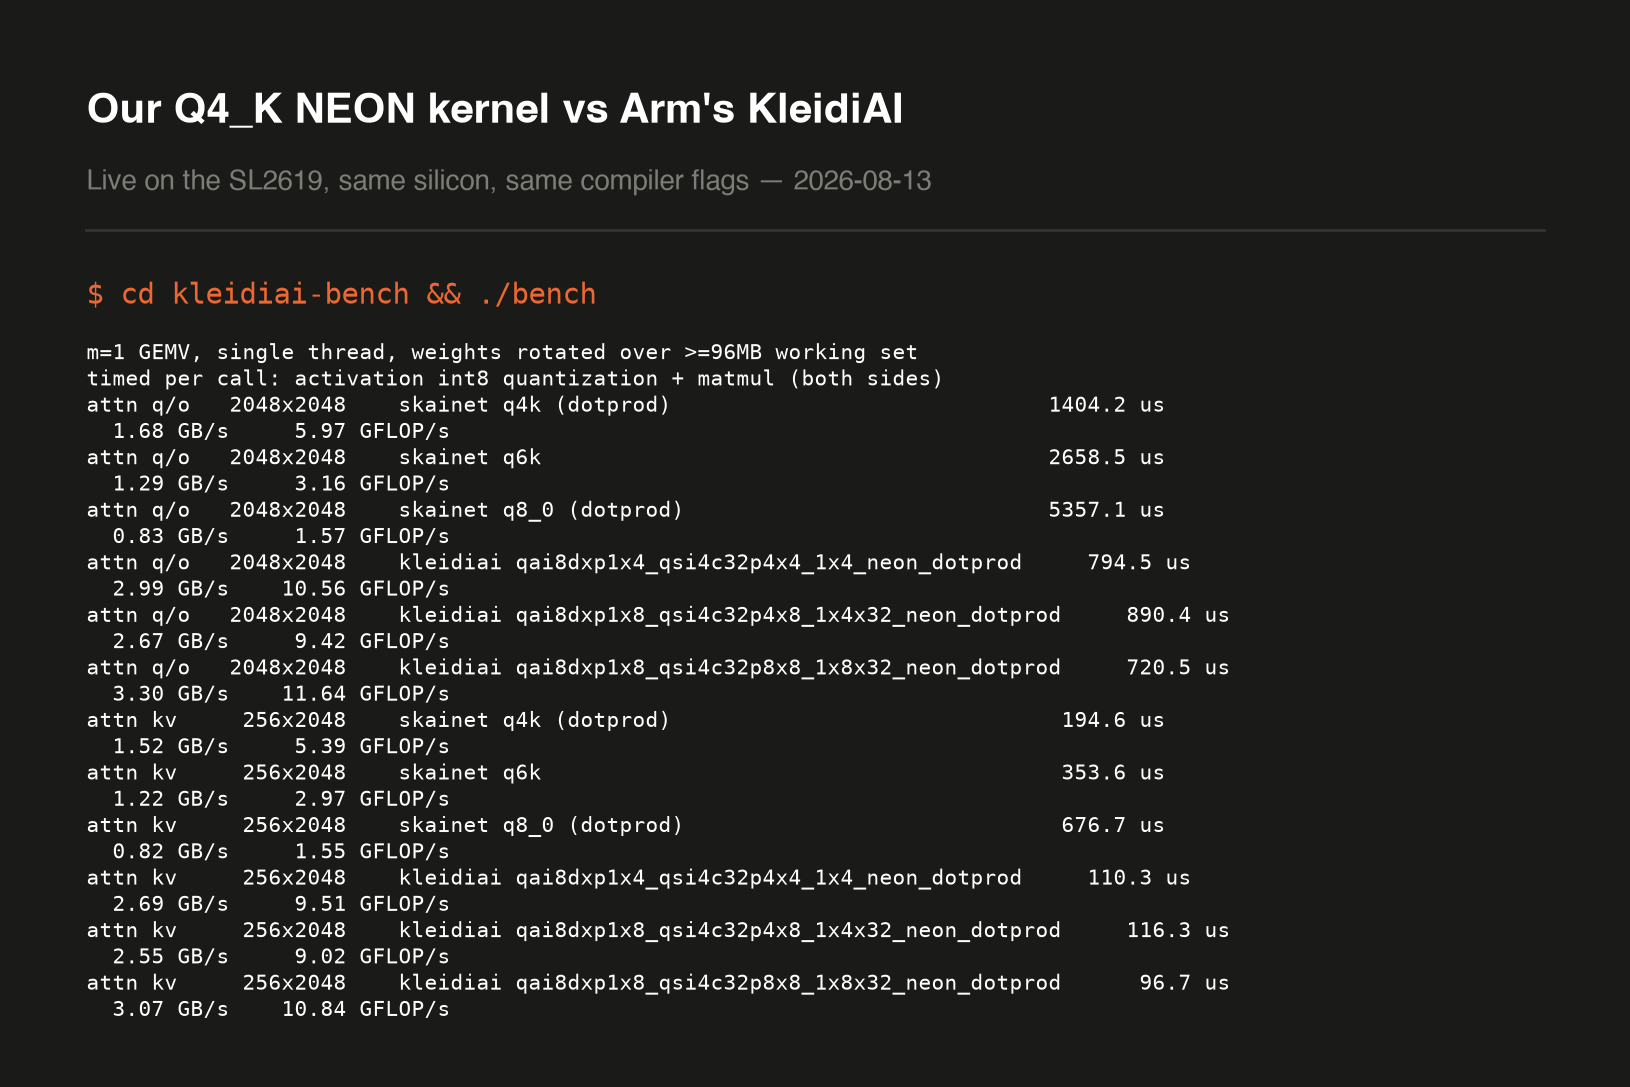
Our kernel vs Arm's KleidiAI, live on the board
-
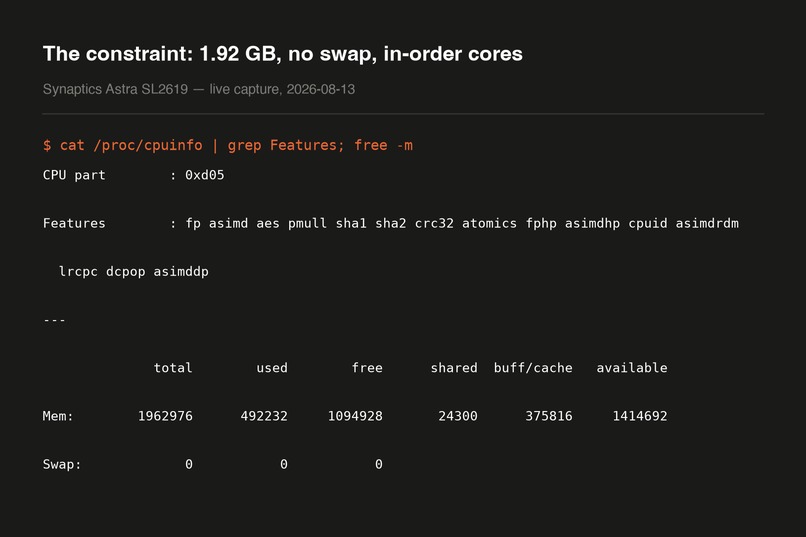
Live capture from the board
-
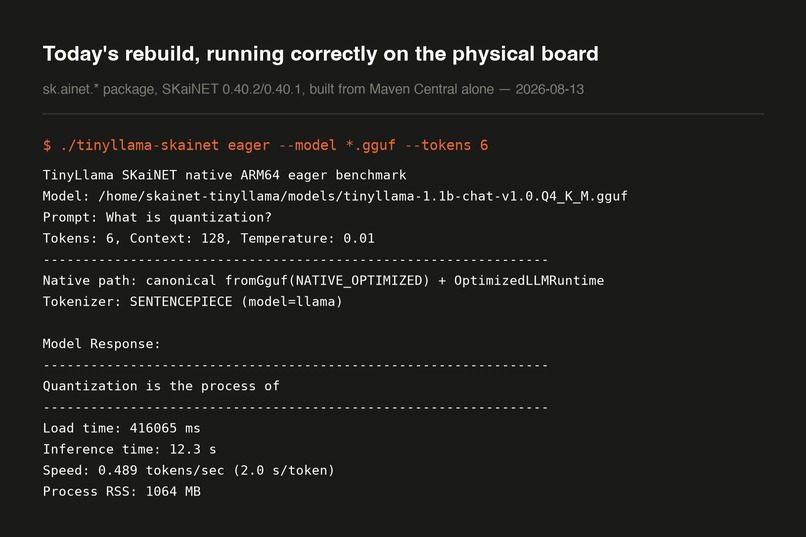
Fresh rebuild, correct on the physical board
-
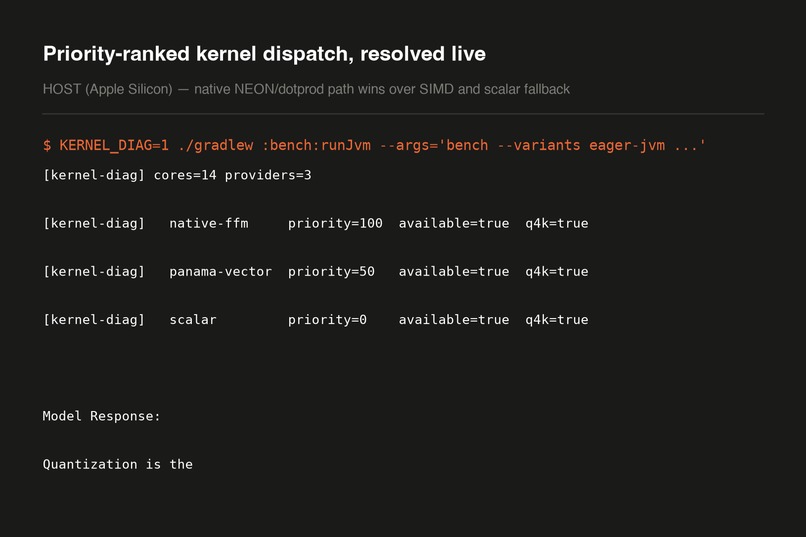
Priority-ranked kernel dispatch, resolved live
-
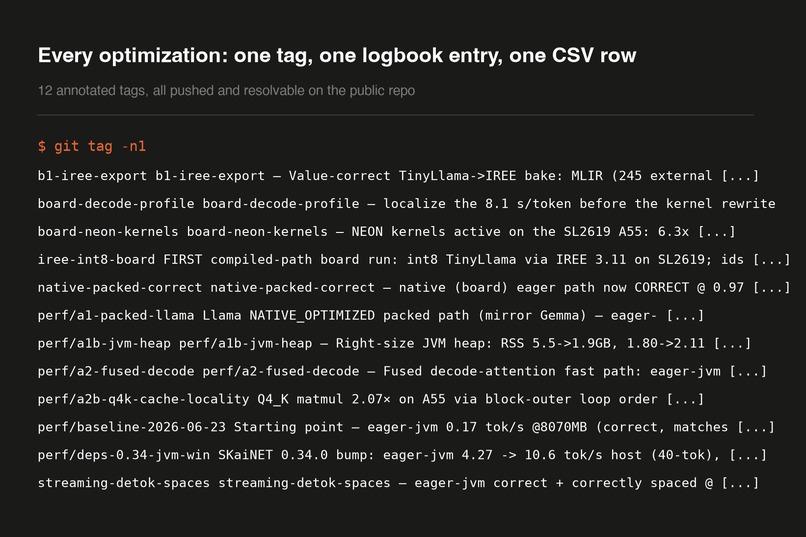
One tag, one logbook entry, one CSV row — every time
Inspiration
09:00, day one. Standup starts in the next room. Daily-StandAPP, a small tool that turns last night's commits into today's standup summary so nobody has to reconstruct what they did from memory, is asked for one. It's still computing when the meeting ends. It's still computing twenty minutes later. 0.17 tok/s. That's the honest first number for a from-scratch Kotlin LLM stack.
Daily-StandAPP runs its model locally on purpose: commit history is exactly the kind of thing you don't hand to someone else's API. It publishes a latency budget: under 8 seconds median, WARN at 8 s, FAIL at 15 s. Its own benchmark already calls its embedded SKaiNET backend the fastest local option it measures, ahead of every REST alternative, because there's no HTTP hop to pay for. That's the uncomfortable part: the fastest thing available was still nowhere close. Going to the cloud to fix it would defeat the entire reason the tool exists.
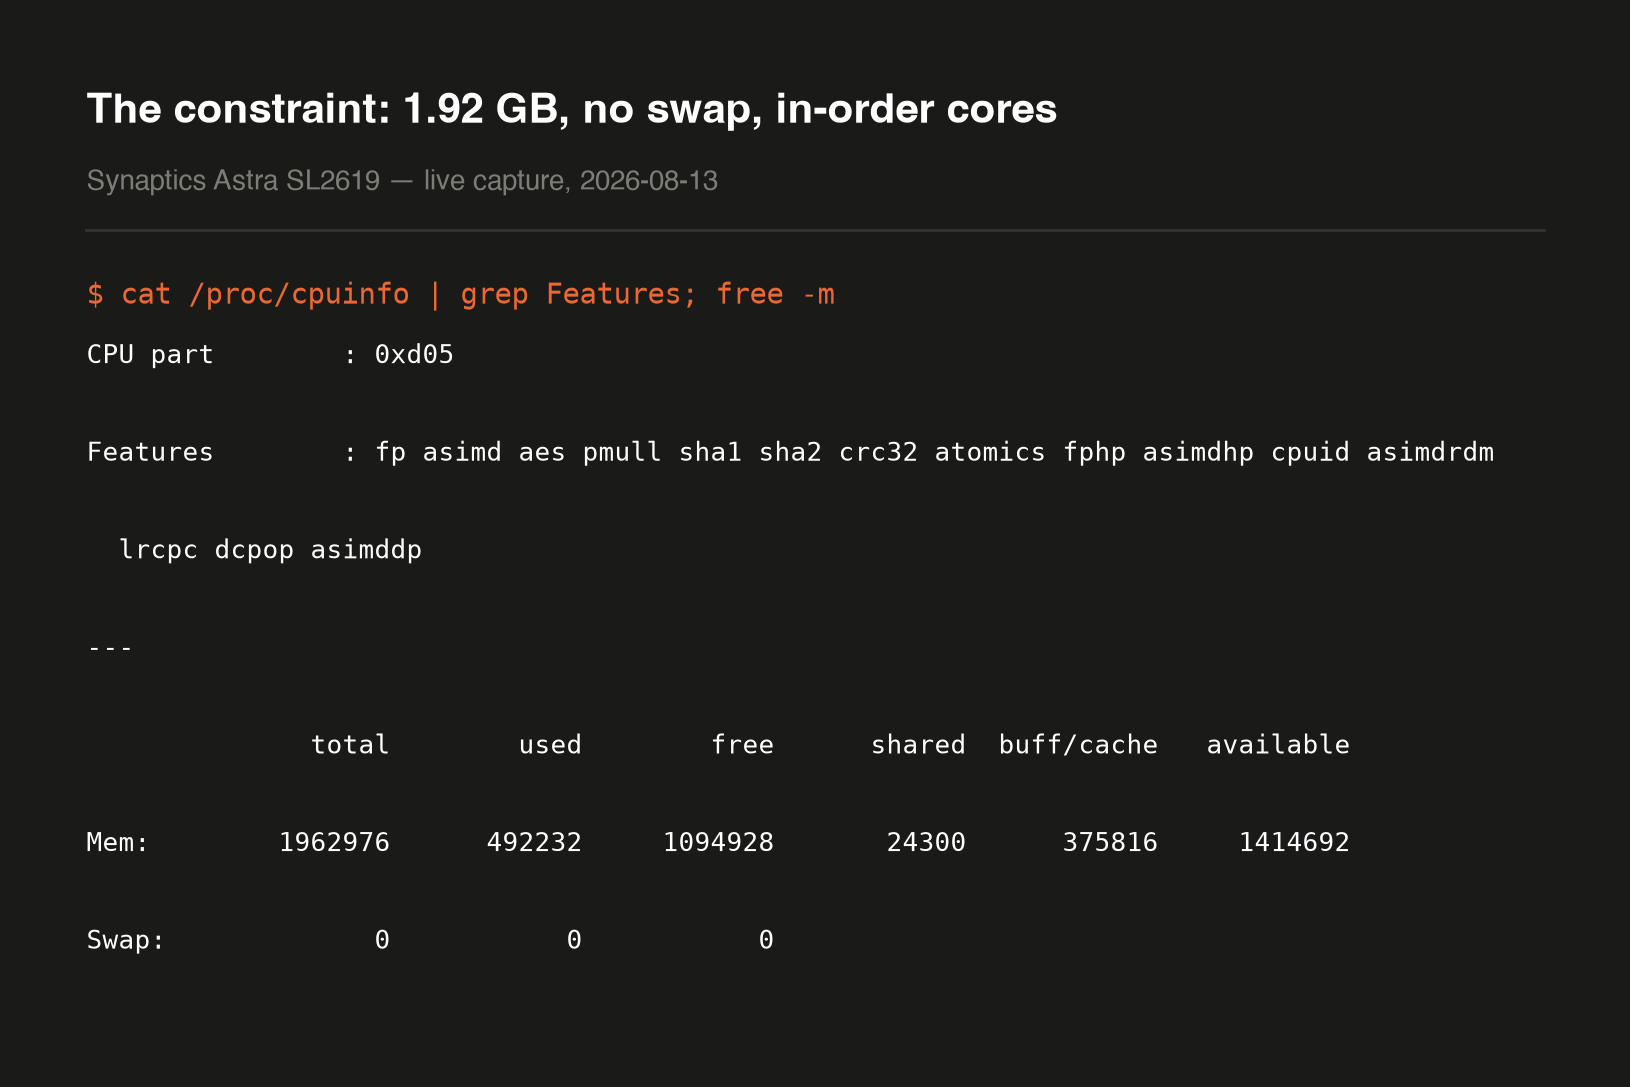
So: fix the backend, not the deadline. Then push the same workload one step further, onto a device you could leave running in a corner and forget about, where the binding constraint stops being how long you wait and starts being whether the process survives loading the model at all. Our target: a Synaptics Astra SL2619, two Cortex-A55 cores, 1.92 GB of RAM, no swap. The first board runs didn't produce a slow answer. They were OOM-killed during model load.
Methodology, stated once, used everywhere below and never quietly redefined:
$$\text{tok/s} = \frac{\text{generated tokens}}{\text{inference seconds}}$$
with load time excluded and stated separately, greedy decoding, and a fixed prompt. Every table in "How we built it" cites this same definition. HOST and BOARD numbers are never computed differently, and are never compared to each other (see below).
What it does
This is a Physical AI entry: the target is a physical edge device, and the constraint that shapes every decision below is that device's 1.92 GB of RAM with no swap.
TinyLlama-1.1B (GGUF Q4_K_M) runs on that board through a from-scratch Kotlin stack, by two independent paths:
- Eager: Kotlin Multiplatform compiled by Kotlin/Native straight to a
linuxArm64executable, reading GGUF weights in their packed quantized form (Q4_K/Q6_K blocks are never expanded to FP32) and dispatching to hand-written Neon kernels through a priority-ranked kernel registry. - Compiled: the model graph exported from SKaiNET's NN DSL to StableHLO MLIR, compiled by
IREE to an aarch64 module, executed on-device by
iree-run-module.
They validate each other. Both emit the same token ids (29901, 1724, 338, 278), and because
they share no execution machinery, that agreement is a far stronger correctness signal than either
path checked alone. It became the project's numerical ground truth.
How we built it
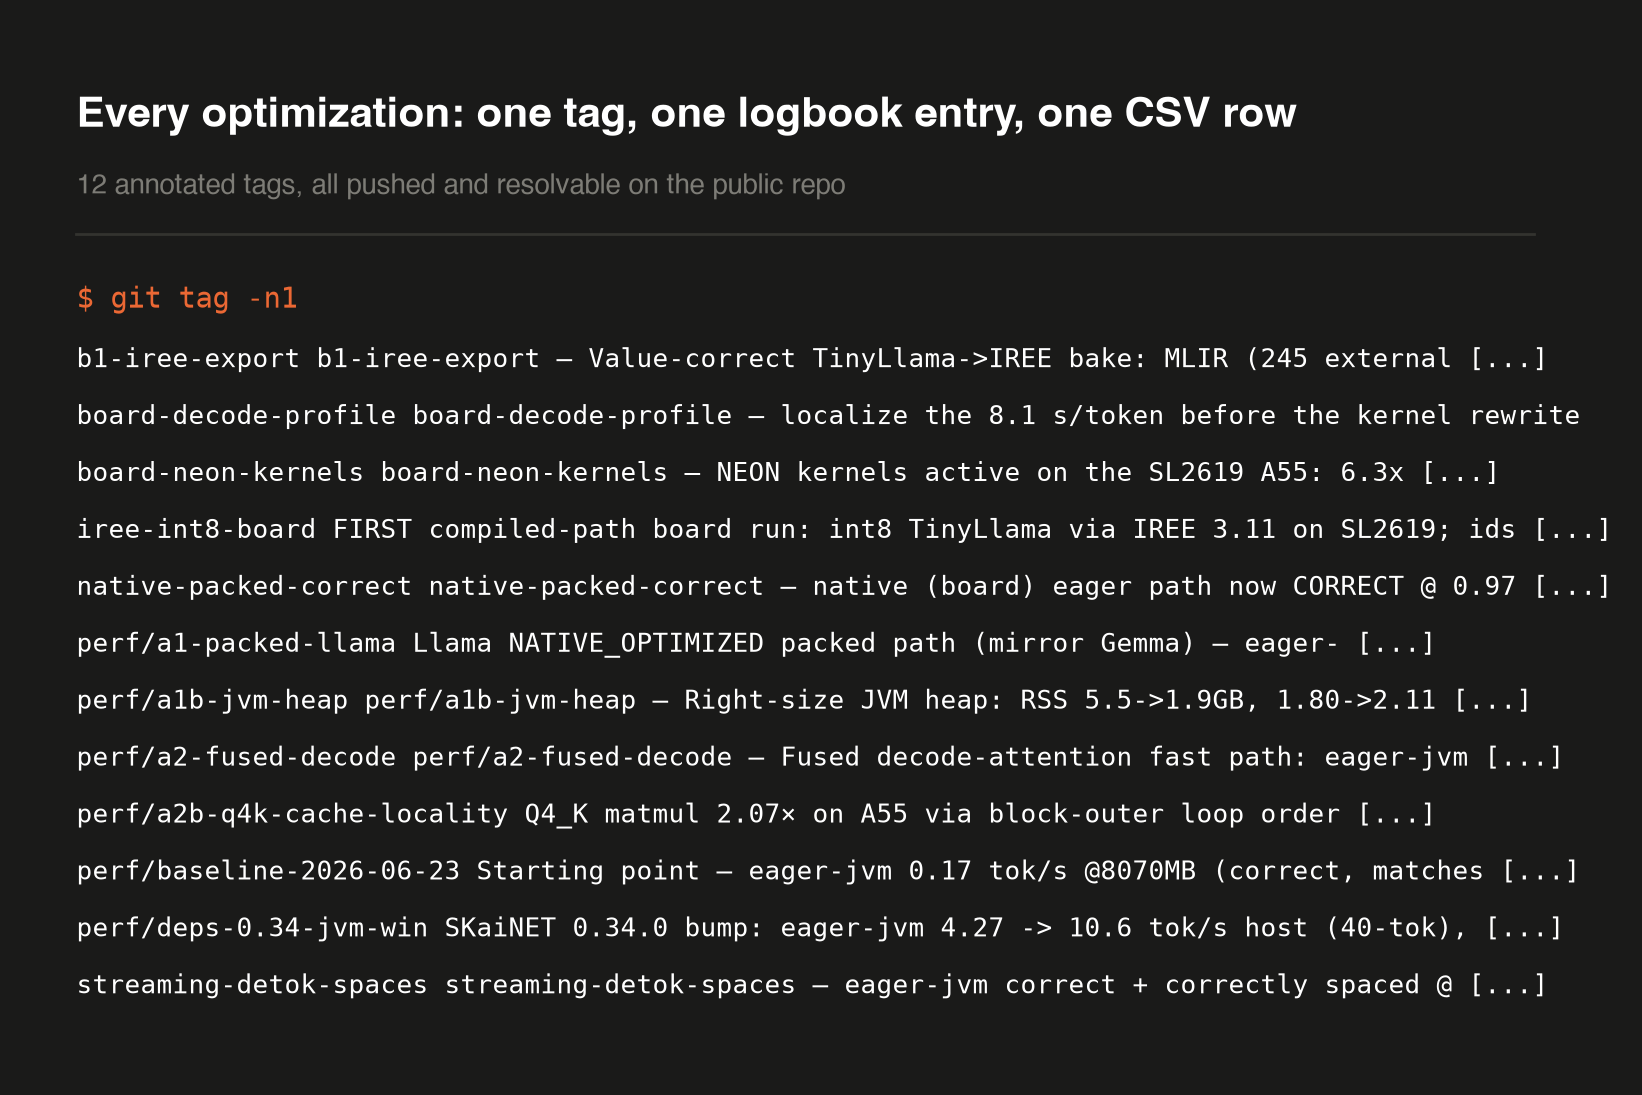
Every row below is an annotated git tag, a logbook entry stating mechanism and reproduction
command, and a row in docs/perf-history.csv, measured with the tok/s definition from
Inspiration, never redefined per table. HOST and BOARD are different classes of machine and are
never compared to each other: llama.cpp itself runs 35× slower on the board than on the host,
so mixing them would make every number meaningless.
HOST: Apple Silicon, TinyLlama-1.1B Q4_K_M, greedy
The tier the application actually runs on.
| Change | Mechanism | Result | Tag |
|---|---|---|---|
| Starting point | canonical loader dequantizes the entire model to FP32 | 0.17 tok/s @ 8.07 GB | perf/baseline-2026-06-23 |
| Keep weights packed | quantized blocks never expanded; matmul consumes them in place | 1.80 tok/s @ 5.50 GB, 10.6× | perf/a1-packed-llama |
| Right-size the heap | -Xmx12g → 2g; the 5.5 GB was JVM headroom, not working set |
2.11 tok/s @ 1.94 GB, faster and 2.8× smaller | perf/a1b-jvm-heap |
| Fused decode attention | 3.82 tok/s (40-tok) | perf/a2-fused-decode |
|
| Streaming detokenization | 4.27 tok/s | streaming-detok-spaces |
|
| Upstream engine work | inherited through a version bump, no local change | 10.6 tok/s @ ~2.2 GB | perf/deps-0.34-jvm-win |
62× faster at 3.7× less memory, and every step of it is a data-movement decision rather than an arithmetic one.
09:00, sixty-two days later. Same standup, same question. The answer lands at 09:00:19. Everyone in the room is already talking, but for the first time "still waiting" is something you can watch tick down in seconds, not something you give up on and summarize from memory instead. Daily-StandAPP still misses its own 8-second budget. It misses it by 2.4×, not by 150×.
But 09:00:19 still needs a laptop: one that's awake, plugged in, not asleep at 08:58, with a battery that can take an LLM decode loop without complaint. The version of Daily-StandAPP that actually disappears, that you stop thinking about because it's just always there, running on something the size of a deck of cards and asking nothing of your laptop or your battery, has to live somewhere smaller. That's the board.
BOARD: SL2619, 2× Cortex-A55, 1.92 GB, no swap
Here the first win is not a speedup at all.
| Change | Mechanism | Result | Tag |
|---|---|---|---|
| First attempt | raw and packed tensors both resident during load | OOM-killed, ~3.2 GB peak | board-oom-load |
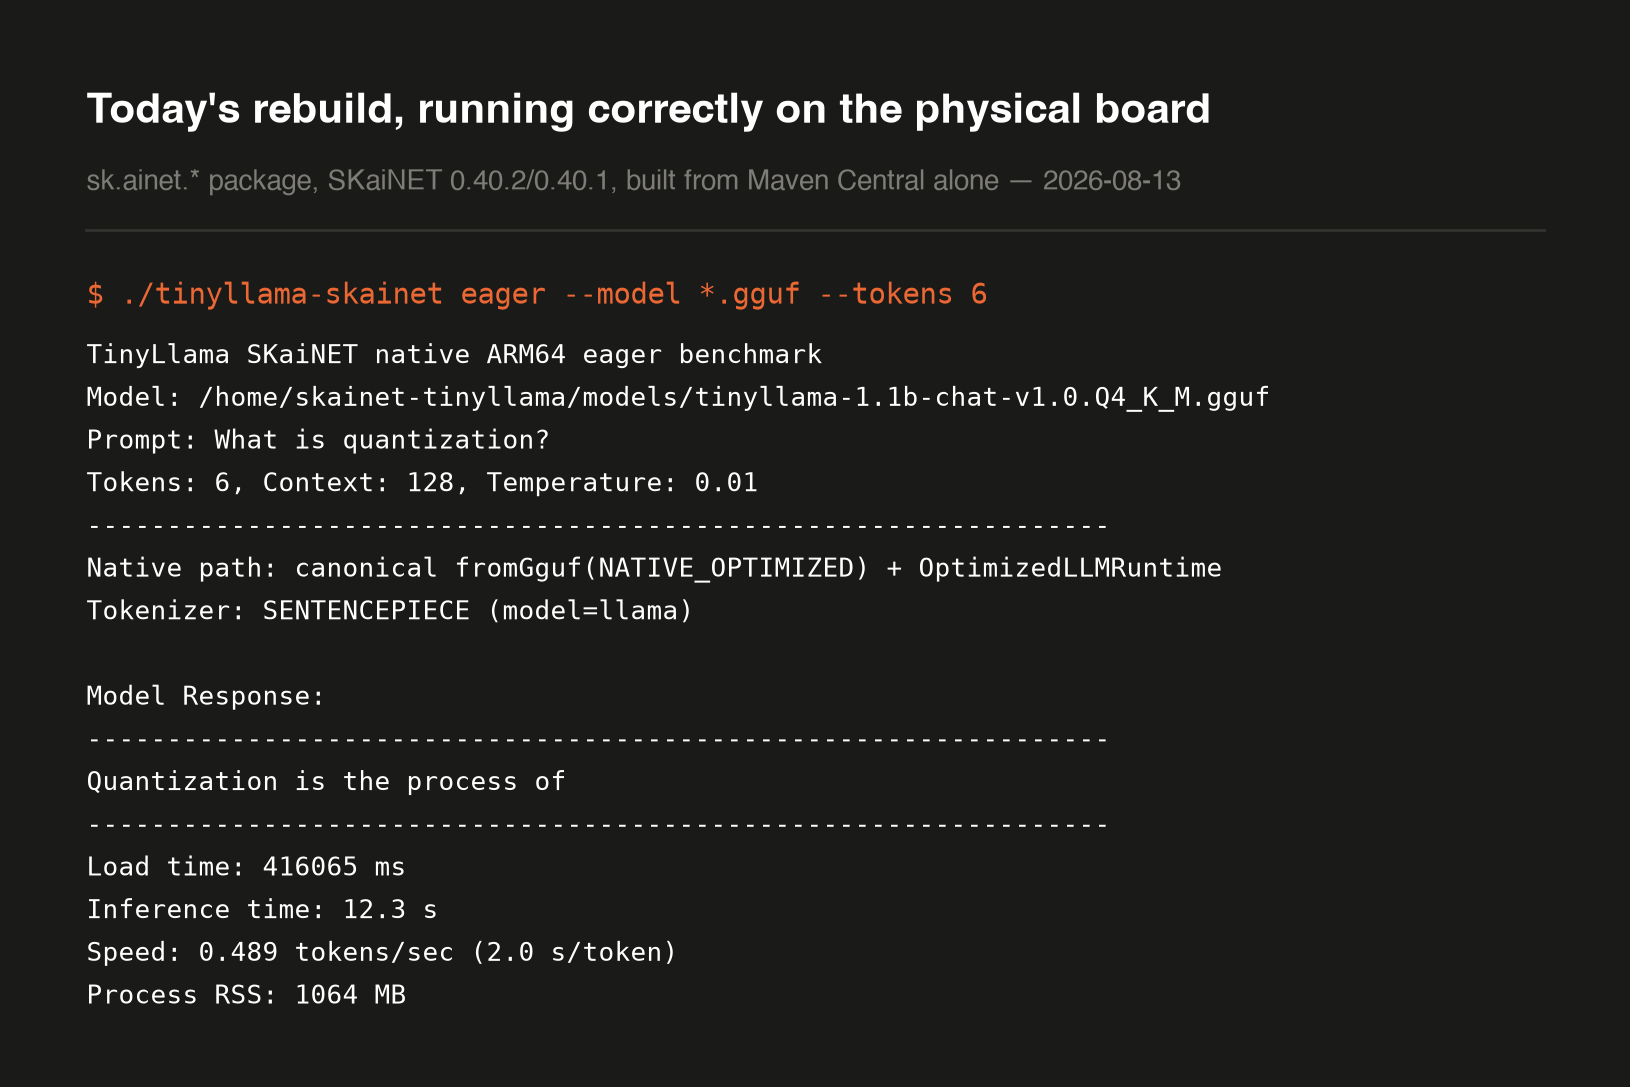
| Fuse load and packing | pack during the streaming load; raw bytes never accumulate | fits: 1.48 GB peak, 992 MB steady, correct output at 51 s/token | board-run-fused-fits |
| Neon kernels | vdotq_s32/SDOT integer dot products over packed GGUF blocks, compiled on-board |
51 → 8.1 s/token, 6.3× | board-neon-kernels |
| Cache-locality reorder | block-outer loop order so weight bytes stream strictly sequentially; numerically identical output | matmul 41.7 → 20.1 s (2.07×); 8.1 → 5.4 s/token | perf/a2b-q4k-cache-locality |
| Compiled path on-board | int8 quantization to fit the memory budget: 4.2 GB FP32 → 1.1 GB .irpa |
correct; ids identical to eager | iree-int8-board |
A workload that gets OOM-killed has no tok/s. Going from killed to correct is not a percentage; it is the difference between the project existing and not existing.
Proving an optimization is safe before writing it
The Q4_K inner loop performs eight cross-lane reductions per (block, row), expensive on an
in-order core. They collapse to one if the sub-block scale is folded in the integer domain
instead of after converting to float. That is only legal if nothing overflows int32. With
activations quantized to int8 so \(|a_i| \le 127\), 4-bit weight nibbles \(w_i \in [0, 15]\), 32
elements per sub-block, a 6-bit sub-block scale \(s \le 63\), and 8 sub-blocks per block:
$$\left| \sum_{b=1}^{8} s_b \sum_{i=1}^{32} a_i w_i \right| \;\le\; 8 \times 63 \times 32 \times 127 \times 15 \;=\; 3.07 \times 10^{7} \;\ll\; 2^{31} - 1 \approx 2.15 \times 10^{9}$$
About 70× of headroom, so the reordering is provably bit-exact rather than approximately equal, which is what makes it safe to ship without re-validating end-to-end output.
Stated precisely, because the distinction matters: this is the analysis that qualifies the
optimization, and the kernel is on the roadmap rather than in the ledger above. Today's kernel
parity tests assert a relative-RMS bound (1e-2) against the scalar reference, not exact
equality; tightening them to exact equality is part of landing this change, not a claim we make
in advance of it.
The same discipline set expectations for threading. With the decode profile measuring the quantized matmul at \(p = 0.46\) of a token, Amdahl bounds a perfect 2-core split at
$$S \le \frac{1}{(1-p) + \dfrac{p}{2}} = \frac{1}{0.54 + 0.23} \approx 1.30\times$$
which is why we ranked profiling the 54% runtime tail above parallelising the matmul, rather than reaching for threads first because threads feel like the obvious answer.
The developer workflow, not just the decode loop
Not every optimization shows up in tok/s, and on this hardware the workflow costs were large enough to shape which experiments were affordable at all.
- Model load takes 232 seconds on the board, pack-bound. That is the tax on every board iteration, and it is why the mmap-native layout is the next memory item rather than a nice-to-have: it targets the load, not the decode.
- Kernels are validated on the laptop, twice, before the board sees them. Host and board share
an ISA, so a kernel is checked through the JVM's FFM bindings against a reference implementation
and again as a
macosArm64native binary. By the time it reaches the board, ISA-level correctness is settled and only microarchitecture is in play. - Adding a kernel is a registration, not a fork. The
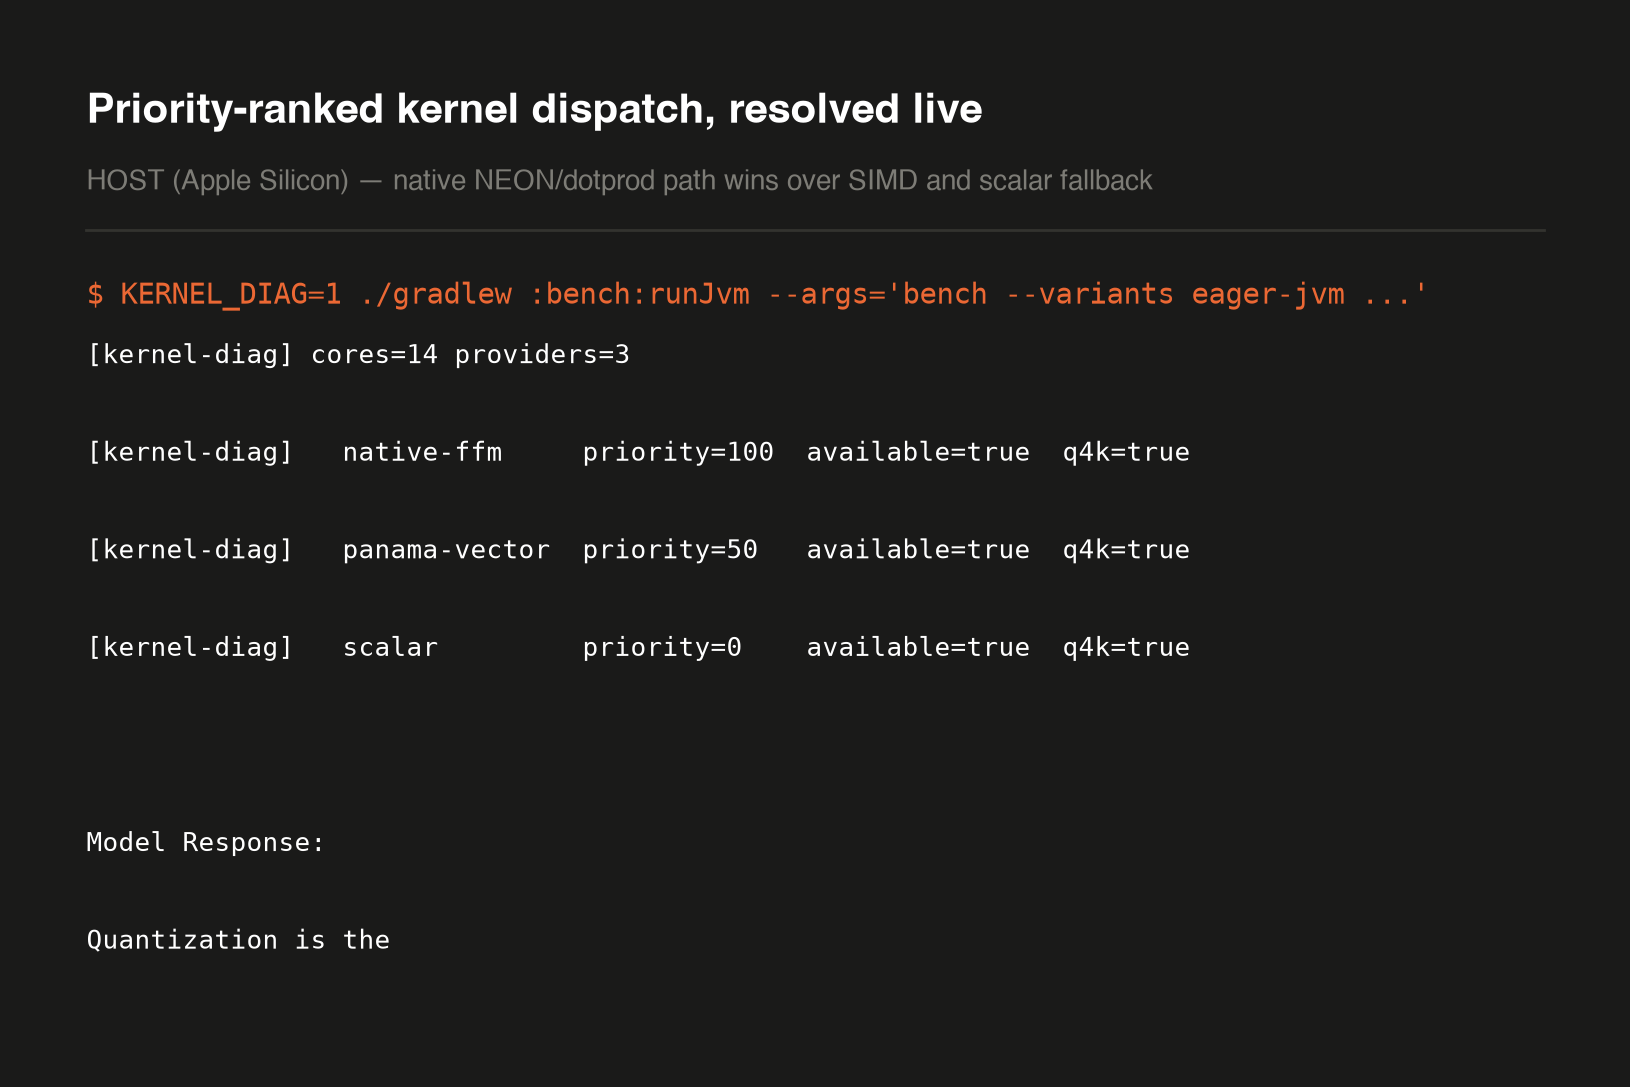
KernelProvider/KernelRegistrySPI ranks implementations by priority (scalar 0 / Panama Vector 50 / native Neon 100) with per-format nullable accessors, so an unimplemented quantization format degrades to the tier below instead of failing. - Diagnosis is an environment variable, not a rebuild.
SKAINET_PROFILE=1produces the named-bucket decode profile;KERNEL_DIAG=1prints which kernel provider actually resolved. - One win = one command.
scripts/perf-log.shruns the benchmark, appends the logbook entry and the CSV row, and offers the annotated tag. The ledger above is its output; the discipline is enforced by tooling rather than by intention.
Memory before speed, and one ISA end to end
With 1.92 GB and no swap, the fastest wrong answer is an OOM kill. The first optimization that
mattered was not a kernel: it was fusing load and packing so raw bytes never accumulate. We
validated it on the host first, peak RSS 3.23 GB → 1.81 GB (fused-load-pack-result),
specifically to confirm it would clear the 2 GB board budget before spending a board iteration
on it. It did, and the board run that followed landed even lower, 1.48 GB peak / 992 MB
steady (board-run-fused-fits, the BOARD table above): different hardware, different runtime,
not a discrepancy. Before this fix, board attempts didn't produce a slow answer; they died during
model load, every time.
The development machine is Apple Silicon; the target is a Cortex-A55. Both are AArch64, so the same Neon kernels compile and run natively on both, and the decode loop that ships to the board is the same one debugged on a laptop with no 232-second model loads per iteration. It turns an embedded workflow into a desktop one.
Challenges we ran into
The in-order A55 tells the truth, painfully. No out-of-order machinery to hide a cache miss means your memory access pattern is your performance. Our packed layout stored blocks such that computing one output row touched weight bytes ~295 KB apart: invisible on an Apple Silicon host whose large caches absorbed it, devastating on the A55. Inverting two loops so the kernel reads sequentially (no new instructions, no new arithmetic, identical output) doubled matmul throughput. The counter-experiment is what proved the diagnosis: the same reorder on Q6_K gave exactly zero, because Q6_K is bound by a scalar 6-bit unpack rather than by memory.
Silent failure is the expensive kind. Kotlin/Native has no ServiceLoader, so a missed
kernel-installation call silently falls back to scalar kernels and costs 10×, with no error, no
warning, nothing. We lost real time to this on the board path, and later found the same class of
bug on Apple Silicon too (see Accomplishments; that one, we turned into a 49× win). The runtime
now prints which kernel provider it resolved at startup, and the correctness script asserts on it.
Every perf claim rested on an eyeballed correctness check. The parity script literally ended with a comment asking a human to compare two lists of token ids. During this window that became a golden-fixture gate with tolerances, emitting the same JSON schema from all three execution paths and exiting non-zero on drift.
Three entries in our own performance log are failures, and we kept them. The int-dot rewrite that changed matmul time by exactly 0 ms (41,730 → 41,730 µs). The cache-locality reorder that won 2.07× on Q4_K and nothing on Q6_K, because Q6_K is dequant-compute-bound rather than memory-bound, which told us precisely which kernel to stop optimizing and which to rewrite. And the decision not to adopt Arm's own KleidiAI kernels (next section). A benchmark ledger with no negative results is not a ledger.
Accomplishments that we're proud of
The result we're proudest of is one we lost
We compiled Arm's own KleidiAI dot-product micro-kernels on the board, with our exact compiler flags, and benchmarked them head-to-head against our Q4_K kernel at real TinyLlama decode shapes. They beat us by 1.95×.
The comparison is in effective weight-streaming bandwidth, since decode at batch 1 is memory-bound: for \(W\) bytes of packed weights streamed per call in time \(t\):
$$B_{\text{eff}} = \frac{W}{t} \qquad\Longrightarrow\qquad B_{\text{ours}} = 1.7\ \text{GB/s}, \quad B_{\text{KleidiAI}} = 3.3\ \text{GB/s}$$
That number is also what told us the kernels are scheduling-bound, not DRAM-bound: Arm's own code reaches 3.3 GB/s single-threaded on the same silicon, so the memory system has at least 2× headroom we are not using.
So we did not vendor KleidiAI. We made it the yardstick, because our Q4_K keeps the per-32
asymmetric minima that KleidiAI's symmetric qsi4c32 format discards, and there is no Q6_K
equivalent at all. Adopting it would have traded numerical fidelity for speed, silently. Matching
Arm's hand-scheduled assembly at higher quantization fidelity is a strictly stronger result than
adopting it, and 3.3 GB/s is now our published target. The harness is in the repo: one cc
line, any AArch64 machine with asimddp, about 90 seconds.
killed → correct, then killed → correct again
The board's first milestone wasn't a speedup at all; it was surviving model load (~3.2 GB peak
→ OOM-killed, then 1.48 GB peak → correct output). Sixty-two days later we found the same shape
of bug in an unexpected place: Kotlin/Native eager on Apple Silicon was silently running the
plain scalar kernel for the whole decode hot path. Accelerate only accelerates dense FP32
matmul, and the quantized path fell through with no warning at all. SKaiNET shipped a real macOS
Neon archive one day before we noticed; wiring it in (two files, mirrors the board path) took
that path from 0.52 to 25.6 tok/s, now the fastest measured on this host. Correct output,
unchanged. Tagged perf/apple-neon-macos.
09:00, the board's morning, for now. Standup starts. Daily-StandAPP, running on the laptop, still answers first. The board doesn't answer in time to matter yet, but seven weeks ago it didn't answer at all, because it didn't survive long enough to try. Doesn't survive to survives, correctly, and simply isn't fast enough yet is the gap this project actually closed. The other gap, fast enough, is next.
What this bought, against Daily-StandAPP's own numbers
Measured against Daily-StandAPP's own published budget, using its own fixed benchmark parameters
(temperature=0.1, topP=0.9, maxTokens=512):
| tok/s | ~200-token summary | vs the 8 s SLO | |
|---|---|---|---|
| First correct | 0.17 | ~20 min | impossible |
| Today | 10.6 | ~19 s | misses by 2.4×, not by 150× |
| llama.cpp, same host | 98.9 | ~2 s | the yardstick |
62× moved the feature from impossible to impatient. The 8-second budget is still not met, and
we know exactly what the remainder is made of. On the board we do not quote that SLO at all: 5.4
s/token cannot produce an 8-second summary, and pretending otherwise would poison every other
number here. Our honest position: llama.cpp on the same board does 2.8 tok/s at 0.70 GB. We are
behind it, by 15×, measured at perf/a2b-q4k-cache-locality and unchanged this window, because
this window bought reproducibility rather than speed. The remainder is ~46% quantized Neon matmul
and ~54% runtime tail, both measured, both attributed to named buckets.
Two pieces of this are no longer ours to claim
PhaseProfile and the fused load+pack path were merged upstream into SKaiNET-transformers
(PR #220). Every SKaiNET user targeting Arm now gets the memory fix and the profiler without
depending on this repository at all, which is the outcome we wanted, and the reason this project
pinned an unreleased branch for weeks rather than forking.
Reusable artifacts
Things another developer can take and use, in priority order:
- The Arm kernel yardstick: benchmark your quantized kernels against Arm's KleidiAI on
your hardware. One
ccline, documented fairness rules, ~90 seconds. - Five Neon kernels for the ggml block formats (Q4_K, Q5_K, Q6_K, Q8_0, Q4_0), operating directly on packed storage, bit-exact against their scalar references.
- The
KernelProvider/KernelRegistrySPI: priority-ranked dispatch (scalar 0 / Panama Vector 50 / native Neon 100), per-format nullable accessors, clean degradation. PhaseProfile: env-gated named-bucket decode profiling, which is why the 46/54 split above is a measurement rather than a guess.- The perf-log protocol: one win = one annotated tag + one logbook entry + one CSV row, with negative results logged identically. The ledger above is its output.
- The GGUF → StableHLO → IREE runbook, including the 3.10/3.11 bytecode-version trap.
- SL2619 / Yocto bring-up notes: the
libcryptshim,/tmpbeing tmpfs,oom_score_adjfor adbd. - The KleidiAI buy-vs-build evaluation, with the format-mapping table that explains why not.
What we learned
On a memory-bound workload, the first several optimizations are all data-movement decisions, and none of them look like optimization from the outside: packing, heap sizing, loop order, load fusion. The kernel work, the part that feels like optimization, does not pay until the data layout stops throwing the win away.
And on a device at 5.4 seconds per token, the highest-leverage optimization is not making tokens faster. It is needing fewer of them.
What's next for SKaiNET-native-kernels
A KV-cache decode graph for the compiled path, which currently re-prefills every step. An mmap-native weight layout to approach llama.cpp's 0.70 GB footprint. A vectorized Q6_K unpack, for which our own KleidiAI measurements bound the win at 3.7×. And the Torq NPU on the same SoC, which the IREE runtime already exposes as a device.
Updated during the submission period
This project began on 2026-06-22 and was significantly updated during the submission period. The update is not another kernel win: it is that the optimization work became reproducible by someone other than its author.
Between 2026-07-26 and 2026-08-13, on Arm-relevant dimensions the challenge names explicitly (deployment time, developer workflow, setup complexity):
- The build no longer fails from a clean clone. A dependency pin referenced a symbol that did
not exist in the published artifact, so
:eager:compileKotlinLinuxArm64succeeded only on a machine with a locally-published jar in its Gradle cache. Anyone else got a compile error. - The memory floor that excluded our own target class was removed. The build asked for an 8 GB
Gradle daemon, so a Raspberry Pi 5 or a small Graviton instance, exactly the Arm64 hardware
this project is about, could not start it. Now 3 GB, sized from the measured ~1.6 GB working
set (
gradle.properties, dated in the same commit as this line). - A specific board address was compiled into the binary. It is now required from the
environment (
ADB_SERIAL) with no fallback, so the host tiers need nothing configured and no LAN address ships in an artifact. Acheck-no-leakage.shgate scans every git-tracked file for it before anything publishes. - The project became legally usable: MIT license, full third-party notices, and the upstream Arm sample's MIT notice retained per its terms rather than credited in prose.
- A tiered reproduction ladder, each tier actually run before being written into the README:
clean-clone compile, real generation on any Arm64 host, the exact Kotlin/Native binary
technology the board runs, and the
linuxArm64board binary itself now cross-compiling from Maven Central alone (see the next bullet). - The board-specific composite build was retired. The board binary used to require a locally built copy of a sibling repo's unreleased branch: a step no clone could reproduce. The fix landed upstream in SKaiNET-transformers instead of staying a local workaround, so every consumer gets it, not just this repo.
- A dependency bump caught a real upstream correctness regression before it shipped. Updating to the newest SKaiNET core release compiled cleanly and produced deterministically wrong output, a silent bug a compile check cannot see. It was bisected to the exact upstream commit, reported by pattern rather than guessed at, held back safely for a day, and adopted once the paired fix released. The version pin's own comments now say, in the codebase itself, to re-run a correctness check on every future bump, not just a compile check: the kind of lesson that is easy to state and easy to skip.
- The kernel yardstick became runnable by others: it was cited as evidence but shipped with no build instructions, so nobody could reproduce the comparison it justified.
- The project stopped carrying its origin's internal branding. Package names and all prose now read as the independent open-source project it is.
- A silent scalar-kernel fallback on Apple Silicon got fixed, for free. Kotlin/Native eager
on macOS was quietly running the plain reference kernel for the whole decode hot path.
Accelerate only accelerates dense FP32 matmul, and the quantized path fell through to
priority-0 scalar with no warning. SKaiNET shipped a real macOS Neon archive one day before
this window's version bump; wiring it in (two files, mirrors what the board path already
does) took that path from 0.52 to 25.6 tok/s, now the fastest measured on this host.
Correct output, unchanged. Tagged
perf/apple-neon-macos. - One measurement escaped into prose without a ledger row (a 2.5× host win) and was found during this window, then given a tag, a logbook entry and a CSV row.
The full history is public, dated, and tagged. Every number in this submission traces to a row in
docs/perf-history.csv with a tag and a commit.
Arm and Neon are registered trademarks or trademarks of Arm Limited (or its subsidiaries or affiliates) in the US and/or elsewhere. SKaiNET and Kotlin are the frameworks this project is built on and named throughout; other names above are used for accurate identification only.
Built With
- kotlin
- kotlinmultiplatform
- skainet

Log in or sign up for Devpost to join the conversation.