-
-
main
-
-
-
Inspiration
As esports continues to evolve, coaches and players need faster, more intuitive ways to understand what happened in a match beyond raw statistics. Traditional post-match reviews show kills, deaths, and assists, but they don't reveal where fights happened, why certain areas became death traps, or how spatial patterns influenced round outcomes. Inspired by Moneyball's Peter Brand and the hackathon's vision of merging micro-level player analytics with macro-level strategic review, Sixth Sense was built to be the AI assistant that every esports coach needs. We wanted to create a tool that:
- Surfaces the "78% rule" — When a key player dies "for free" (without KAST contribution), teams lose ~78% of those rounds. Our tool identifies these patterns automatically.
- Visualizes the invisible, Death traps, kill zones, and positioning patterns that exist in the data but aren't visible in spreadsheets.
- Provides actionable recommendations — Not just "what happened" but "what to do about it."
What it does
Sixth Sense is a Comprehensive Assistant Coach application that analyzes VALORANT match data from the GRID API to provide spatial intelligence, personalized player insights, and strategic recommendations.
Core Features (Matching Hackathon Requirements):
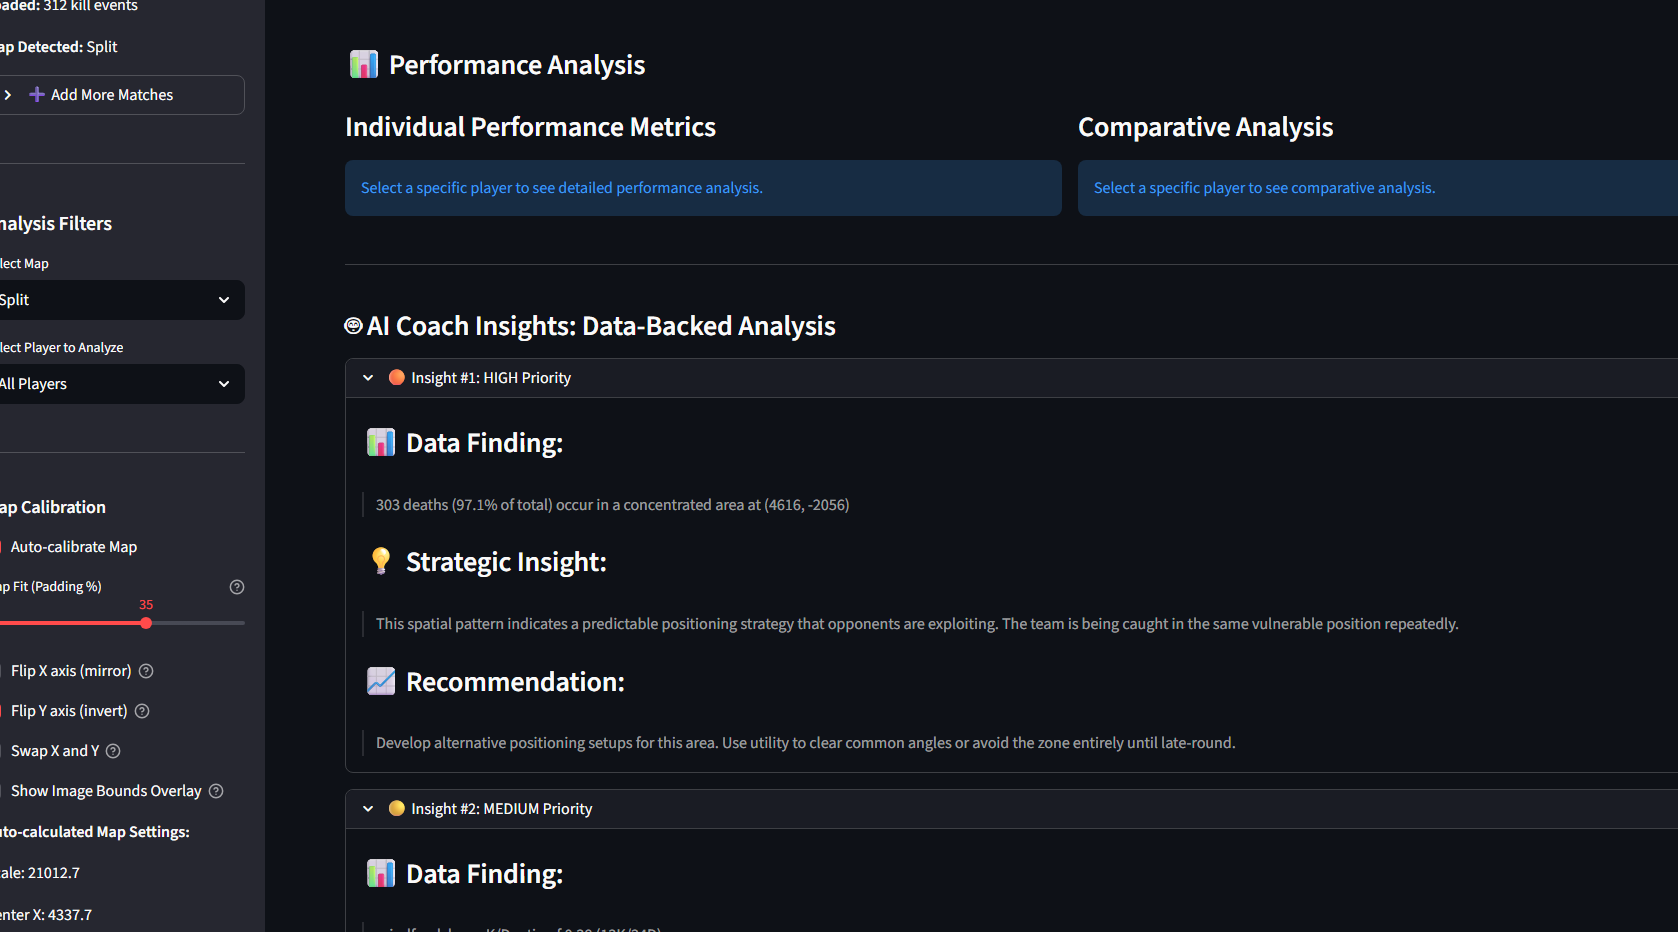
- Personalized Player/Team Improvement Insights
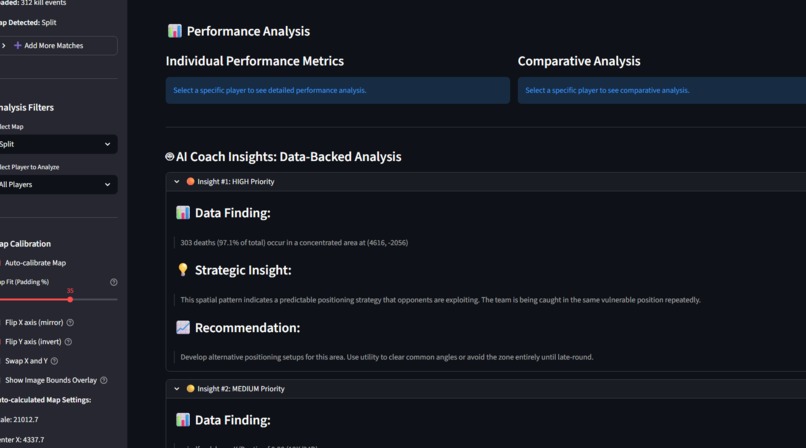
- KAST Impact Analysis: Identifies players whose early deaths cost the team rounds (e.g., "Team loses 78% of rounds when OXY dies without KAST")
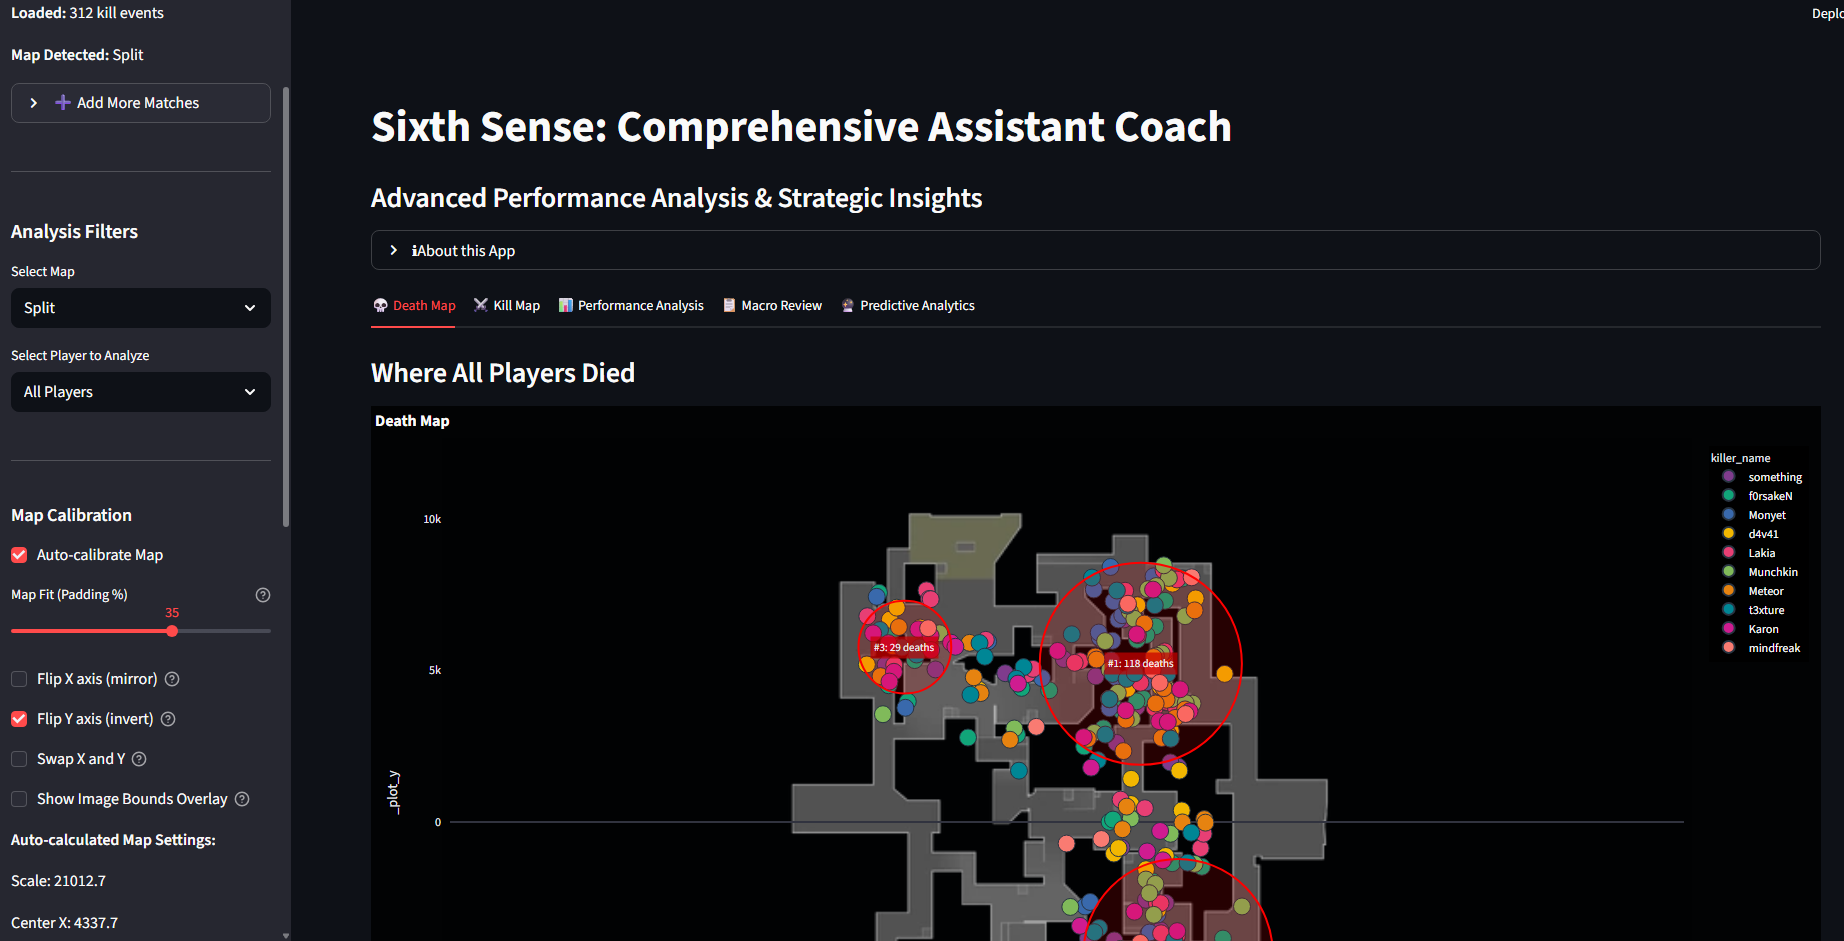
- Death Trap Detection: Uses DBSCAN machine learning to cluster death locations and identify recurring positioning mistakes
- K/D and Performance Metrics: Per-player breakdowns with comparisons to team averages
Weapon Proficiency Analysis: Tracks which weapons each player excels with
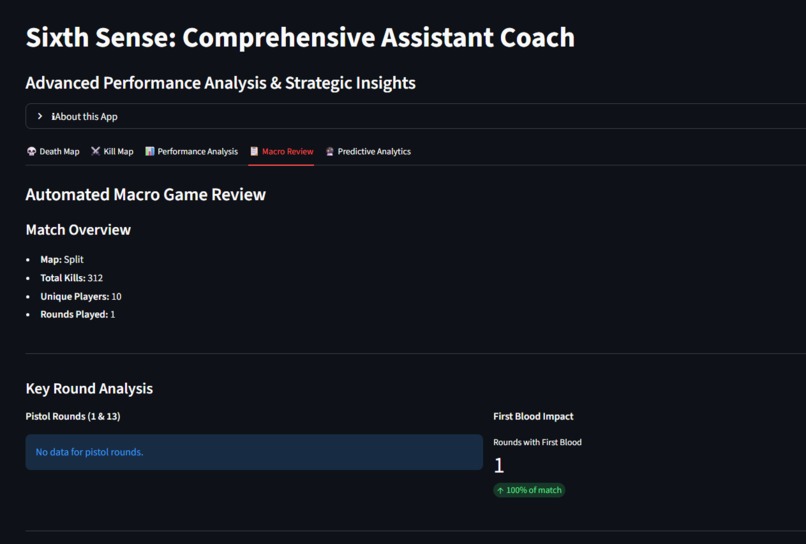
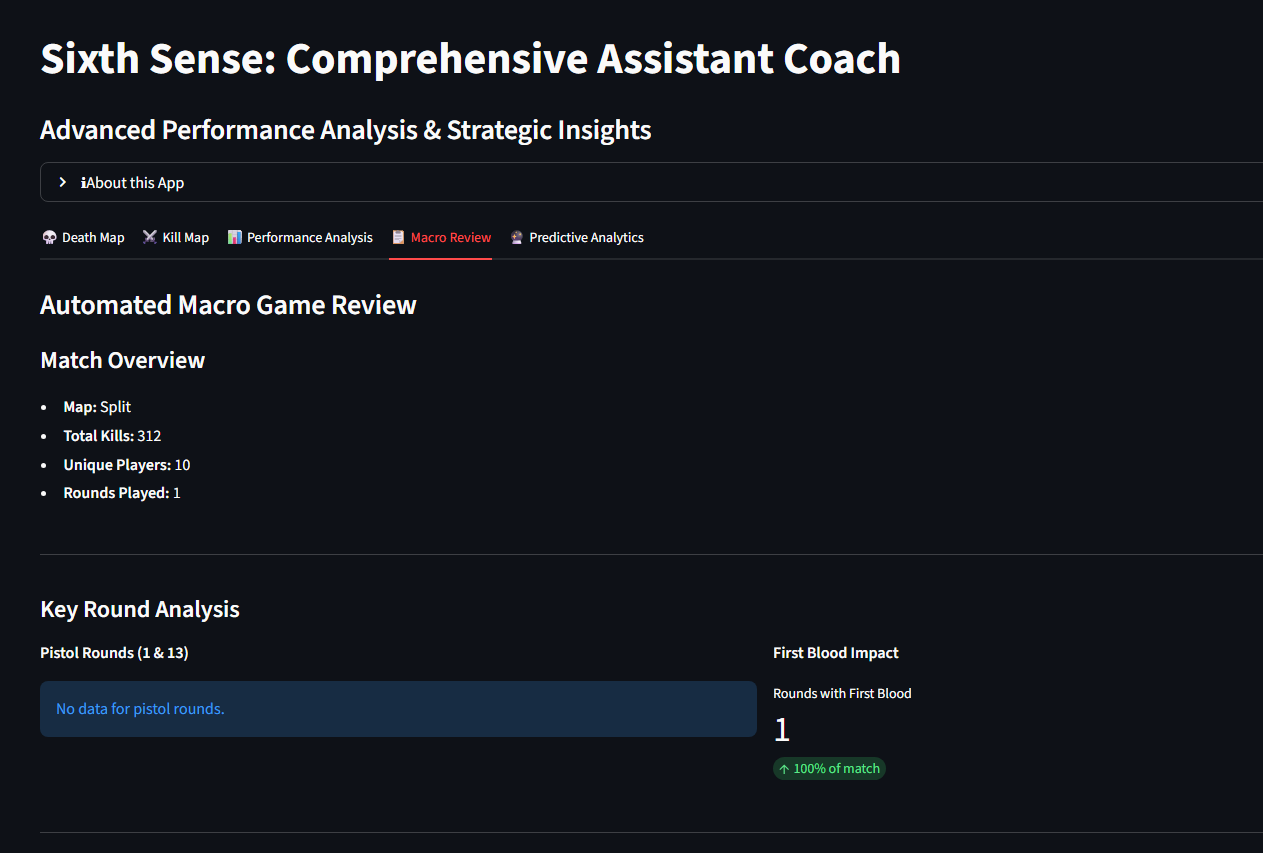
Automated Macro Game Review
Round-by-Round Analysis: First blood impact, round winners, momentum shifts
Strategic Pattern Detection: Kill zones, vulnerable positions, team-wide errors
Map-Specific Recommendations: Contextual tips for Ascent, Bind, Split, and Abyss
Data-Backed Recommendations: Actionable insights prioritized by severity (Critical/High/Medium/Low)
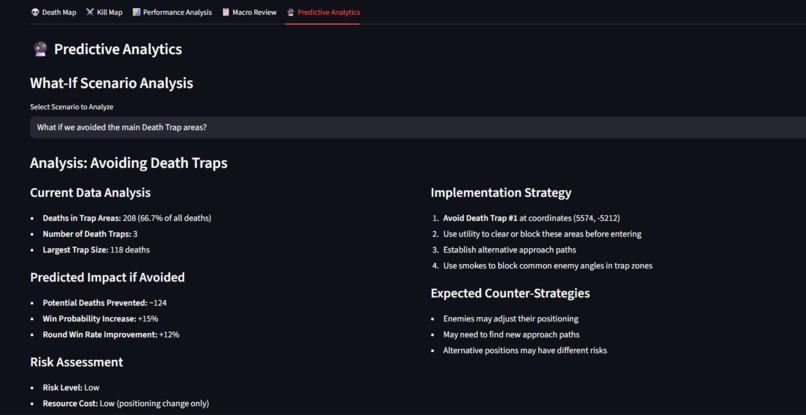
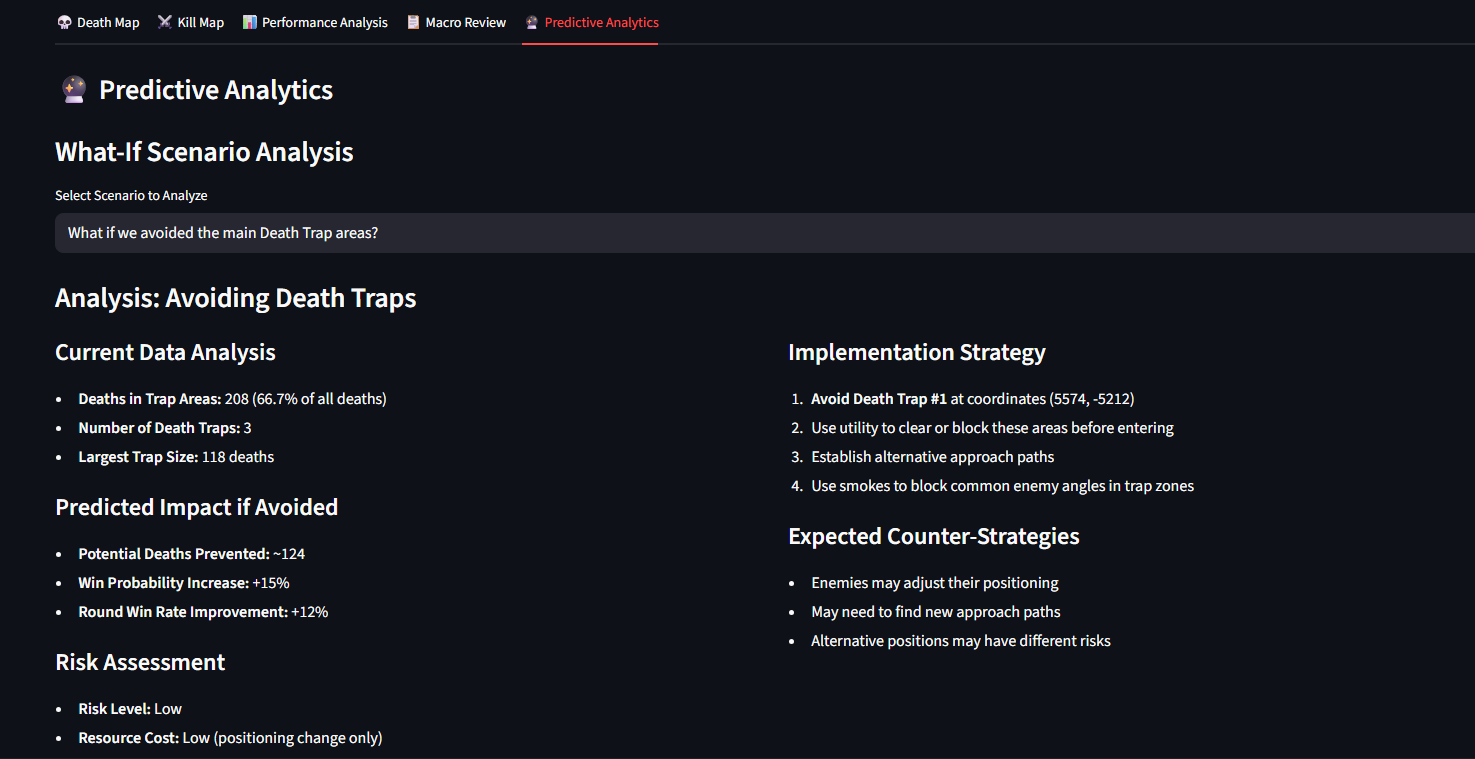
Predictive "What If" Analytics
Scenario Modeling: "What if we avoided Death Trap?" → Predicts potential rounds saved
Opening Duel Impact: "What if our most vulnerable player improved?" → Win probability changes
Trade Efficiency Analysis: Models the impact of always trading first blood deaths
Confidence Scoring: Each prediction includes a confidence level based on data quality
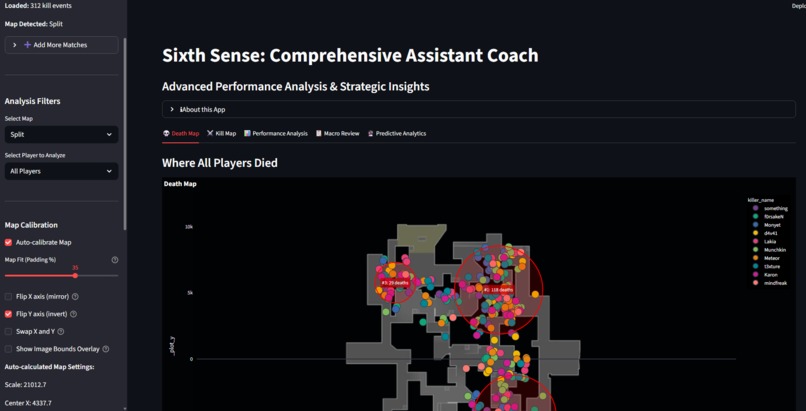
Visual Map Intelligence
Auto-Calibrated Death Maps: Machine learning-based coordinate alignment
Kill Zone Visualization: See exactly where successful engagements happen
Interactive Filtering: By player, map, round type, and more
Death Trap Overlays: Red zones highlighting dangerous areas Instead of scrolling through hundreds of rows of data, coaches can instantly see where their team is winning—and losing—fights.
How we built it
- Data Ingestion & Processing
- grid_client.py: Interfaces with GRID esports data API to fetch match information
- find_match_id.py & hunt_data.py: Locate and validate match identifiers from raw data
- process_match.py: Transforms raw match logs (data/real_match.jsonl) into structured data/match_data.csv
process_kills.py: Extracts kill events with coordinates, timestamps, weapons, and outcomes into data/kills_data.csv
Data Validation & Debugging
inspect_data.py: Sanity checks for data integrity, missing fields, and coordinate ranges
debug_kill.py: Validates kill event parsing and coordinate correctness against map boundaries
Visualization & Analysis
app.py: Main application driver that loads processed data and renders visual overlays
utils.py: Shared utilities for data loading, coordinate transformation, and caching
assets/: High-quality PNG map images for accurate spatial overlays
Development Environment Built using JetBrains PyCharm 2025.1 with Junie AI Coding Agent to accelerate development Junie helped with: Rapid prototyping of data transformation pipelines Debugging coordinate alignment issues Optimizing pandas operations for performance Structuring the project for maintainability
Challenges we ran into
Challenges we ran into
- Coordinate System Alignment Different data sources represent in-game positions differently. Aligning GRID coordinates to pixel space on our map images required:
- Manual calibration per map
- Understanding VALORANT's internal coordinate system
- Iterative testing with known kill locations
- Building validation scripts to catch misalignments early
- Data Quality & Consistency Real-world esports data isn't always clean:
- Missing or null coordinate values
- Events out of chronological order
- Inconsistent weapon names and damage types
- Edge cases like spawn kills or tactical timeouts We built robust preprocessing with validation guardrails to handle these cases gracefully.
- Performance at Scale Initial implementations read and processed files repeatedly, slowing iteration. We solved this with:
- lru_cache decorators for memoization
- Batch processing with pandas instead of loops
- Lazy loading strategies
- Centralized data manager to avoid redundant I/O
- Visualization Clarity Dense engagement clusters can become noisy and unreadable. We addressed this through:
- Dynamic map centering based on actual data bounds
- Intelligent filtering (by round, side, weapon type)
- Colour coding for context (attacker vs defender, headshot vs body)
- Adjustable zoom and padding calculations ## Accomplishments that we're proud of End-to-end pipeline: From raw GRID JSONL → processed CSV → visual map overlay
- Production-ready structure: Modular, testable, and maintainable codebase
- Debugging infrastructure: Custom validation tools that made iteration practical
- Real spatial insights: Turning coordinates into actionable coaching intelligence
- Performance optimization: Sub-second load times even with hundreds of kill events
- JetBrains + Junie integration: Leveraged AI assistance throughout development
What we learned
Technical Skills
- How to structure a data science project for real-world esports analytics
- Efficient pandas patterns for batch transformations and vectorized operations
- Coordinate system transformations and spatial data visualization
- Building validation-first pipelines for messy real-world data ### Domain Knowledge
- How professional esports teams analyze match data
- The importance of spatial context in tactical FPS games
- What metrics actually matter to coaches vs. what looks impressive
- How to balance technical depth with usability ###Development Workflow
- How AI coding agents (Junie) can accelerate prototyping and debugging
- The value of inspection/debugging scripts alongside production code
- Iterative validation is faster than "big bang" testing
- Clear separation of concerns makes complex projects manageable ## What's next for Sixth Sense ### Short-term Improvements
- Multi-match support: Batch process all matches in data/matches/ and generate comparative reports
- Enhanced filtering: Add UI controls for agent, round, weapon, site (A/B), and attacking/defending side
- Heatmap generation: Aggregate kills across multiple matches to identify consistent hotspots
- Distance-based insights: Automatically flag long/short-range engagement patterns per player ### Medium-term Features
- Time-based playback: Animate engagements round-by-round to show spatial flow
- Player-specific views: Filter to individual players and track their positioning patterns
- Trade analysis: Identify when kills are traded vs. "deaths for free" (KAST metric)
- Automatic insight generation: Use LLMs to generate natural language coaching recommendations ### Long-term Vision
- League of Legends support: Expand beyond VALORANT using GRID's LoL datasets
- Predictive "what-if" modeling: Simulate alternative decisions (e.g., "What if we stacked A site?")
- Live match integration: Real-time analysis during matches for adaptive coaching
- Team collaboration features: Shared annotations, comments, and review sessions
- Mobile companion app: On-the-go review for coaches between matches
Built With
- grid
- junie
- numpy
- pandas
- pillow
- plotly-express
- pycharm
- python
- scikit-learn
- streamlit

Log in or sign up for Devpost to join the conversation.