Inspiration
Recently, Big Tech companies have faced huge amounts of controversy about the incredibly high energy uses of data centers and their impacts on surrounding communities. Our product aims to assist with this issue by scientifically identifying the optimal locations for renewable energy to maximize operational efficiency and allows a dialogue to open between corporations and the communities they affect by creating a framework for planning out future development.
What It Does
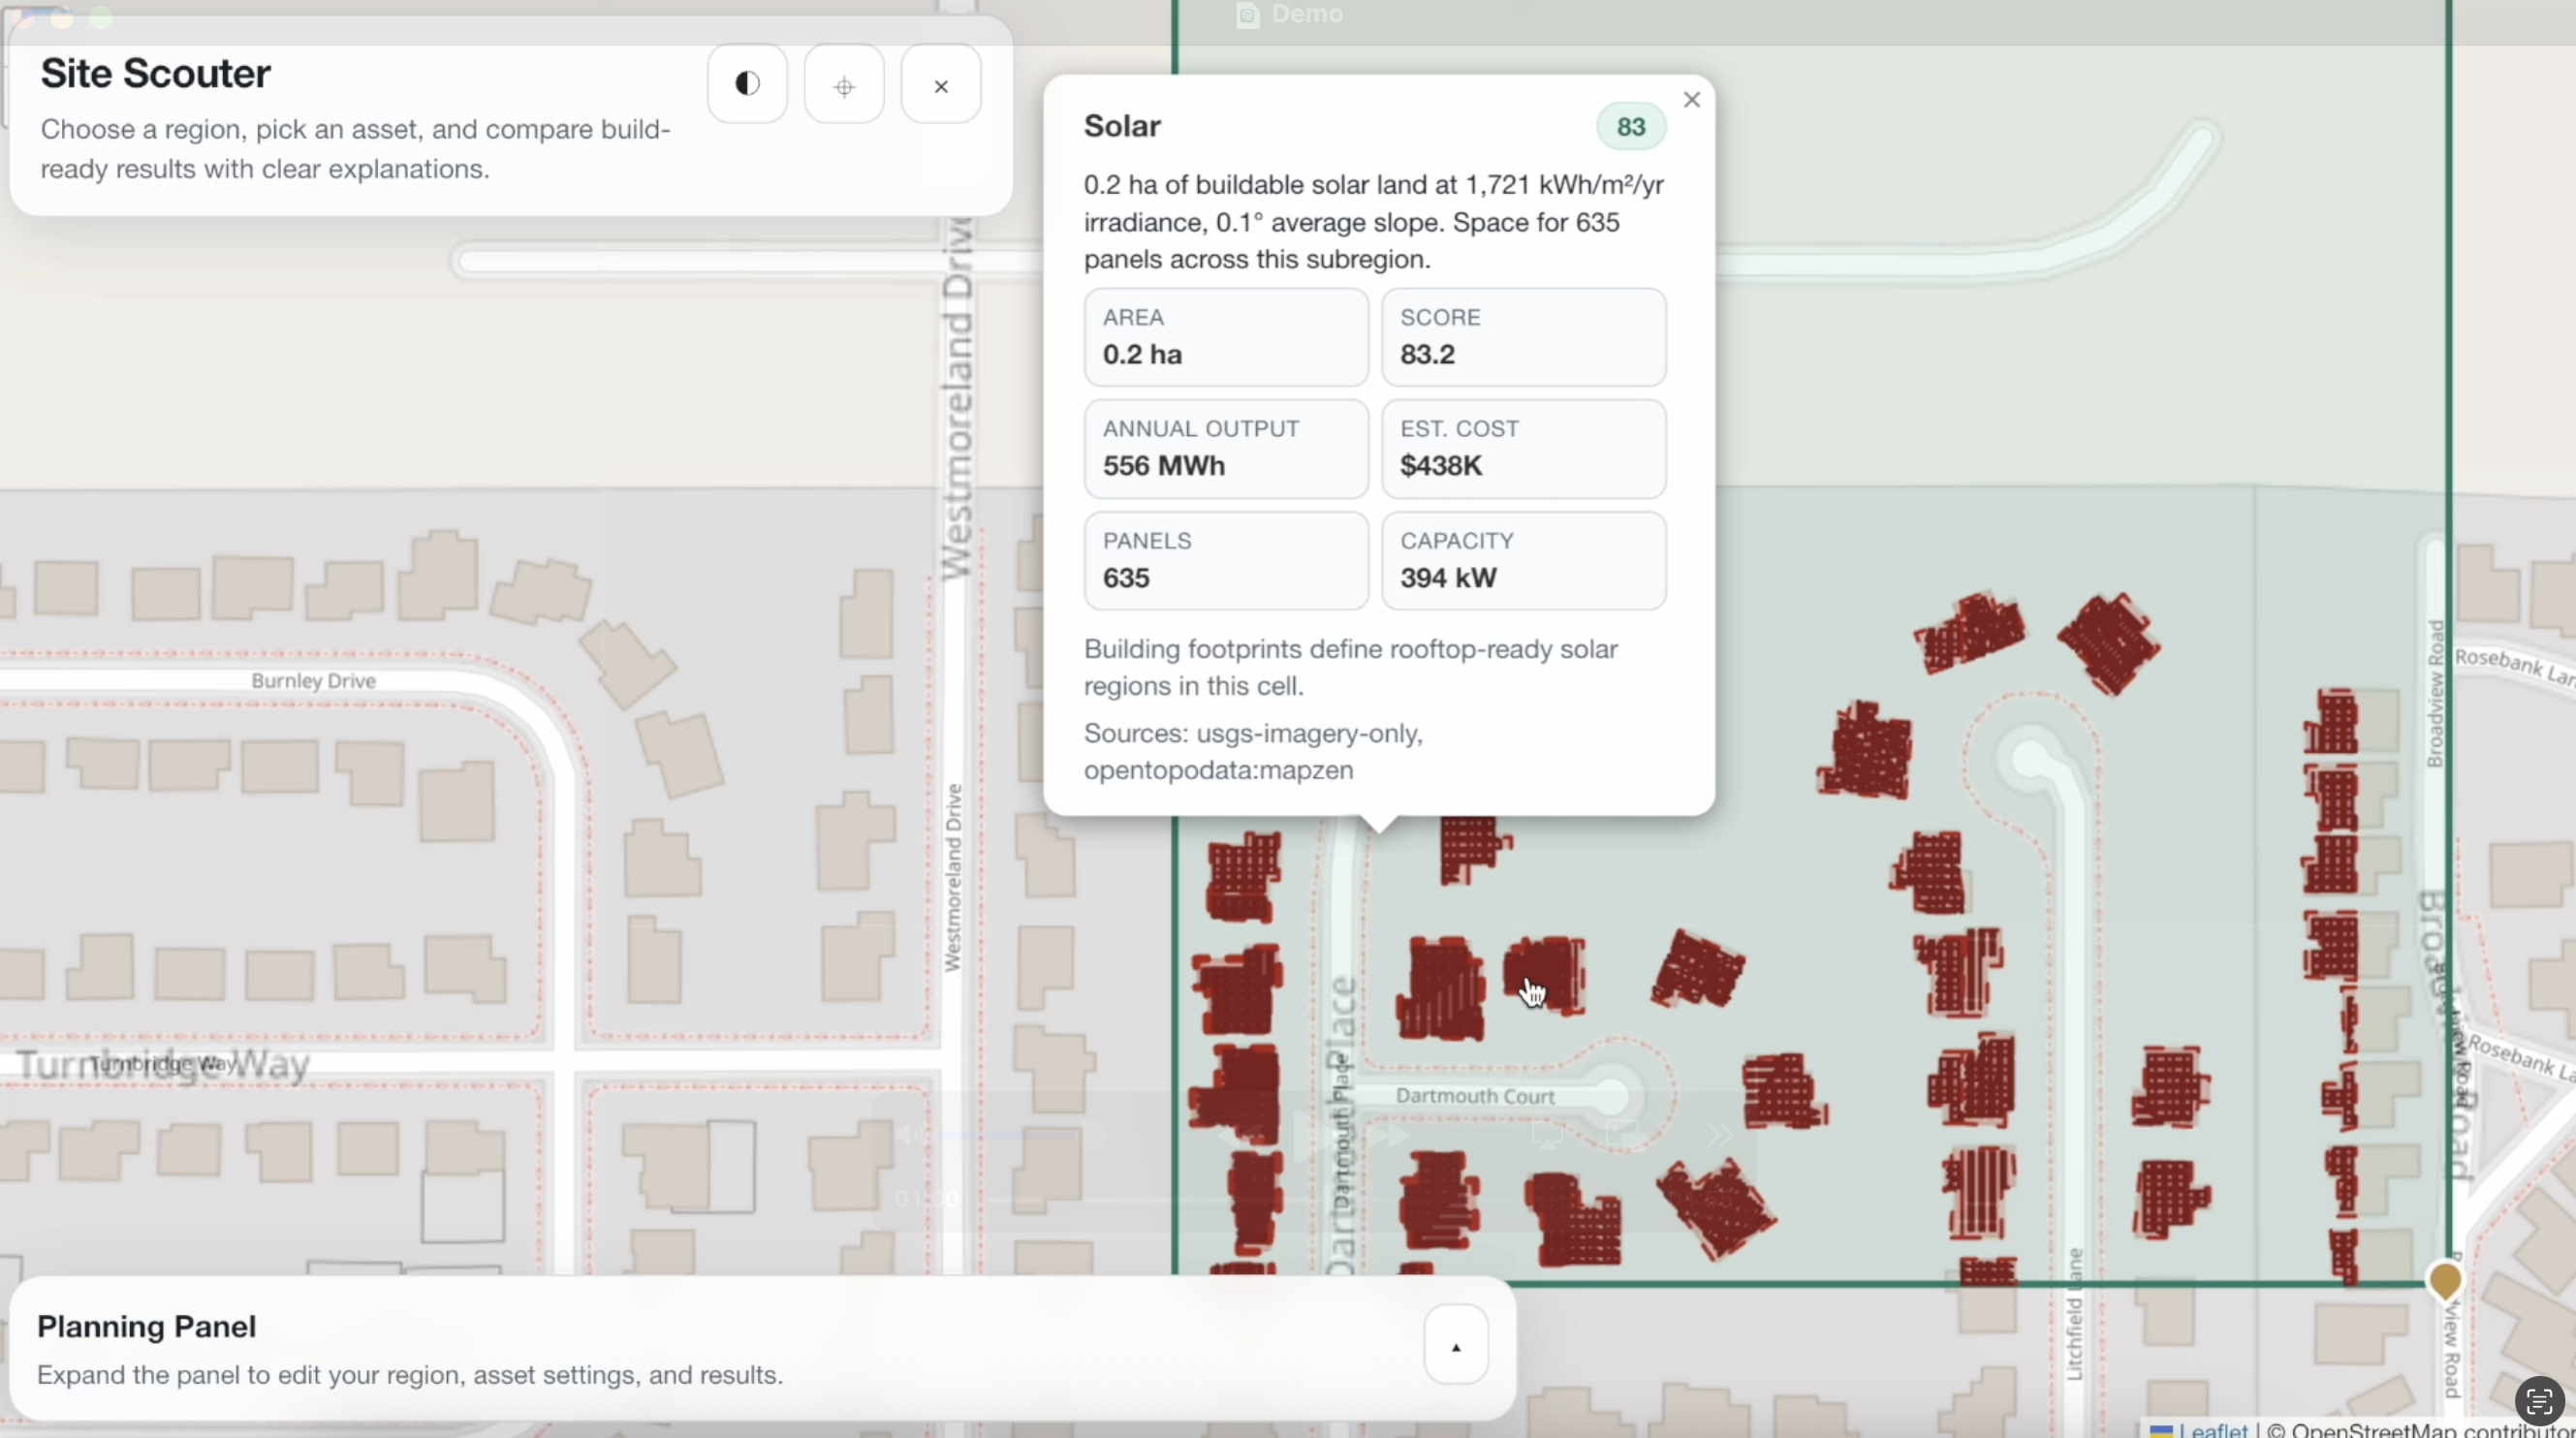
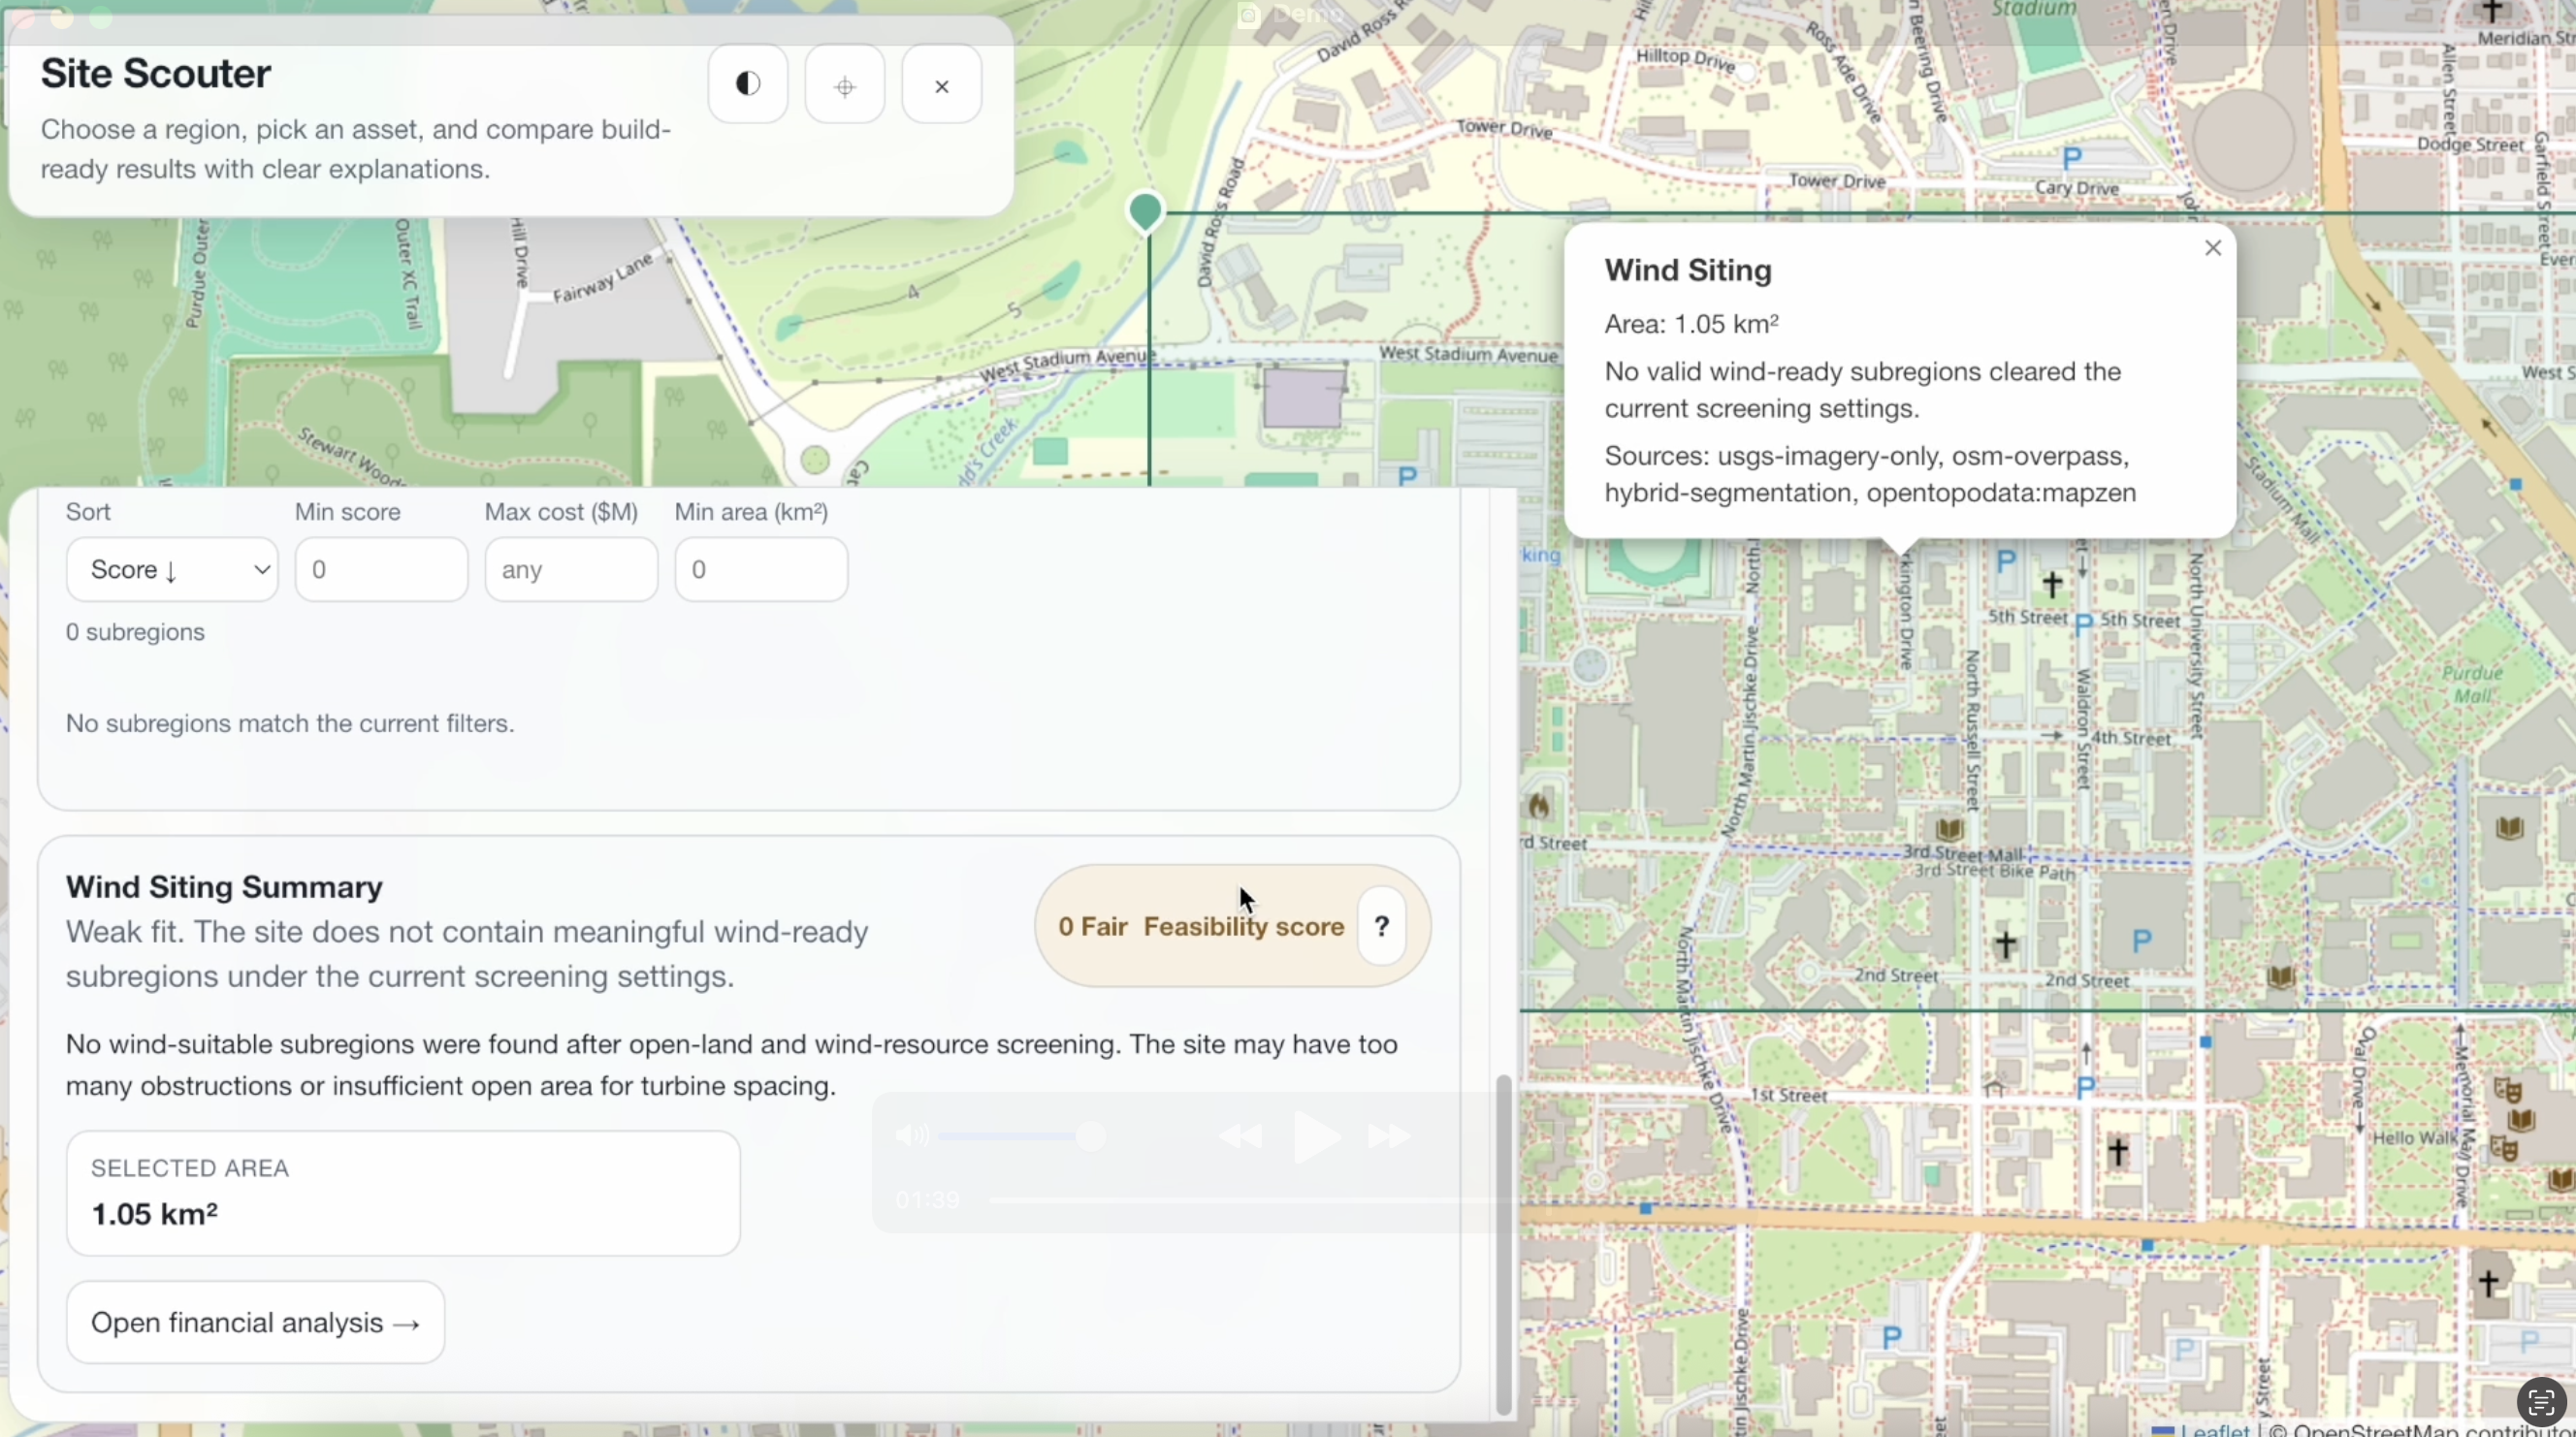
Site Scouter is a geospatial analysis tool that takes a user-defined region and identifies the best areas for infrastructure by subdividing the selected region into smaller cells, then analyzing it using satellite imagery, terrain, and vector data, and scoring suitability for solar panels, wind turbines, and data centers based on factors like irradiance, land cover, slope, obstructions, and accessibility. The platform then ranks and visualizes the best candidate areas on an interactive map, while also supporting single-asset analysis with estimated output, cost, and past-year generation trends.
How we built it
Site Scouter is comprised of a full-stack geospatial pipeline with a FastAPI backend and a React + Leaflet frontend. The backend handles polygon validation, subdivision, imagery retrieval (USGS with optional Mapbox or Sentinel), OpenStreetMap visualization through Overpass, terrain analysis using OpenTopoData, segmentation through rule-based methods and ML ready integrations, and a multi-factor scoring engine. The frontend provides an immersive map-first interface with overlay controls, rendering candidate regions, enabling detailed inspection of scores, and supporting asset-specific analysis and time-series visualizations.
Additionally, the most powerful aspect of this application is the neural network that analyzes the given areas to predict power generated by a potential infrastructure project. This model consists of four fully connected layers postprocessed with ReLU, built using PyTorch and trained on thousands of wind and solar projects with data from the USGS and climate data from ERA5, and was tuned to reach an R^2 of >0.90 on a test dataset.
Challenges we ran into
Neural Network Model
We had to merge several datasets in order to get the required data. This involved researching how the U.S government uniquely identifies power plant installations using Energy Information Administration plant codes, and merging several datasets including climate, power plant aerial photography, and power plant energy output.
While training the model, we additionally ran into an issue where the label data had a very skewed distribution, initially leading to very low R^2 scores. After diagnosing the issue, we utilized a log-normal transform on the label data in order to account for this skew, vastly improving the accuracy.
Website Development
When the user selects an area, we found it was difficult to utilize the local topology to compute the density of power generation elements such as solar panels or wind turbines. Furthermore, this issue led to panels being placed in areas impossible to develop, such as roads, buildings, or bodies of water. We later determined the main way to tackle this problem was by using another machine learning model, and aim to tackle this in the future
Balancing performance and accuracy in segmentation between rule-based approaches and machine learning models was also difficult. On the frontend, efficiently rendering many candidate polygons while maintaining responsiveness required careful optimization, and we had to work within API limitations and free-tier constraints for imagery and geospatial services.
Accomplishments that we're proud of
We are proud to have built a fully functional end-to-end system that intuitively takes in user input and transforms it into a detailed plan to develop infrastructure. Our map-first interface makes complex geospatial analysis intuitive to explore. We successfully implemented multi-use case scoring for solar, wind, and data centers within a single platform, creating a solution that is both immediately usable and highly extendable for future additions.
What we learned
Through this project, we figured out how to combine geospatial data pipelines into an applicable format to produce meaningful insights. We also examined the tradeoffs between heuristic and machine learning methods, and gained experience building interactive spatial visualization tools.
What's next for Site Scouter
We plan to improve accuracy by integrating higher-resolution and real-time datasets and deploying fully trained machine learning models for segmentation. We also aim to incorporate economic and regulatory factors such as zoning, grid access, and incentives, expand support to additional infrastructure types and broader geographic regions, and optimize performance for large-scale use. Ultimately, we want to evolve Site Scouter into a production-ready platform for developers, utilities, policymakers, and community members, all of whom are concerned with the future of energy and data infrastructure in this country.

Log in or sign up for Devpost to join the conversation.