-
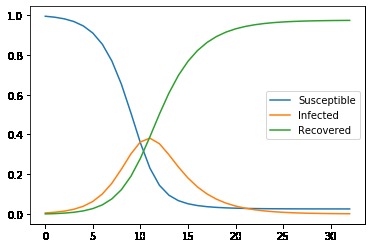
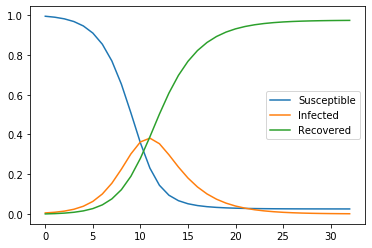
Vanilla SIR Model
-

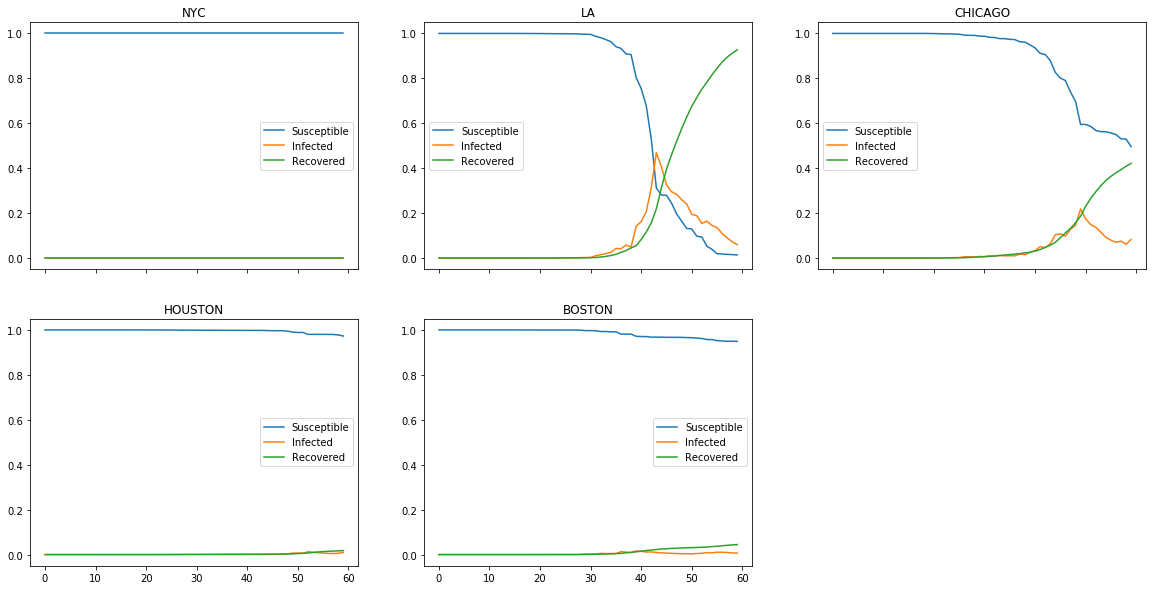
Multicity with Ban
-

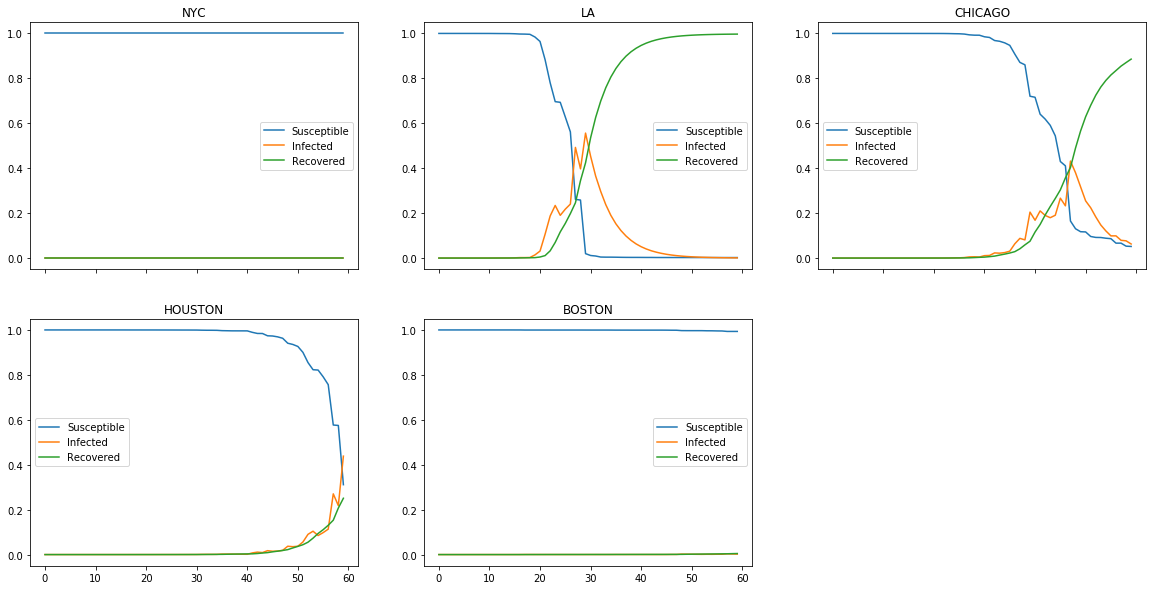
Multicity without Ban
https://github.com/jackshen1998/Brown-Datathon-2020-Group-Sir-Viral https://docs.google.com/presentation/d/10-amg9KMbpBd5I5sutp_ajdAdReDMQQqgY1hUq59I-c/edit?usp=sharing
Project Summary
The project is divided into two parts. For the first part, we did some exploratory analysis and visualization of the data sets given at first and found out that if the outbreak continues. The second part included an exploratory model using SIR system of ODEs with the parameters determined by the given data.
Introduction
The rapid development of novel corona virus (nCoV-19) is the most pressing issue the humanity is facing today. Globally, there have been ~78k confirmed cases with ~2500 deaths, and the figures are expected to grow more in the coming months. We aim to provide some insights to the ongoing situation via visualization and model the outbreak on a popular SIR model with some tweaks. We used all six data sets that are provided by Fidelity and we scraped the most updated corona virus outbreak infection number from a Chinese website. model was to provide some insights into the situation, not to accurately model the outbreak. Many research institutions are striving to predict the situation more accurately.
Even though the provided dataset only provided the inbound US travellers, we determined that China should no longer be the focus of the issue with the recent major super-infection events having taken place in Japan, Korea, and Italy; it has already become a global phenomenon and needs to take other affected countries into account. Moreover, the politically charged fear against the outbreak on imposing strict ban on international travellers and growing distrust against people of the Asian origin, we thought it would be interesting to see if limited migration would affect the spread of the spread in the US cities.
Of course the model was not accurate, but it provided some insights on how the outbreak may pan out and the effect of incoming travels in the major US cities. The model was built upon the popularized SIR (Susceptible-Infected-Recovered) model in epidemiology with an additional term to take inbound migration into account; the migration matrix was computed by some basic Bayesian inference on the given data to provide some indices on travelling from the affected countries to one of the major US cities. The model included some stochastic components to simulate an infection event based on the probability distribution and the given parameter (the basic reproduction number) to provide a possible path the outbreak may take.
Results
Some cities are surprisingly susceptible
Note that the results are stochastic, so it will vary on each run. However, simulating on the initial infection with the current infection statistics in the US (https://www.nytimes.com/interactive/2020/world/asia/china-wuhan-coronavirus-maps.html), New York, without having any current infection, was the only unaffected US cities. Surprisingly, the only city with a significant number of infections, LA, had numerous occassions where the infection died out by the end of the period. Boston was surprisingly susceptible possibly due to relatively smaller population.
Banning inbound travel does not necessarily help with the spread of epidemics
More interesting result was from limiting the inbound travel by setting the migration matrix zero. Even though many would think that travel ban would mitigate the effect of infections. This is true in certain extent because travel bans led to decrease of spread in overall numbers. However, it did not necessarily prevent the spread of the virus especially for cities like LA. With politically charged travel bans are happening all over the world with the fear of spread, this seems like a relevant issue we need to reconsider.
This model was not statistically tested against a sampled data. This model was created to provide insights.
Challenges
We met a lot of challenges through exploring the data. First of all, the data sets were in messy formats, we had to spend a lot of time cleaning them. Moreover, the most updated data in the data sets are from September 2019, which was way before the outbreak and we could not find any historical data about other similar outbreaks as nCoV-19 exhibits different infection patterns according to the leading medical research. This made the process of constructing a forecasting model much more difficult since we could not train and consolidate our model based on the previous case. During the process of building the model, we had to make some strong assumptions in order to run the model. The model did not account for some crucial factors in infections and deaths, so it should in no way considered accurate. More works need to be done with taking these different factors into account.

Log in or sign up for Devpost to join the conversation.