Inspiration
Modern distributed systems fail in subtle, cascading ways, but most teams only see static dashboards or postmortems after incidents. Simulacra was inspired by the need for a live, interactive environment where engineers can model systems, inject stress, and understand failure dynamics before production.
What it does
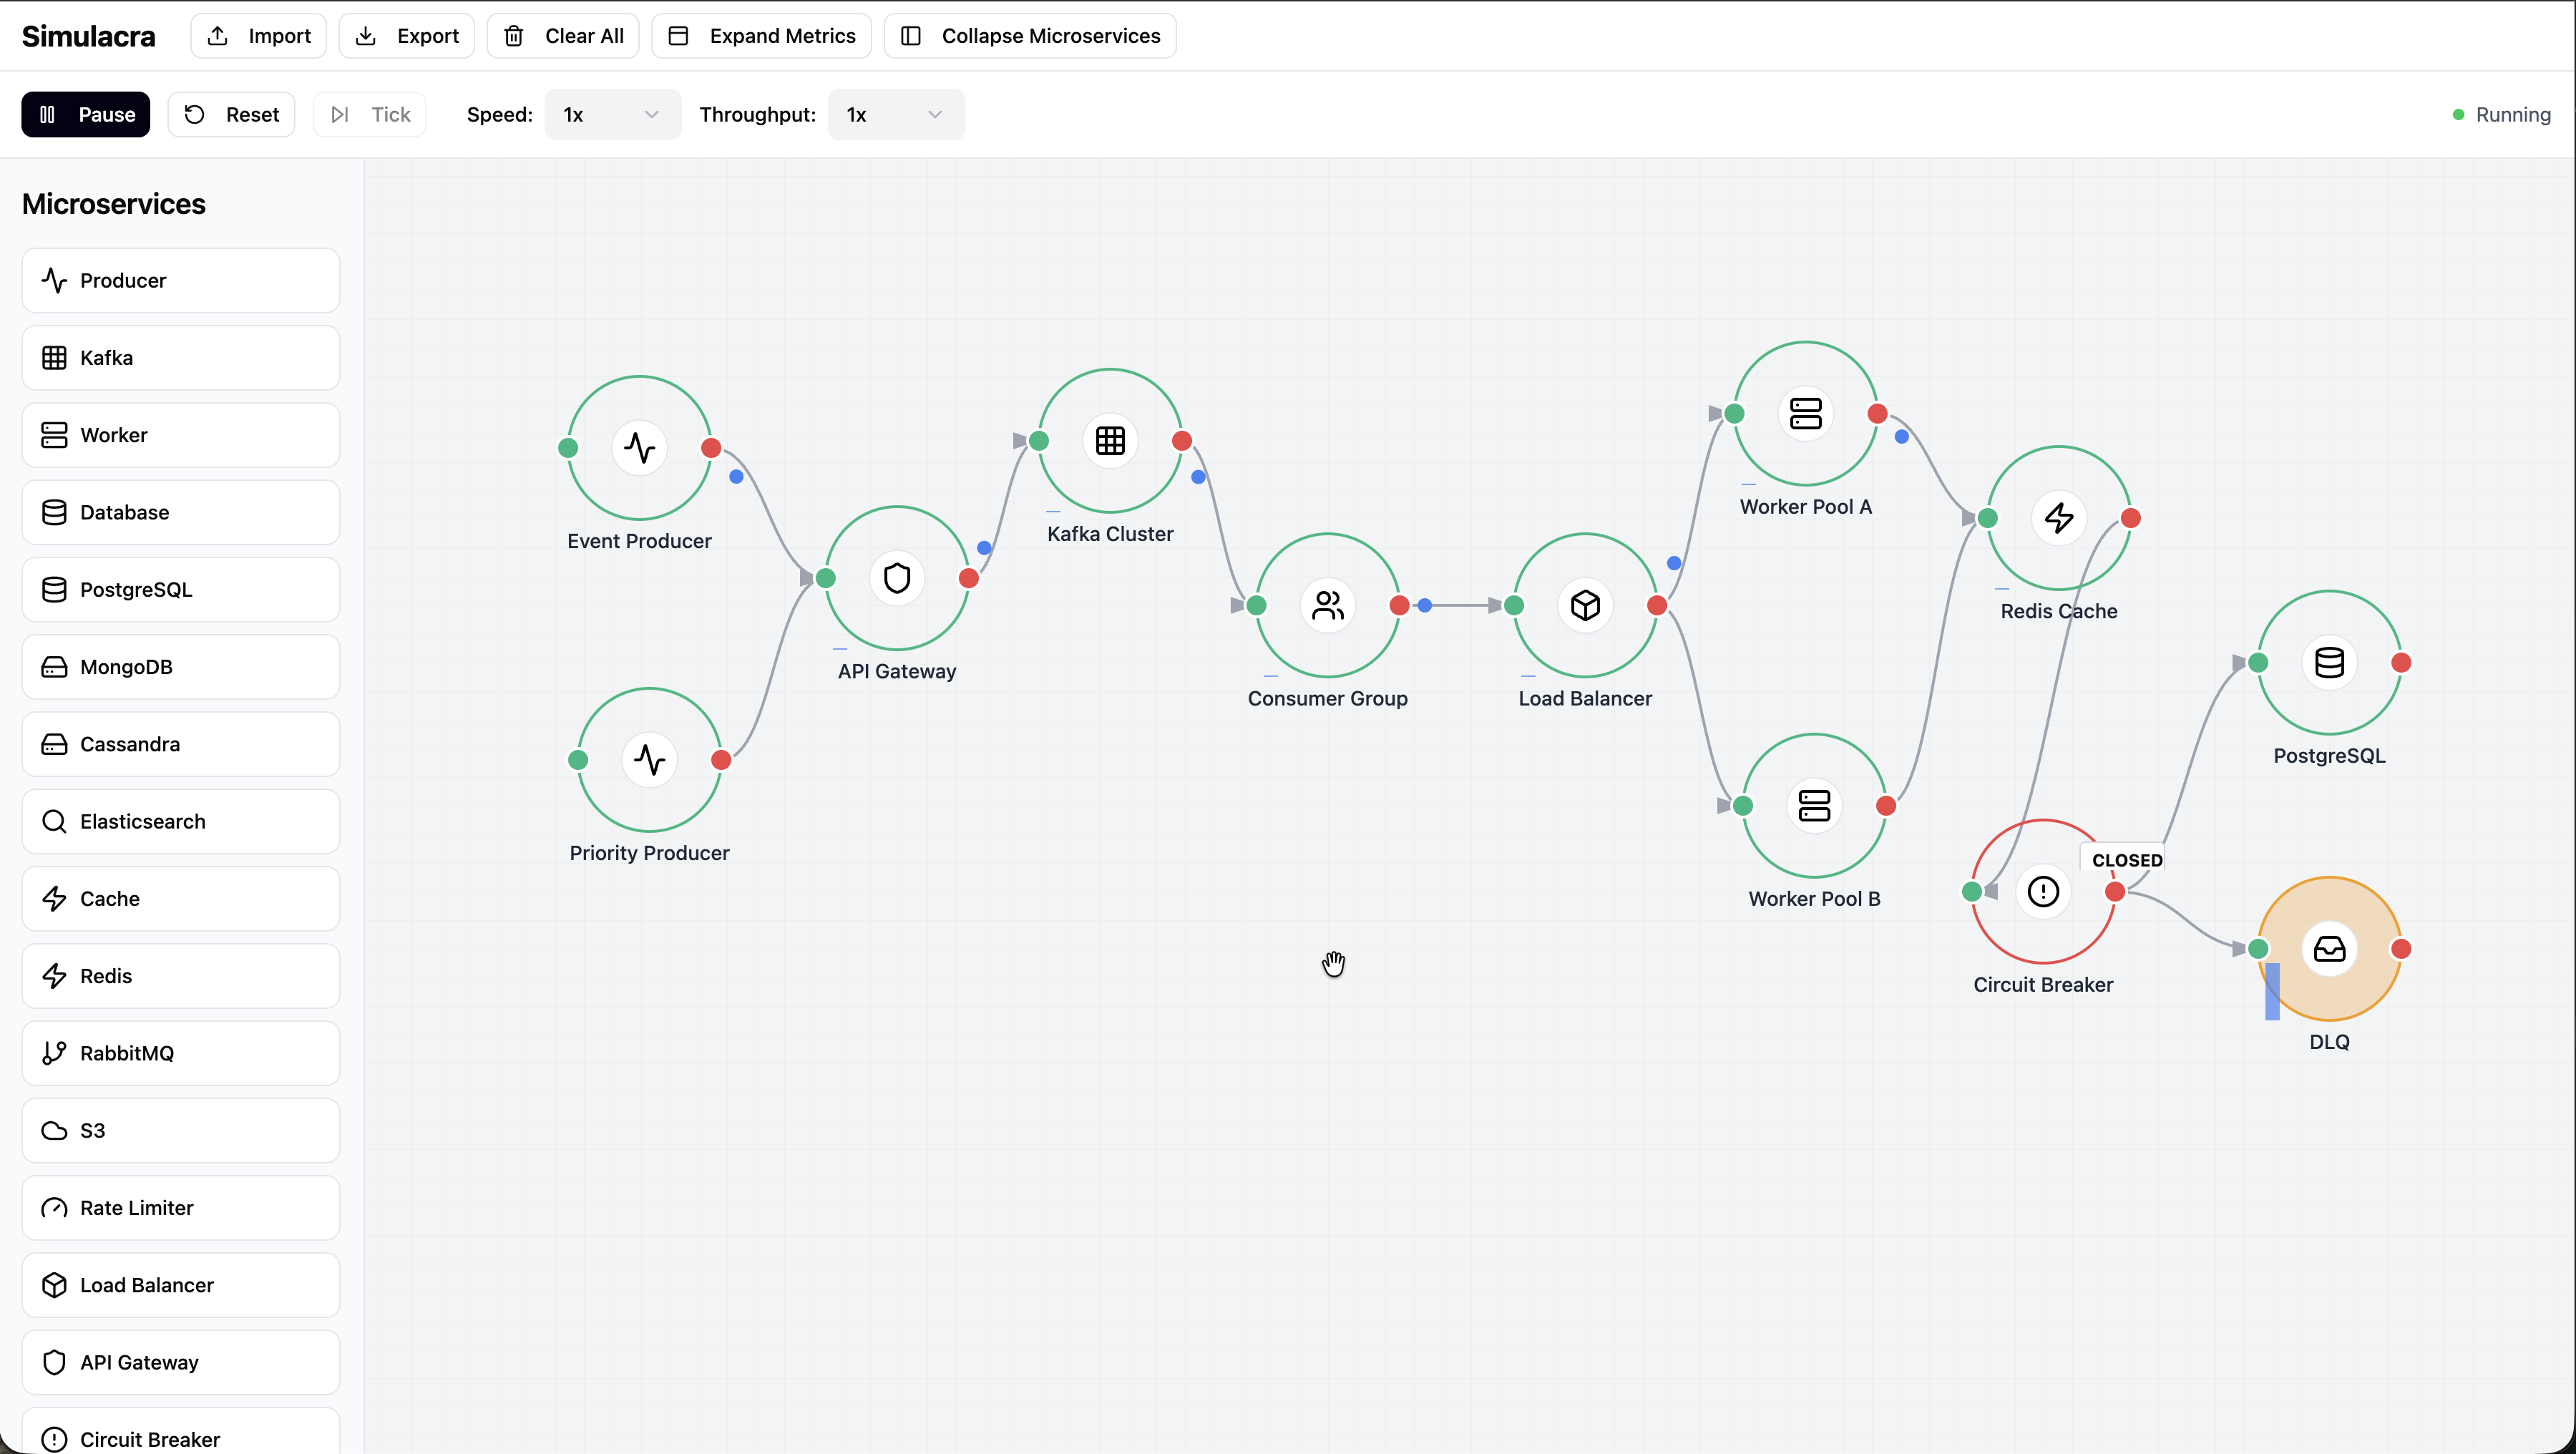
Simulacra is a visual distributed-systems simulator. You can build a topology on a canvas (producers, queues, workers, cache, circuit breakers, databases, DLQ), run the system in real time, and observe throughput, latency, queue depth, health, and event timelines. It exports high-granularity metrics, pushes run data to Databricks, and supports Prometheus scraping for operational-style observability.
How we built it
We built Simulacra as a full-stack TypeScript app: Frontend with an interactive node-and-edge canvas, simulation controls, and live metrics/timeline views. Simulation engine with tick-based execution, message routing, node-specific behavior models, fault injection, and lifecycle tracking. Backend ingestion API that records run metadata and snapshot/service metrics in Databricks. Prometheus integration for scrape/push workflows with node-level telemetry. A realistic default topology that includes API gateway, dual producers, Kafka, consumer group, load balancer, worker pools, cache, circuit breaker, database, and DLQ.
Challenges we ran into
Designing realistic failure behavior without overcomplicating the simulator. Preventing misleading architecture patterns in defaults (e.g., accidental retries loops, improper DLQ routing). Balancing observability detail with performance and metric cardinality. Keeping UI interactions smooth while simulation throughput and event volume increase. Ensuring data contracts stay aligned across simulation engine, frontend payloads, backend validation, and storage tables.
Accomplishments that we're proud of
Built an end-to-end simulation + observability pipeline, not just a mock UI. Added topology persistence to Databricks so analysis tools can reason about both structure and runtime behavior. Improved Prometheus output to granular node-level metrics with meaningful labels. Made DLQ semantics more realistic (explicit edge-based routing) and cache-hit behavior actually reduce downstream load. Evolved the default system into a more production-like model with clearer operational failure modes.
What we learned
Small modeling choices dramatically change system behavior and diagnostic quality. Realistic defaults matter as much as feature breadth for user trust. Observability is only useful when tied to architecture context. Simulation UX needs guardrails (sane throughput defaults, clear routing semantics) to avoid generating misleading conclusions. Iterative refinement with real “what-if” scenarios is the fastest way to improve system models.
Built With
- databricks
- prometheus
- react
- sphinx-ai
- typescript

Log in or sign up for Devpost to join the conversation.