Inspiration
Too often, girls are made to feel that finances are complicated to handle and often times many grow up depending on someone to 'handle the $$.' Introducing "SimplFinance" AI app, that is about education and empowerment and turning data into insights, and helping everyone own their financial future."
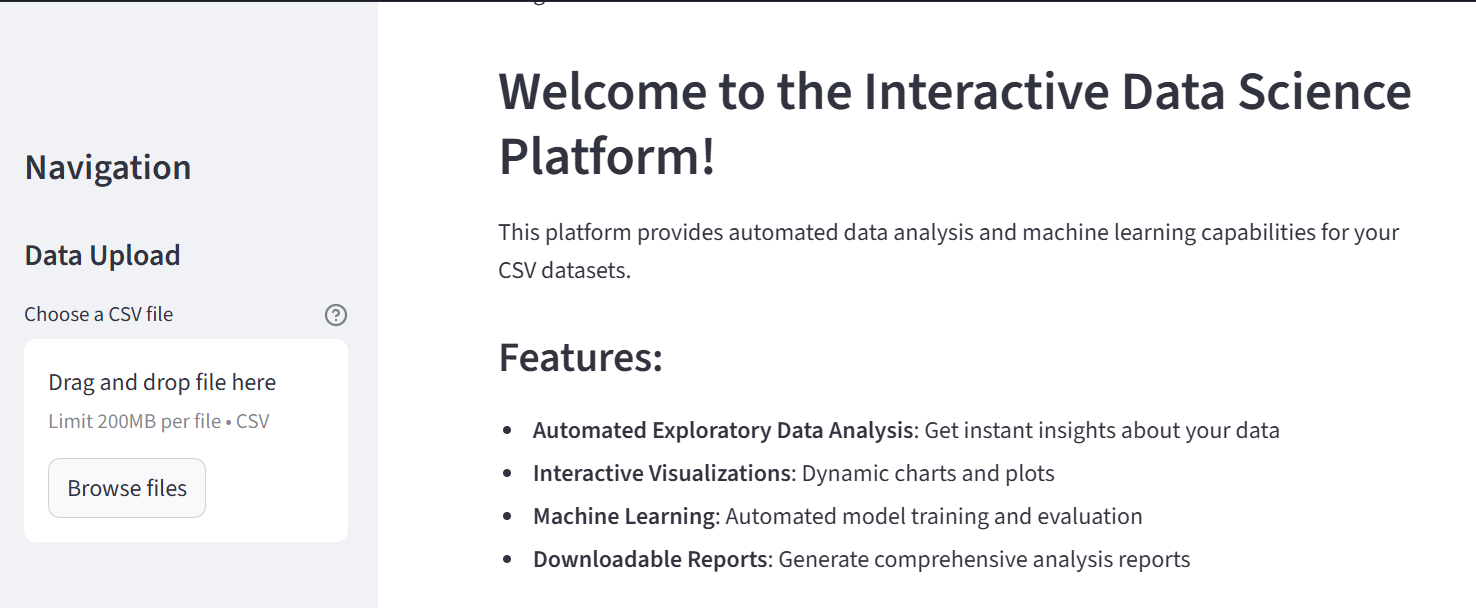
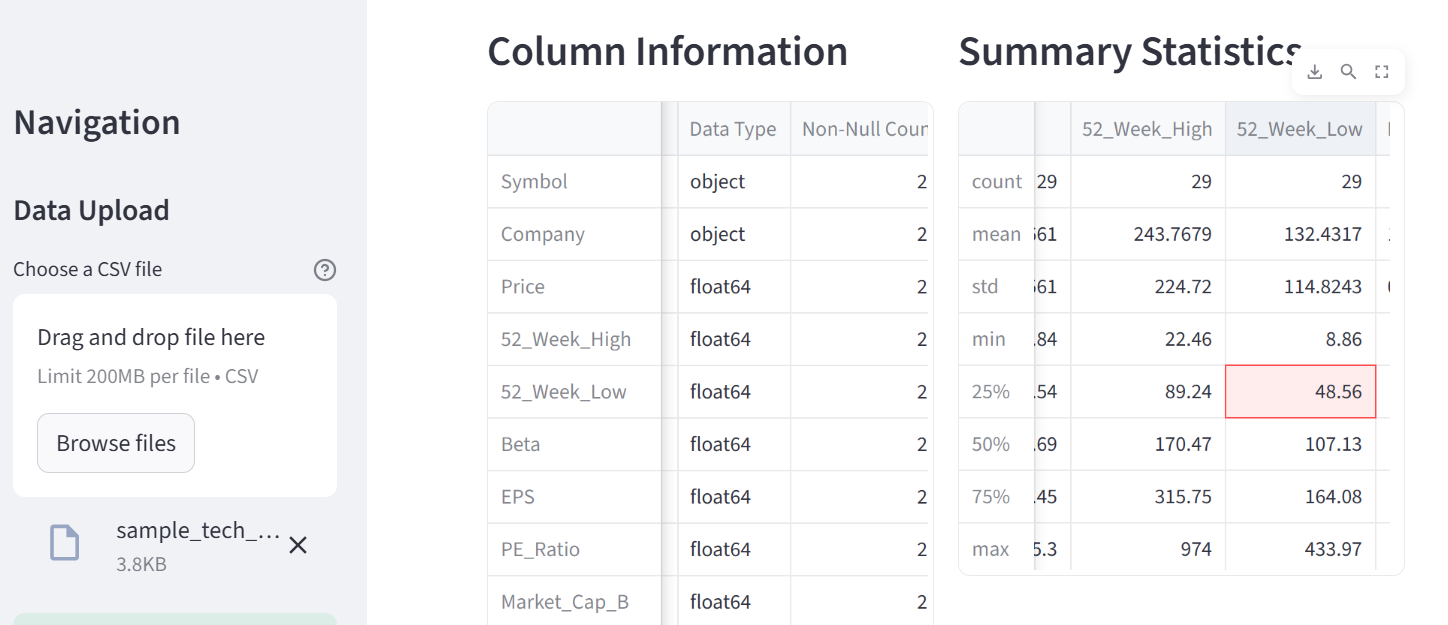
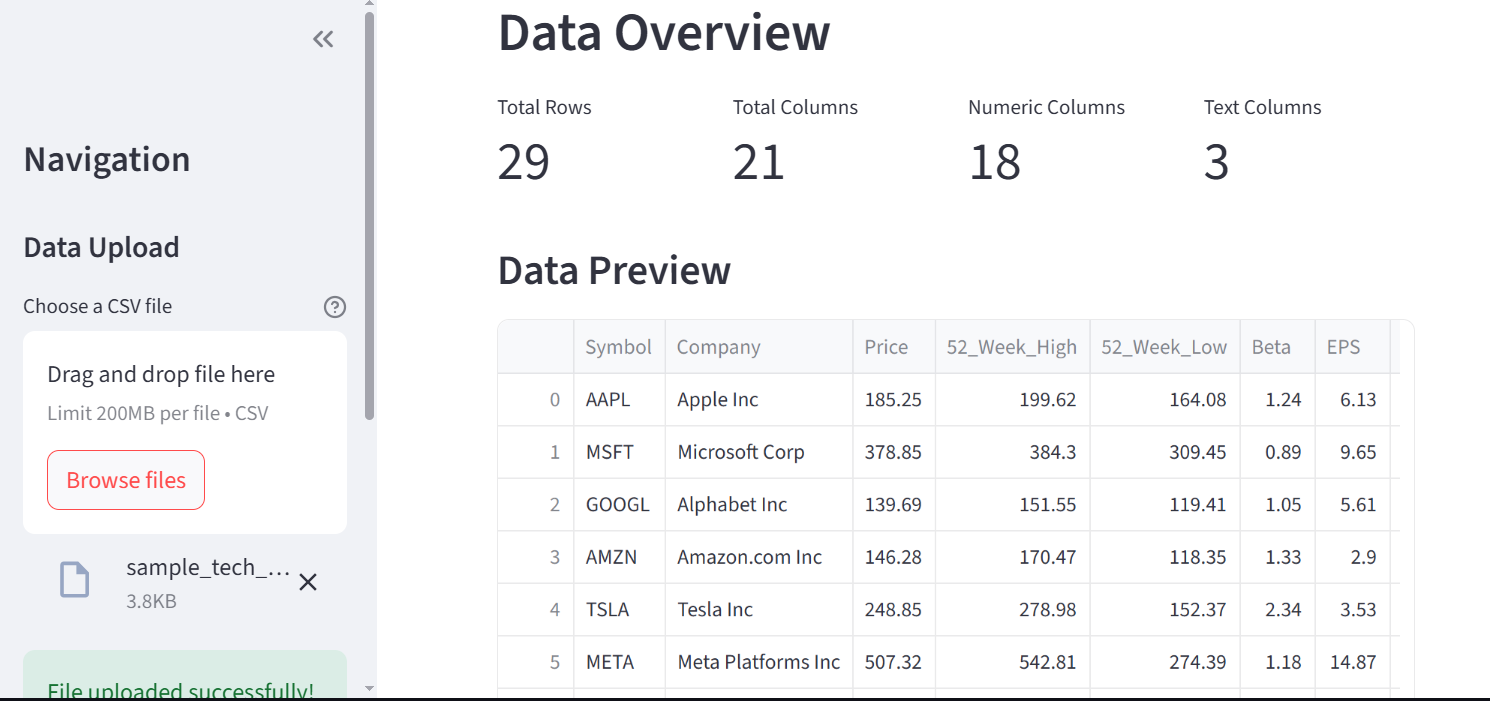
Introducing "SimplFinance" AI platform that flips this narrative. With our Interactive Data Science App, anyone whether a first-time investor, or a professional can upload a simple CSV file (structured) can instantly unlock insights! Take financial data as an example: provide stock prices, or any metrics, and in seconds you’ll see detailed analysis, summaries, dynamic charts, and patterns you can actually understand.
At its heart, this is about education and empowerment: turning data into confidence, and helping everyone, especially women to own their financial future.
What it does
Idea: Upload any CSV sheet for complex quick analysis - Steps: Upload a CSV file using the sidebar Explore your data with automated analysis Calls pre-trained machine learning models - classification Detailed Analysis - reading the file, summary Download your analysis report (as file or tabular view)
How we built it
Python 3.11, Visual Studio Code Editor, External libraries - Data Processing: Pandas for data manipulation and NumPy for numerical operations Machine Learning: Scikit-learn for model training and evaluation Visualizations: Plotly for interactive charts and Matplotlib for statistical plots, EDA for big files.
Challenges we ran into
One was designing the overall architecture so that Data upload, analysis, and prediction all worked together. It took a lot of trial and error to keep the app flow simple which at the time of just design, writing algo. was much simpler. Second, using external dependencies and matlib which was constantly giving error calling. Finally, decided to use copilot in VS code to debug and help with faster completion of the project.
Accomplishments that we're proud of
Proud to get the system to actually work end-to-end. It feels awesome to see algorithms summarize, find patterns. Also, I designed the architecture end to end so the app is simple, but behind the scenes the pieces connect smoothly - thanks to external libraries in back end doing the job. Honestly, seeing the idea come to life and making data feel less scary is one of the coolest parts.
What we learned
Working with unknown data is always challenging It’s really about choosing the right algorithms and making them efficient. Its never perfect the first time. Patience - most of all, learned that data analysis doesn’t have to feel overwhelming. If you design it the right way, it can actually be simple, powerful, and fun.
What's next for SimplFinance
We don’t stop at the basic reporting. The app goes further highlighting trends, predicting patterns, and even flagging anomalies that could signal risk or opportunity. It makes finance (or any dataset) not just approachable, but exciting and fun to explore!
Built With
- copilot
- eda-plots-for-big-files
- existing-libraries-matplotlib
- python
- vs-code

Log in or sign up for Devpost to join the conversation.