-
-
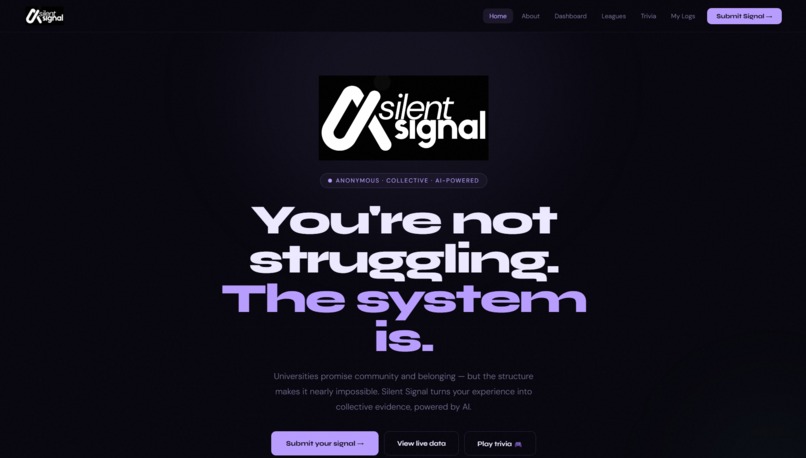
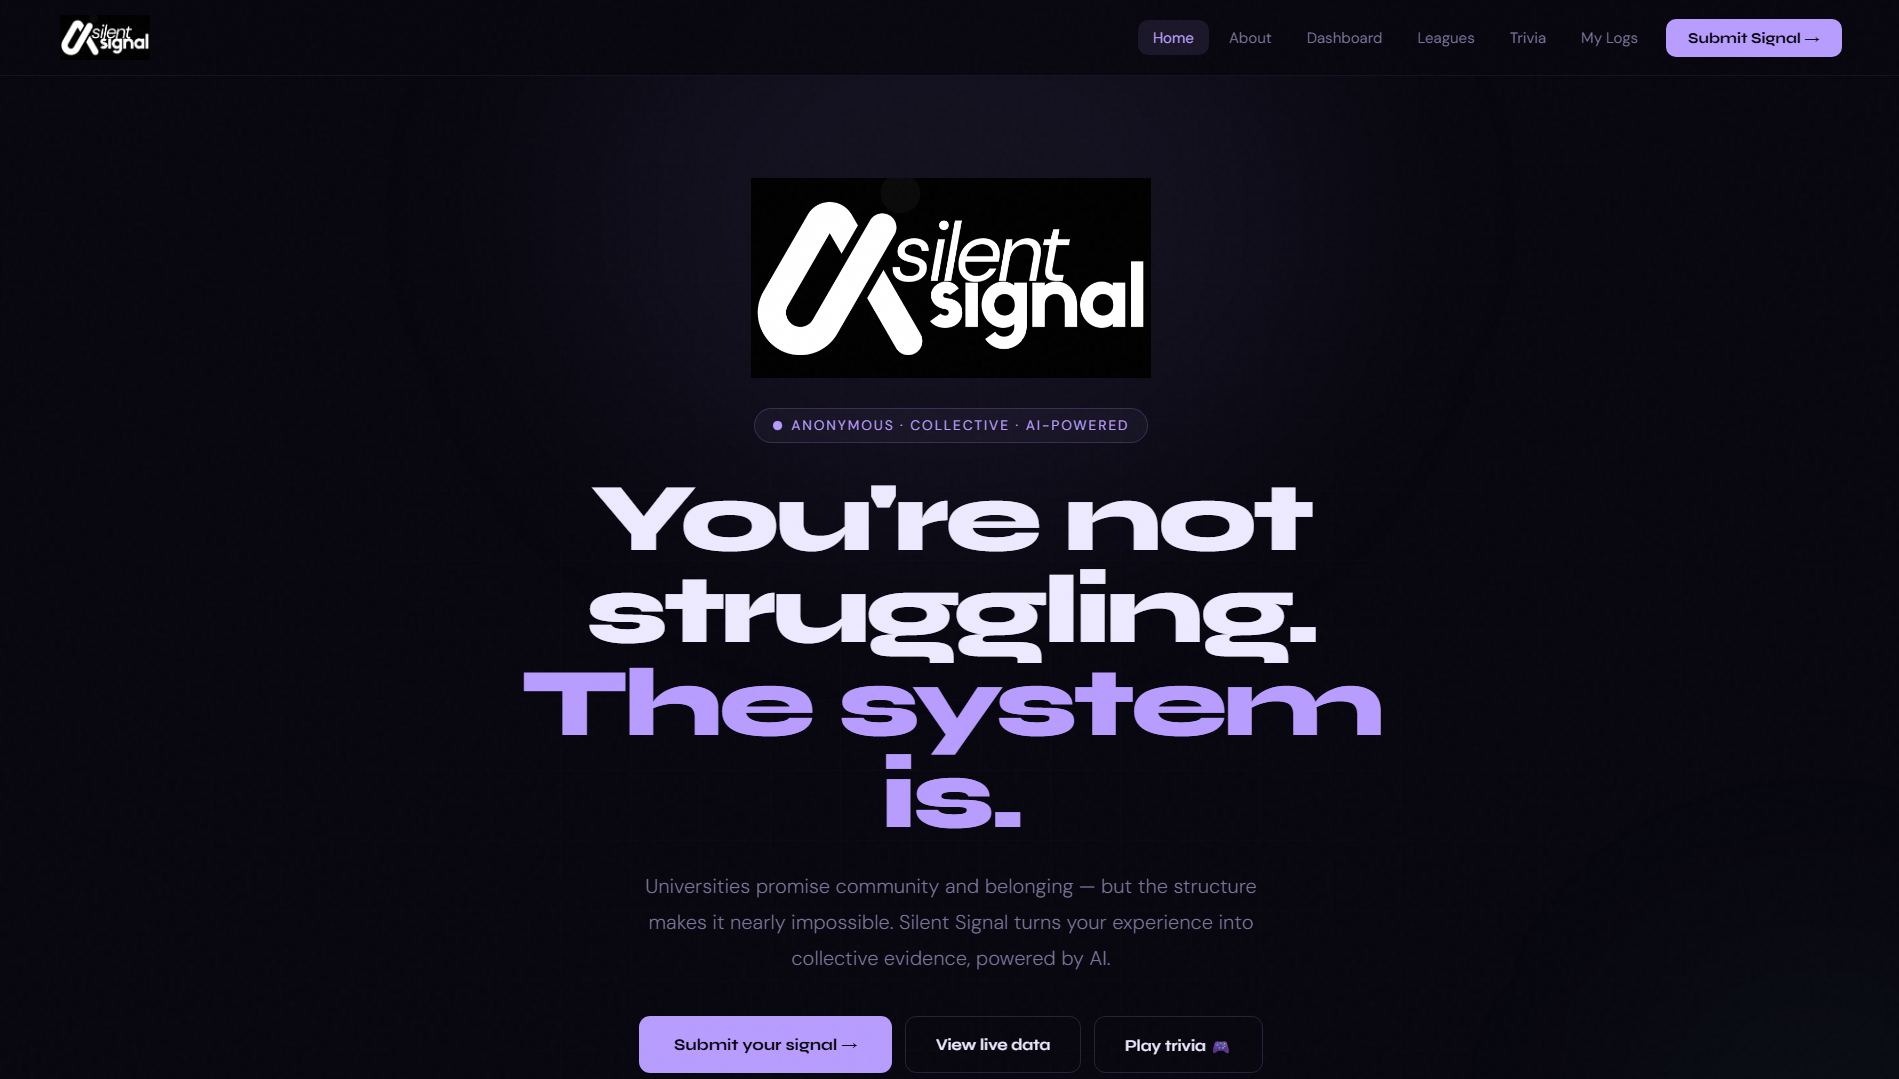
Homepage
-
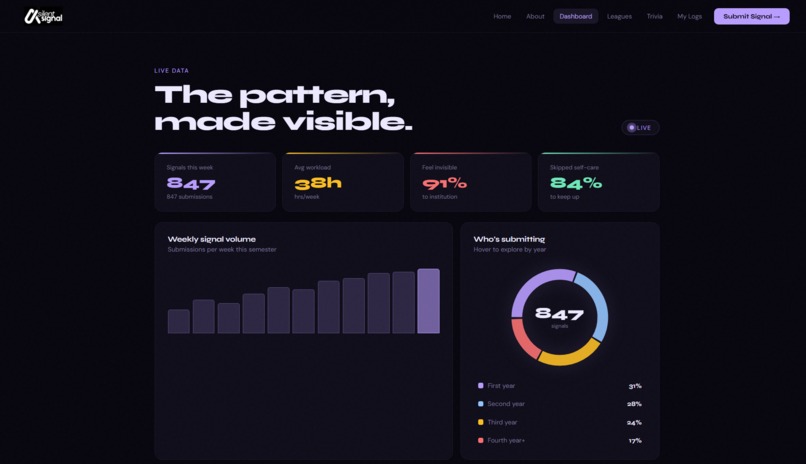
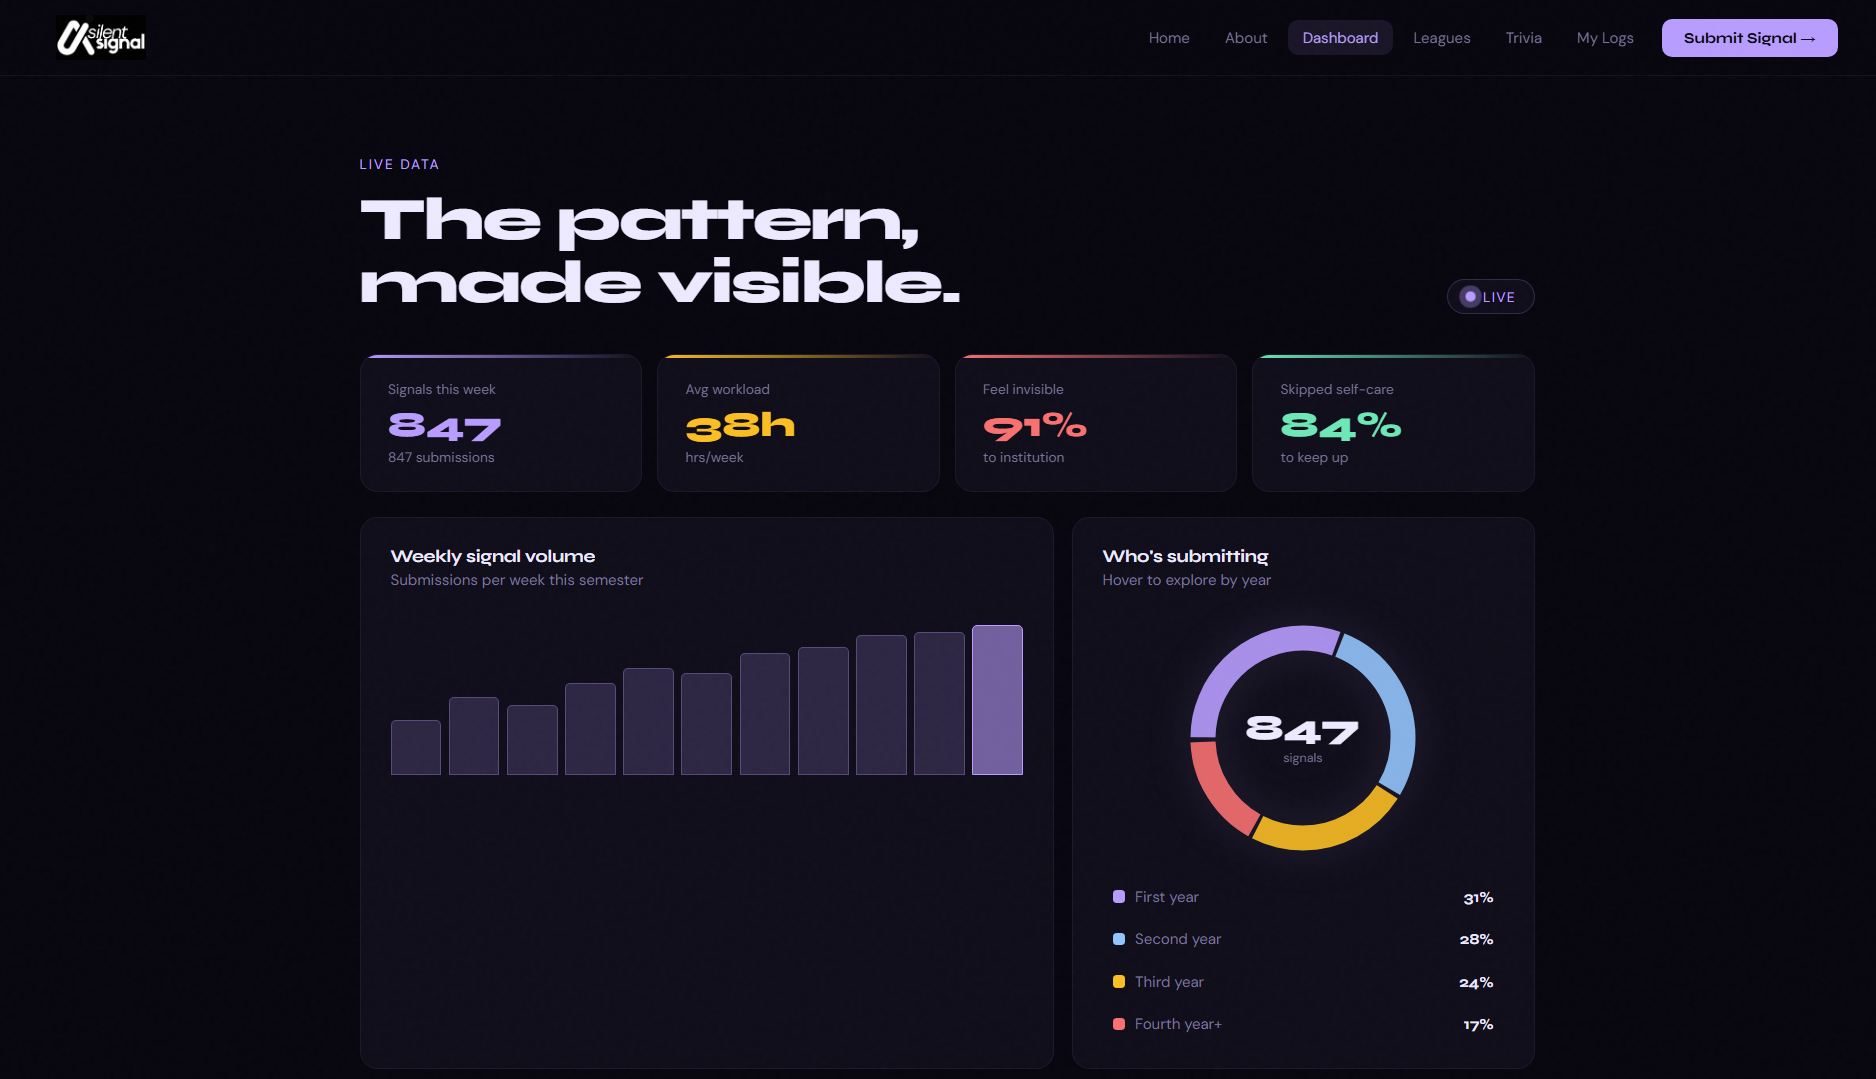
Live Data
-
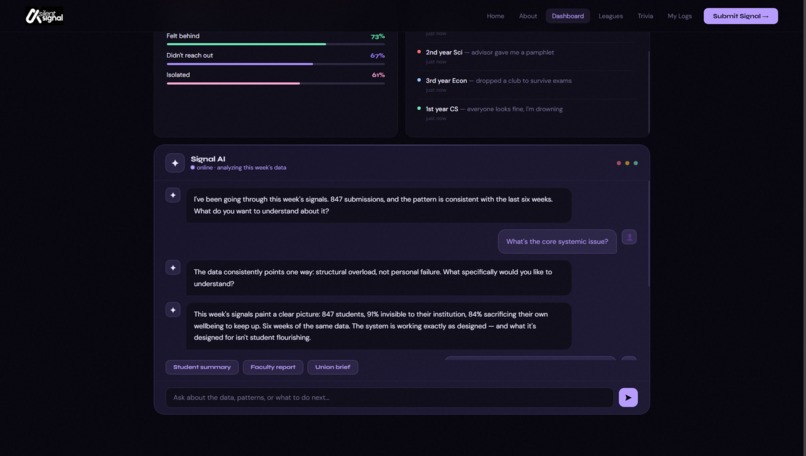
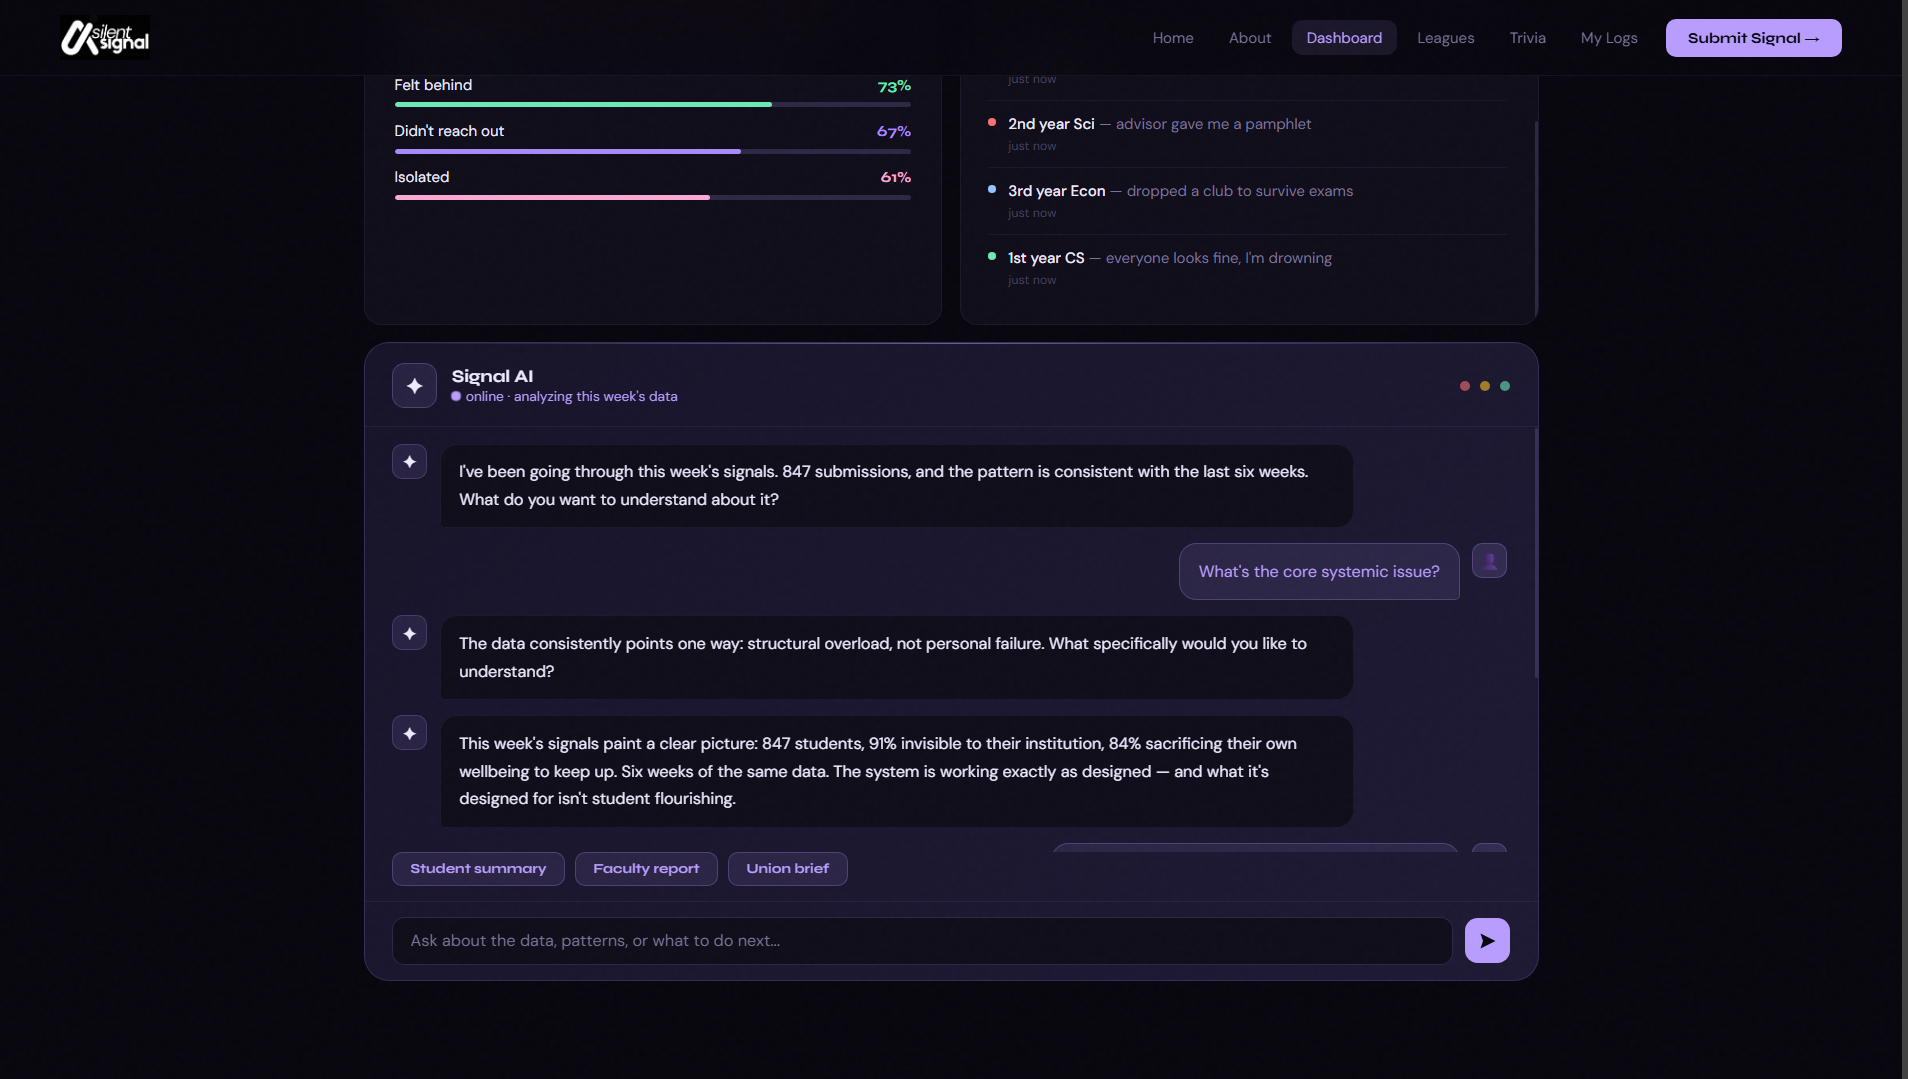
Built-in Signal AI chatbot
-
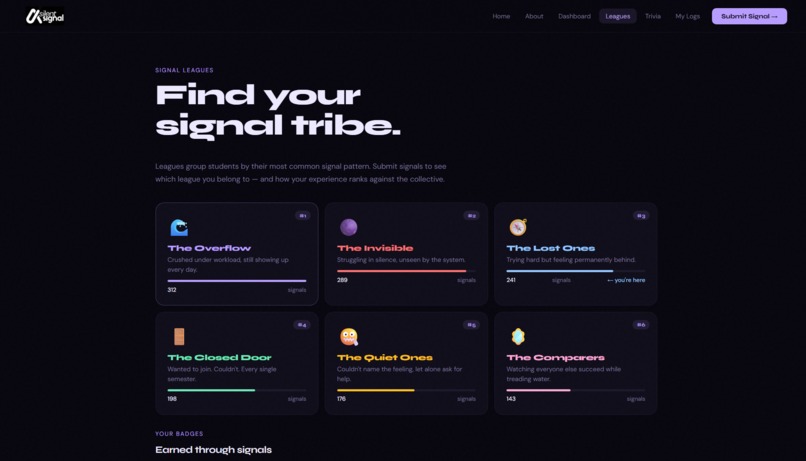
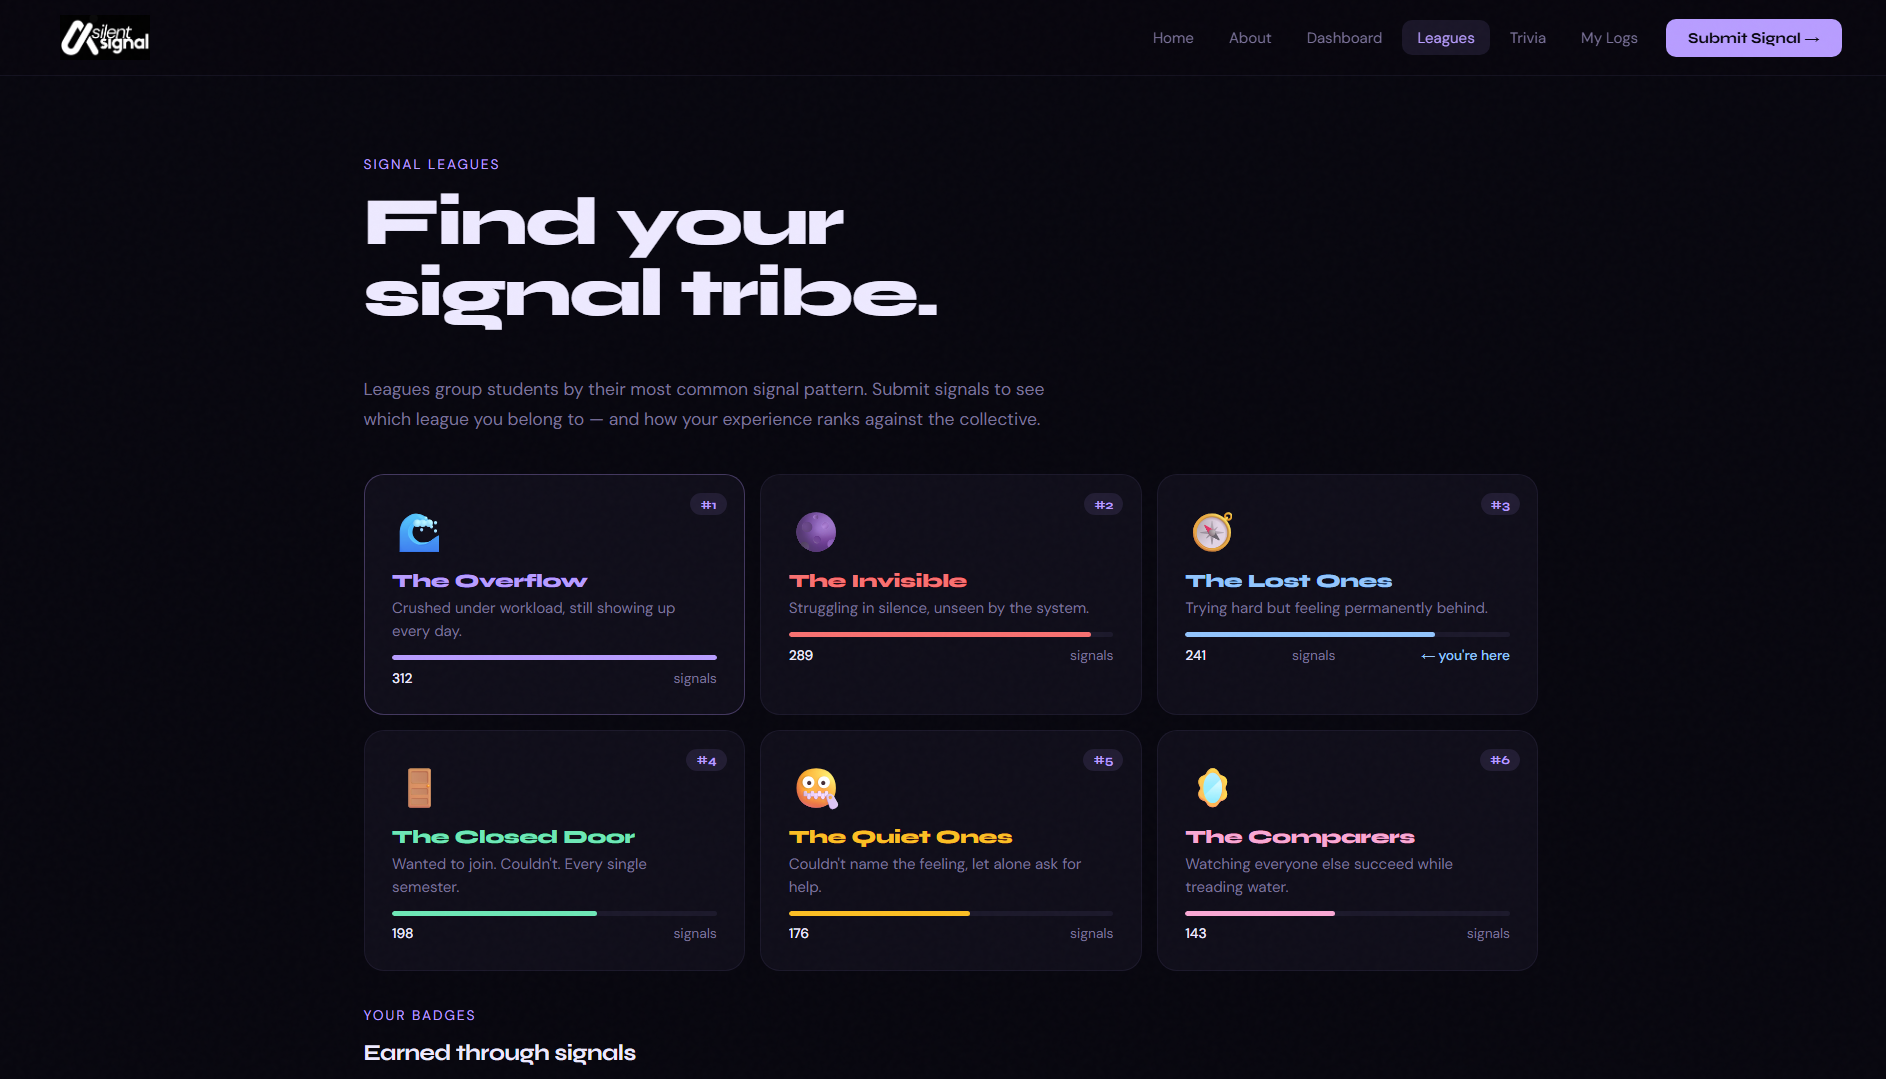
Users put into 'leagues' or group according to their signal
-
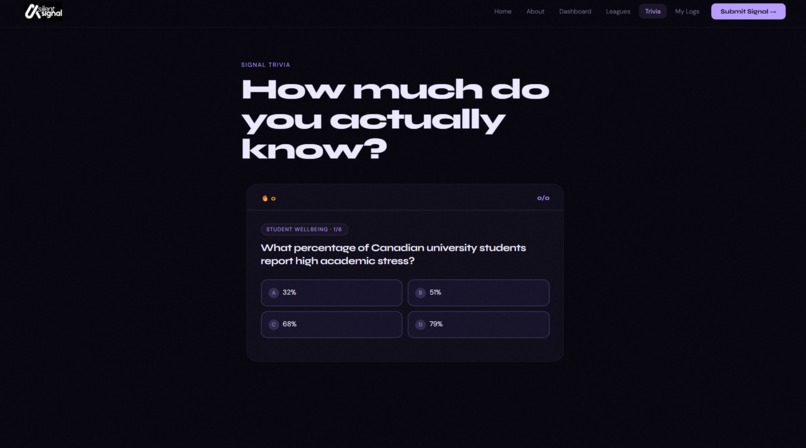
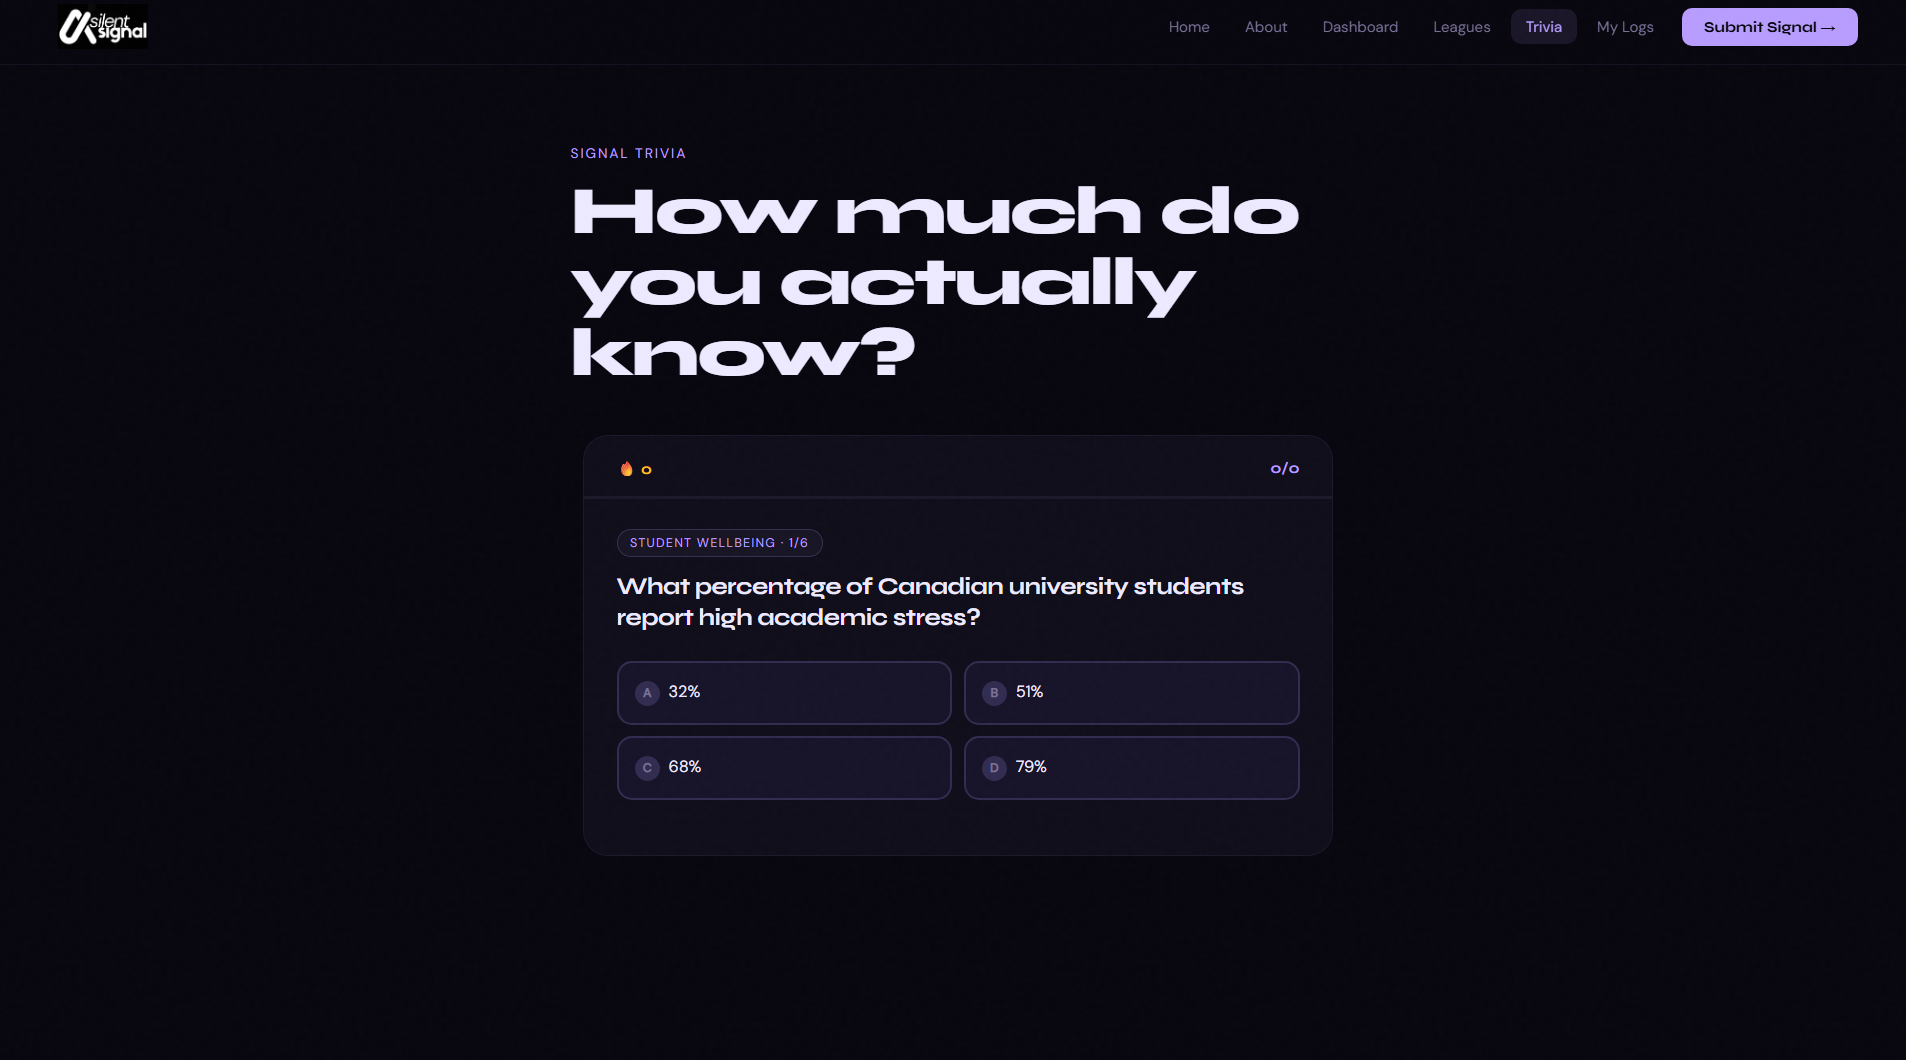
Interactive Trivia Quiz
-
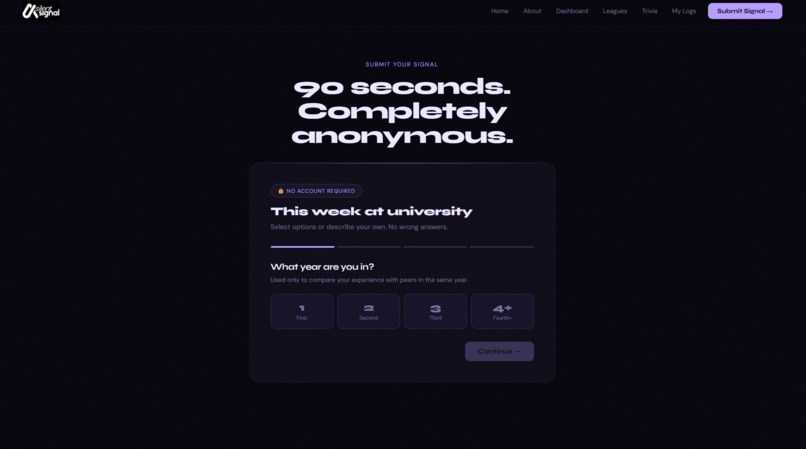
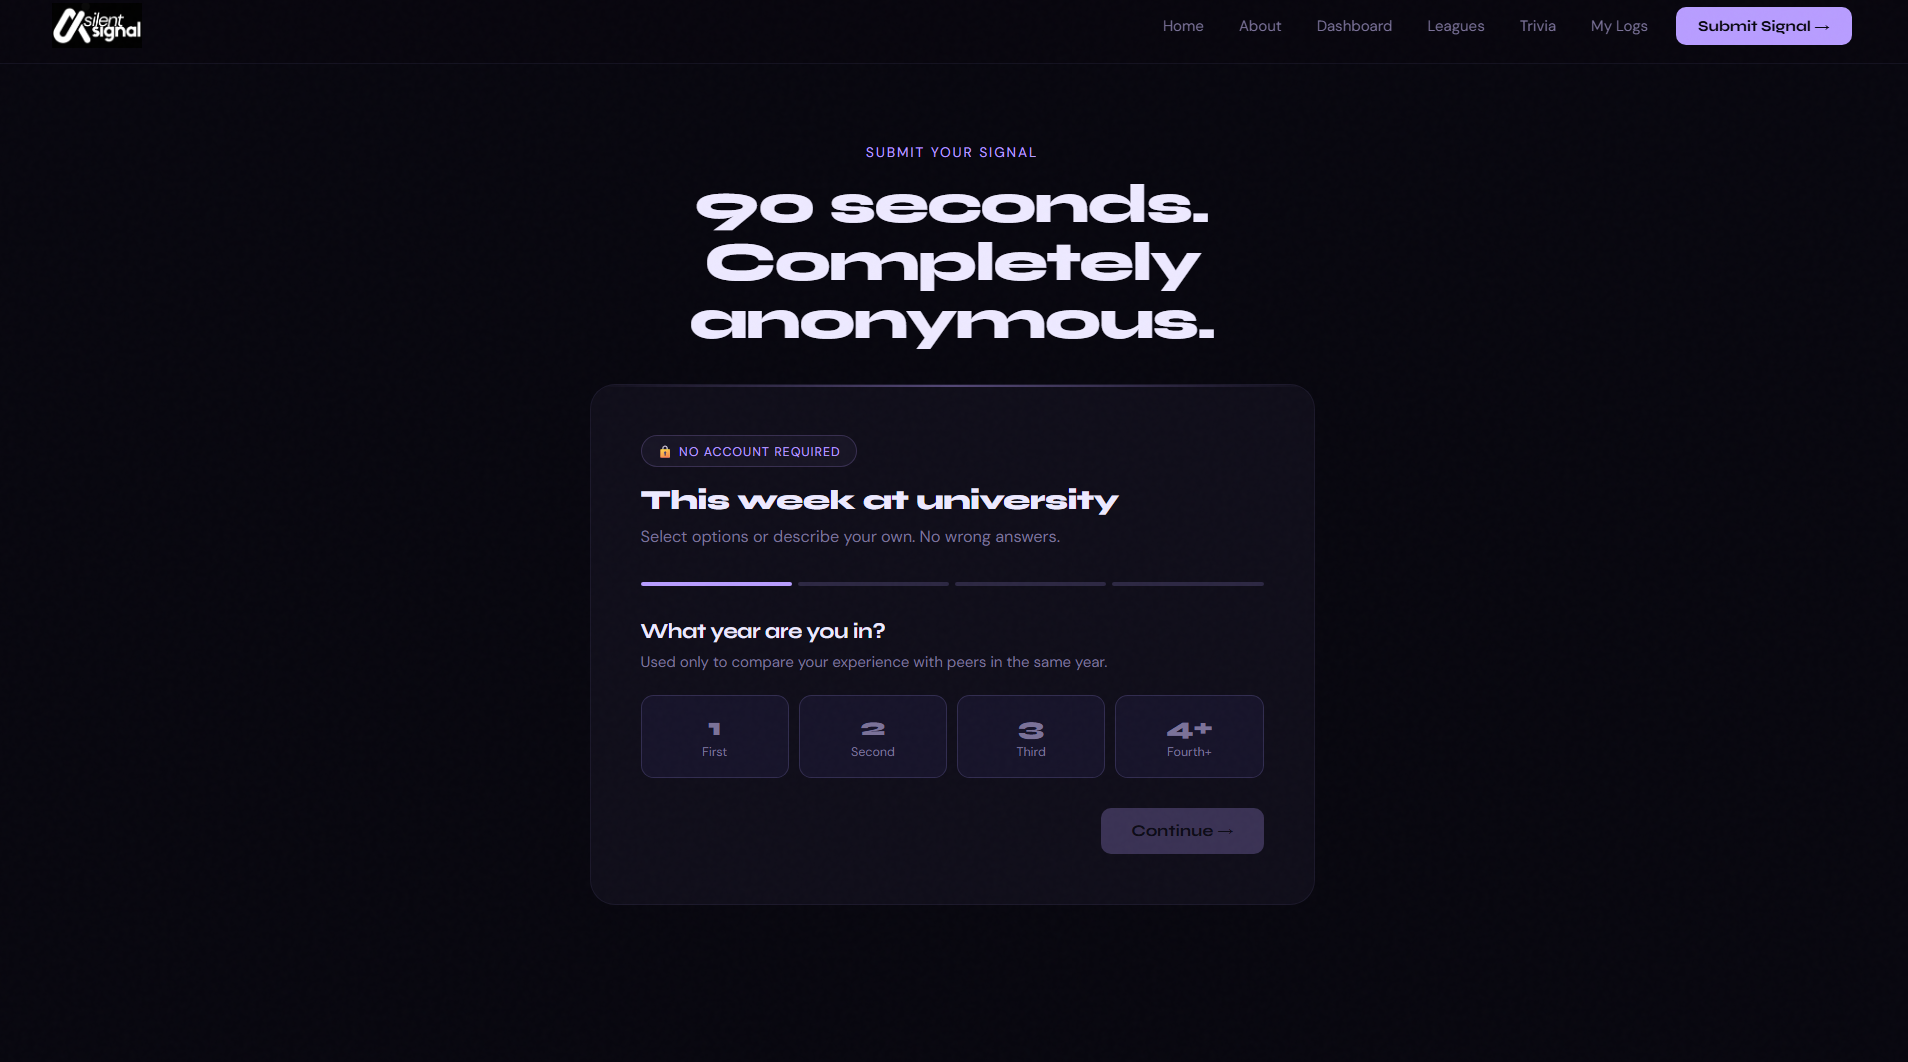
Submit your signal
-
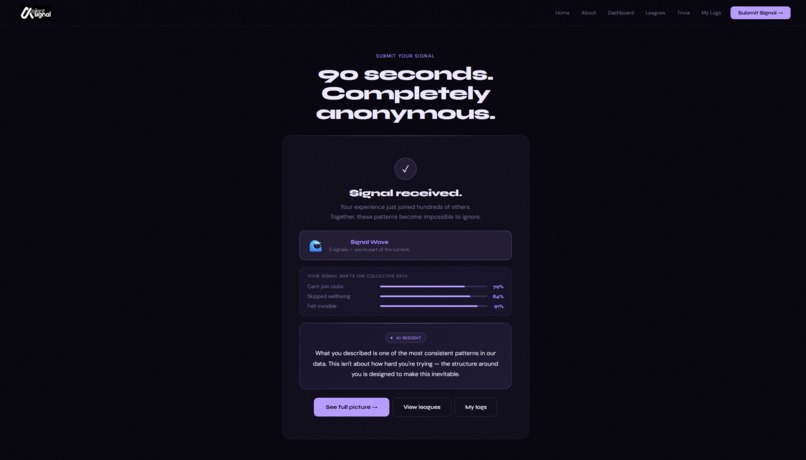
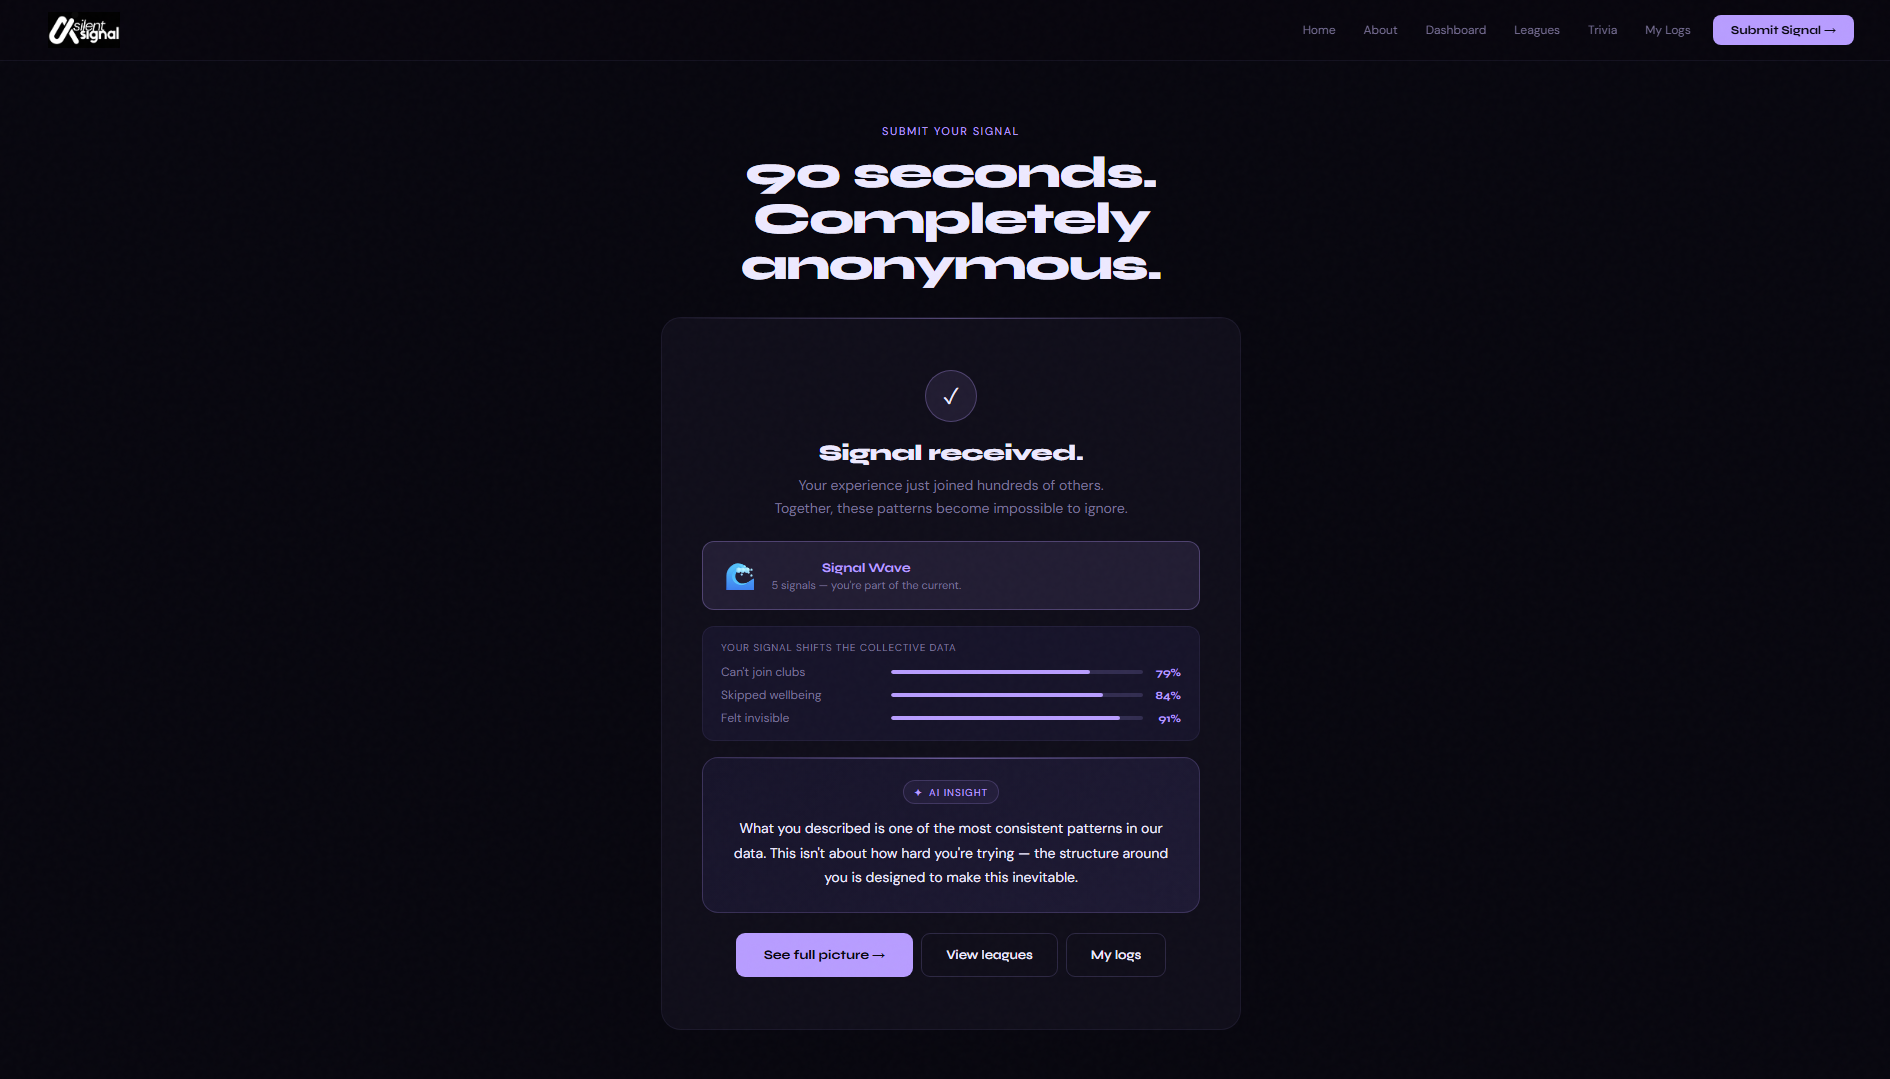
Signal sent
-
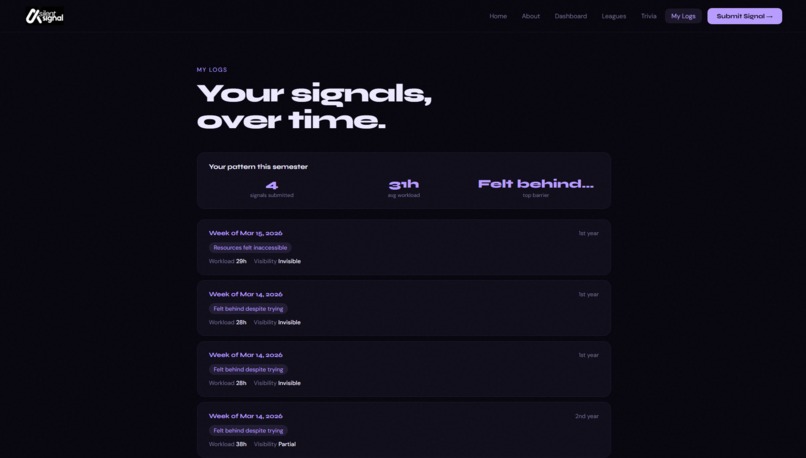
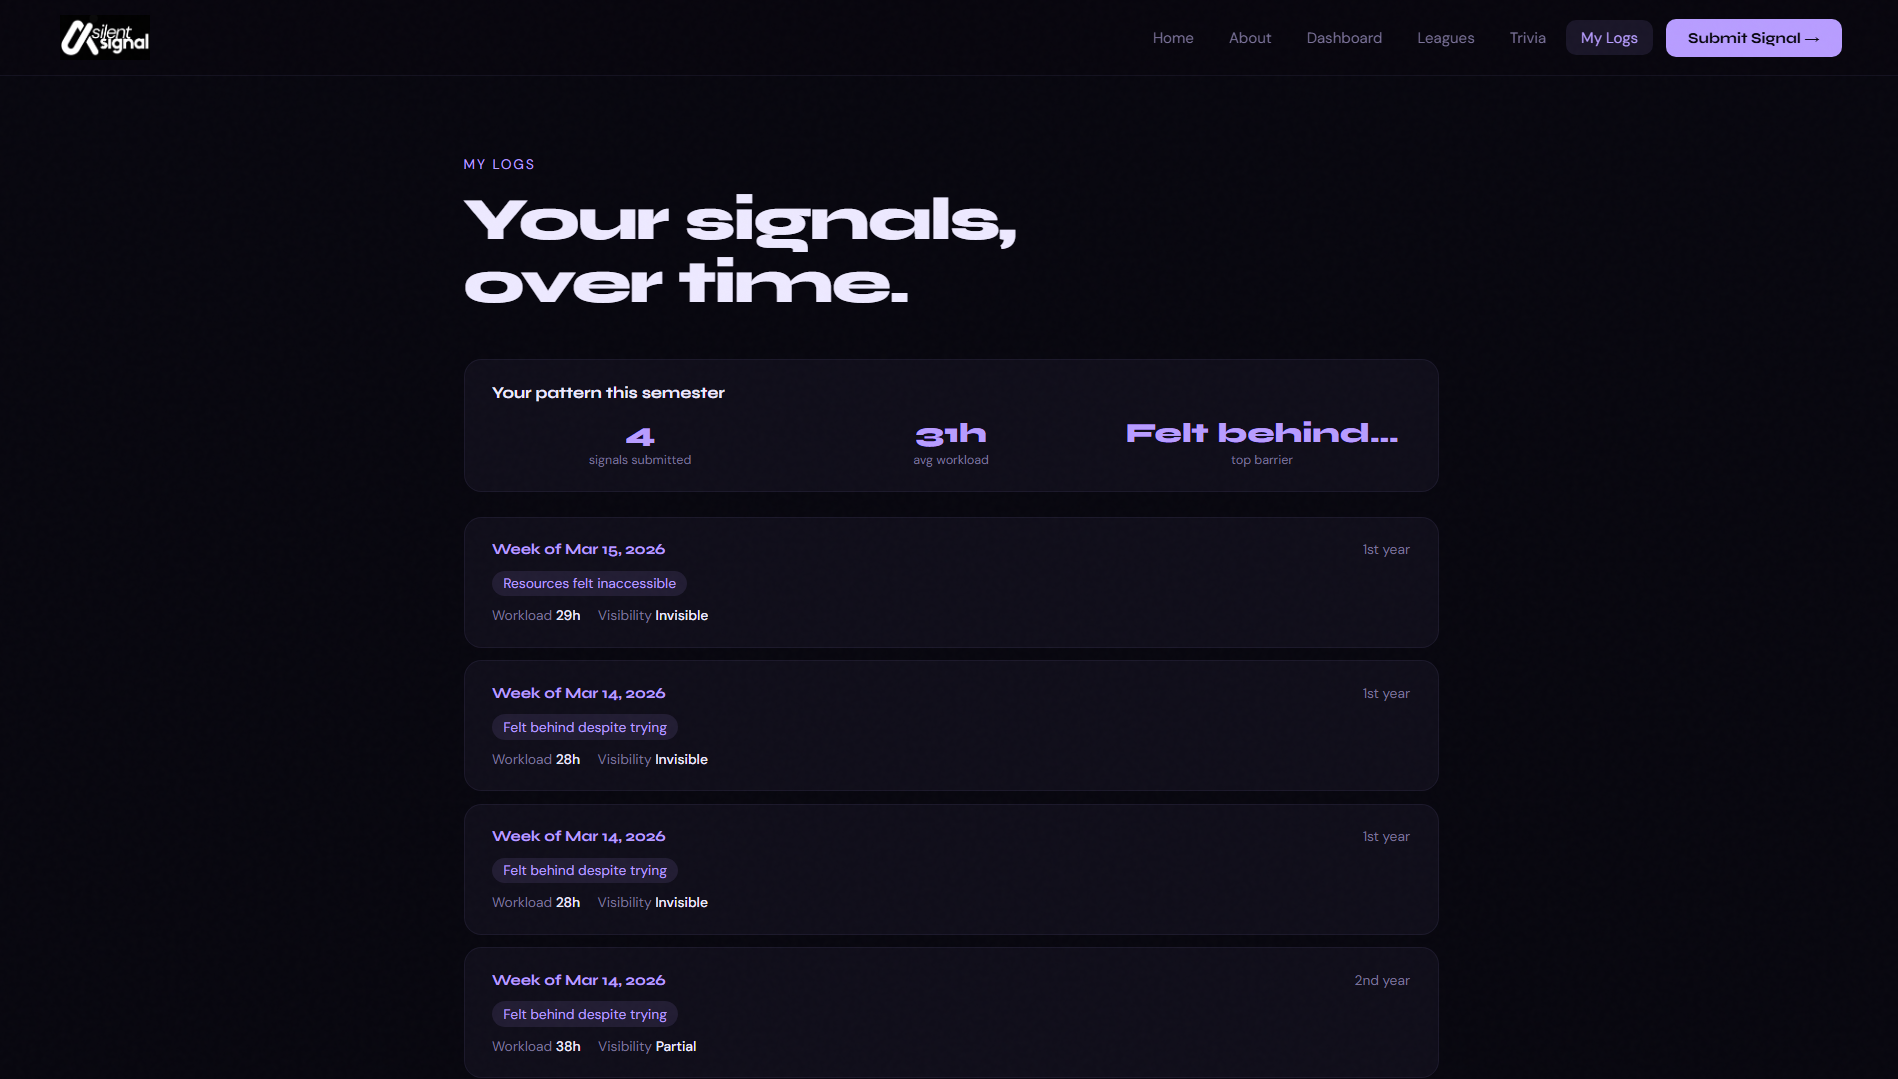
Collection of your submitted signals
Project Inspiration
Universities sell a promise - that if you engage with campus life, build connections, and push through the workload, you'll thrive. But for most students, the actual structure of a university makes that promise impossible to keep. The workload is too heavy to leave room for the clubs, friendships, and experiences the institution claims to offer. And when students struggle, the institutional response is to point to exceptional students who somehow do it all - which functions less as inspiration and more as a quiet accusation: it's possible, so if you're not doing it, that's on you.
What makes this worse is the silence it produces. Students don't just struggle - they internalize the gap as personal failure, which compounds into mental health issues they can't even voice to peers. The university's own culture of "highlight the exceptional" makes vulnerability feel like weakness.
We wanted to build something that broke that silence - not by asking students to journal their feelings, but by giving them a 90-second, fully anonymous way to report the systemic friction points in their week. Not "how are you feeling?" but "what got in your way?" The difference matters. One points inward. The other points at the system.
Challenges We Ran Into
Honestly, the hardest parts weren’t the ones we expected. The first major issue was the dashboard showing 0% for everything after we got the backend running. The backend was live, the endpoints were responding, but the frontend was falling back to hardcoded demo data because the database was empty — the stats engine correctly returned zeros when there were no submissions, which the frontend interpreted as “backend not available” and silently swapped out for fake numbers. We didn’t catch it for a while because the fake data looked real. The fix was seeding the database with realistic signals before connecting the frontend, and adding a clear distinction in the code between “backend is down” and “backend has no data yet.” The second issue was the Submit Signal button simply not working. The form would reach the final step, you’d click Submit, and nothing would happen. After digging in, it came down to the custom barrier chips — when a student typed their own barrier and added it, the JavaScript chip element wasn’t getting the right onclick binding, which meant the “at least one chip selected” check was never passing, and the submit button stayed disabled. It was a one-line fix once we found it, but it took longer than we’d like to admit. We also ran into CORS issues when the frontend tried to call the FastAPI backend locally — the browser was blocking requests because the backend wasn’t returning the right headers. Adding the CORS middleware to FastAPI resolved it, but it was a confusing 20 minutes where the app looked broken for no obvious reason. Coordinating between two people on the same repository while both actively pushing also caused some merge conflicts that needed careful manual resolution, particularly in main.py when we were both adding routes at the same time.
Accomplishments We’re Proud Of
The reframe is what we’re most proud of. The fact that a student can submit in 90 seconds and receive back not a label or a score but a piece of evidence — “this is what 79% of your peers reported this week” — feels genuinely different from anything we’d seen in the wellness space. It doesn’t pathologize. It contextualizes. We’re also proud of how much ground we covered in the time available: a real working backend with semantic memory, five distinct AI use cases, a dashboard that updates live, and an interface polished enough that it doesn’t feel like a hackathon project.
What We Learned
We learned that the most important design decision in a project like this is what you don’t ask. Not asking for a name, not asking how someone is feeling, not framing anything as a mental health check — those omissions are what make the tool feel safe and make the data honest. The constraint of “90 seconds, no account, no feelings” forced every design choice to be crisp. On the technical side, we learned that an empty database and a broken backend look identical from the frontend if you’re not careful about how you handle fallbacks. That distinction cost us real time.
What’s Next
A university-facing dashboard where student union reps can view aggregated data for their program and submit it directly as evidence in formal meetings with administration. Integration with the Moorcheh semantic memory API for persistent, retrievable pattern context across semesters. And partnerships with student unions at other Canadian universities to expand the signal network beyond UofT.
Technology Stack
Languages: Python, JavaScript, HTML, CSS
Frameworks and Libraries:
- FastAPI: backend API server
- Uvicorn: ASGI server for running FastAPI
- Pydantic: data validation for API payloads
- SQLite: lightweight database for storing anonymous signals
- Syne + DM Sans (Google Fonts): typography
Platforms:
- Anthropic Claude API - powers the AI Insight panel after signal submission and the live Signal AI chat on the dashboard
- GitHub - version control and collaboration
Tools:
- VS Code - primary development environment
- Live Server (VS Code extension) - local frontend development
- Claude (claude.ai) - used to build frontend
Product Summary
Silent Signal is an anonymous student experience tracker that turns individual struggle into collective, visible data - making systemic patterns impossible for institutions to ignore.
Students visit the site and complete a 90-second anonymous check-in: they select their year of study, choose which friction points got in their way that week (workload, clubs they couldn't join, feeling invisible, not reaching out for help), report their coursework hours, and indicate whether their university could see their struggle. No account. No email. No identifying information.
After submitting, they receive a personalized AI Insight - powered by Claude - that validates their experience in systemic terms, not personal failure language. Instead of "you might be struggling with anxiety," it says: "What you described is one of the most common patterns we see. This is the system, not you."
The live dashboard aggregates all submitted signals in real time, showing:
- Stat cards: total signals, average workload hours, % feeling invisible, % who skipped self-care
- Weekly signal volume bar chart
- Breakdown by year of study (interactive donut chart)
- Top friction points with animated percentage bars
- A live feed of anonymous submissions as they arrive
The dashboard also features Signal AI - an interactive Claude-powered chat that lets students, student union members, or faculty ask questions directly about the week's data. "What's the biggest systemic issue?" "Why aren't students asking for help?" "Generate the weekly report." It responds with data-backed, conversational insights in under 100 words.
Additional features include Signal Leagues (students discover which pattern tribe they belong to), NYT-style trivia about student well-being statistics, personal signal logs stored locally, badges earned through consistent submissions, and a live countdown to the submission deadline.
The core innovation is the reframe: this is not a wellness app, a journaling tool, or a diagnostic instrument. It is a signal aggregator that turns the invisible into evidence. Universities collect data on student success. Nobody collects data on student suffering - until now.
AI Use
60% of the code was generated by AI. Claude was used to help create the FastAPI backend and build the frontend.


Log in or sign up for Devpost to join the conversation.