-
-
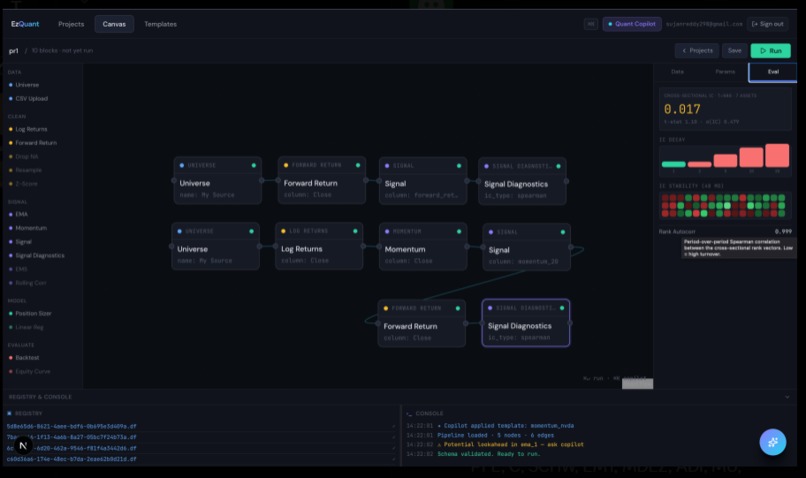
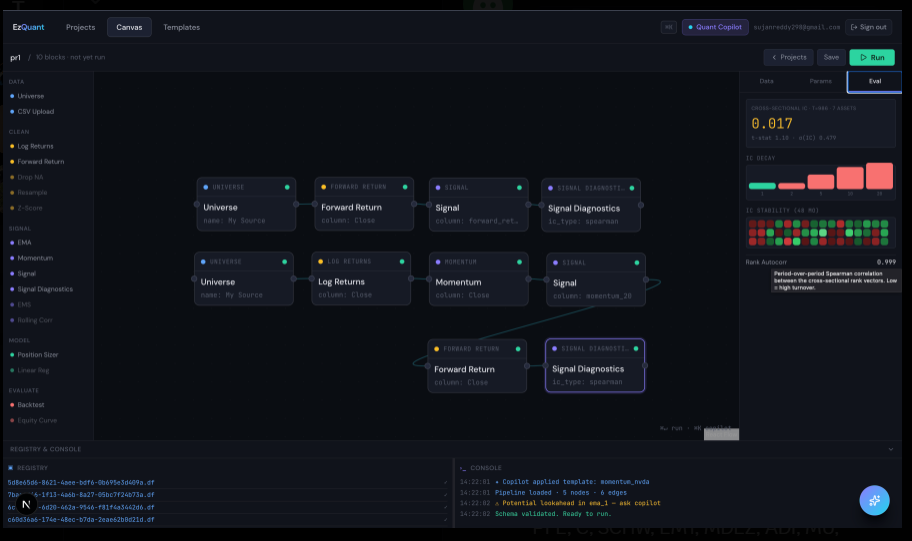
The User Canvas
-

Bloom your Ai Agent
-
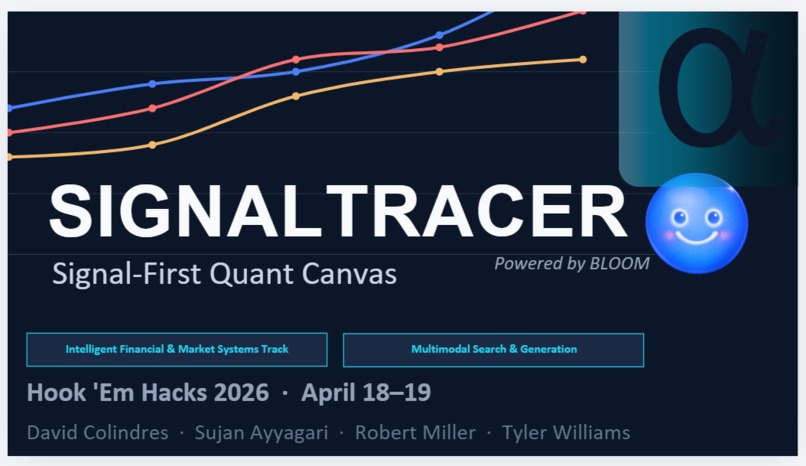
SIGNAL TRACER


Inspiration
Quant research is powerful but painful — messy Jupyter notebooks, hidden biases like lookahead leakage and survivorship bias in yfinance, and backtests that obscure the real theory. Inspired by HRT's data-first mindset and Jane Street's clean signal construction, we built SignalTracer: a visual React Flow canvas that makes building, trusting, and evaluating trading signals fast, educational, and honest.
What it does
SignalTracer lets you drag and drop blocks onto a React Flow canvas to build a complete quant signal pipeline in under 90 seconds — from raw ticker data through log returns (with an ADF stationarity gate), momentum/EMA/GARCH models, and a clean signal, all the way to a realistic backtest with costs and trading-native metrics like Sharpe ratio, Information Ratio, and equity curves.
Every block is a pure Python function enforcing a uniform contract The canvas is the authoritative view of the pipeline; the backend executes it with a topologically-sorted runner that forks per-ticker for multi-asset universes, enforces lookahead-safety inside the backtest, and aggregates cross-sectional diagnostics.
Complementing the builder is Bloom, an agentic RAG copilot powered by Gemini 2.5 Flash. Bloom can answer grounded quant-theory questions (147+ ingested PDFs), stage a full executable pipeline, the user can Apply or Reject, and diagnose failed runs by reading the serialized canvas state.
Every evaluation surfaces three mandatory disclosures — survivorship bias, idealized execution, and the need for walk-forward validation.
How we built it
Frontend: React + Vite + React Flow + Tailwind (dark theme) + Recharts + KaTeX. Backend: FastAPI + pandas + yfinance. We enforced a six-layer theoretical pipeline (Raw → Clean → Signal Families → Models → Signal → PnL → Evaluation) with consistent log returns, Adj Close, and permanent UI disclosures — built entirely during the hackathon with localStorage for persistence
Challenges we ran into
The hardest technical problem was implementing correct multi-parent DataFrame merging and topological sort in the executor while preventing lookahead bias. Balancing visual polish with rigorous theory — ADF gate, GARCH persistence, realistic PnL, non-intrusive disclosures — inside a 24-hour sprint was a close second
Accomplishments that we're proud of
We delivered a fully functional React Flow canvas with real backend execution, honest backtests, and embedded quant theory in a single sprint — turning what's usually a dry notebook exercise into an intuitive, educational visual tool. Bloom stands out as a domain-specialized agentic RAG assistant purpose-built for quant finance.
What we learned
Small math decisions have outsized consequences — log returns vs. pct_change, proper lagging, and frequency-aware Sharpe all meaningfully shift results. Visual interfaces dramatically accelerate understanding of complex concepts like volatility clustering and lookahead bias. And forcing honest disclosures into the UI builds genuine trust in the tool's output.
What's next for SignalTracer
Full multi-asset support, a hosted version with pipeline sharing, and expanded blocks for live data and advanced models.
Built With
- cachetools
- claude
- gemini
- next.js-16
- pytest
- python
- react
- reactflow
- recharts
- sql
- supabase
- tailind
- typescript
- vercel
- yfinance


Log in or sign up for Devpost to join the conversation.