Inspiration
Reliable Wi-Fi can frequently change depending on location, and time of day. I've experienced this in my personal life, as simply going across a building can cause your signal to disappear, which has been a conflict, in our modern, technological world. This is especially noticeable in large public spaces, such as schools, libraries, events, and more. I wanted to make these changes visible instead of relying on a wifi-speed test for one specific location.
What it does
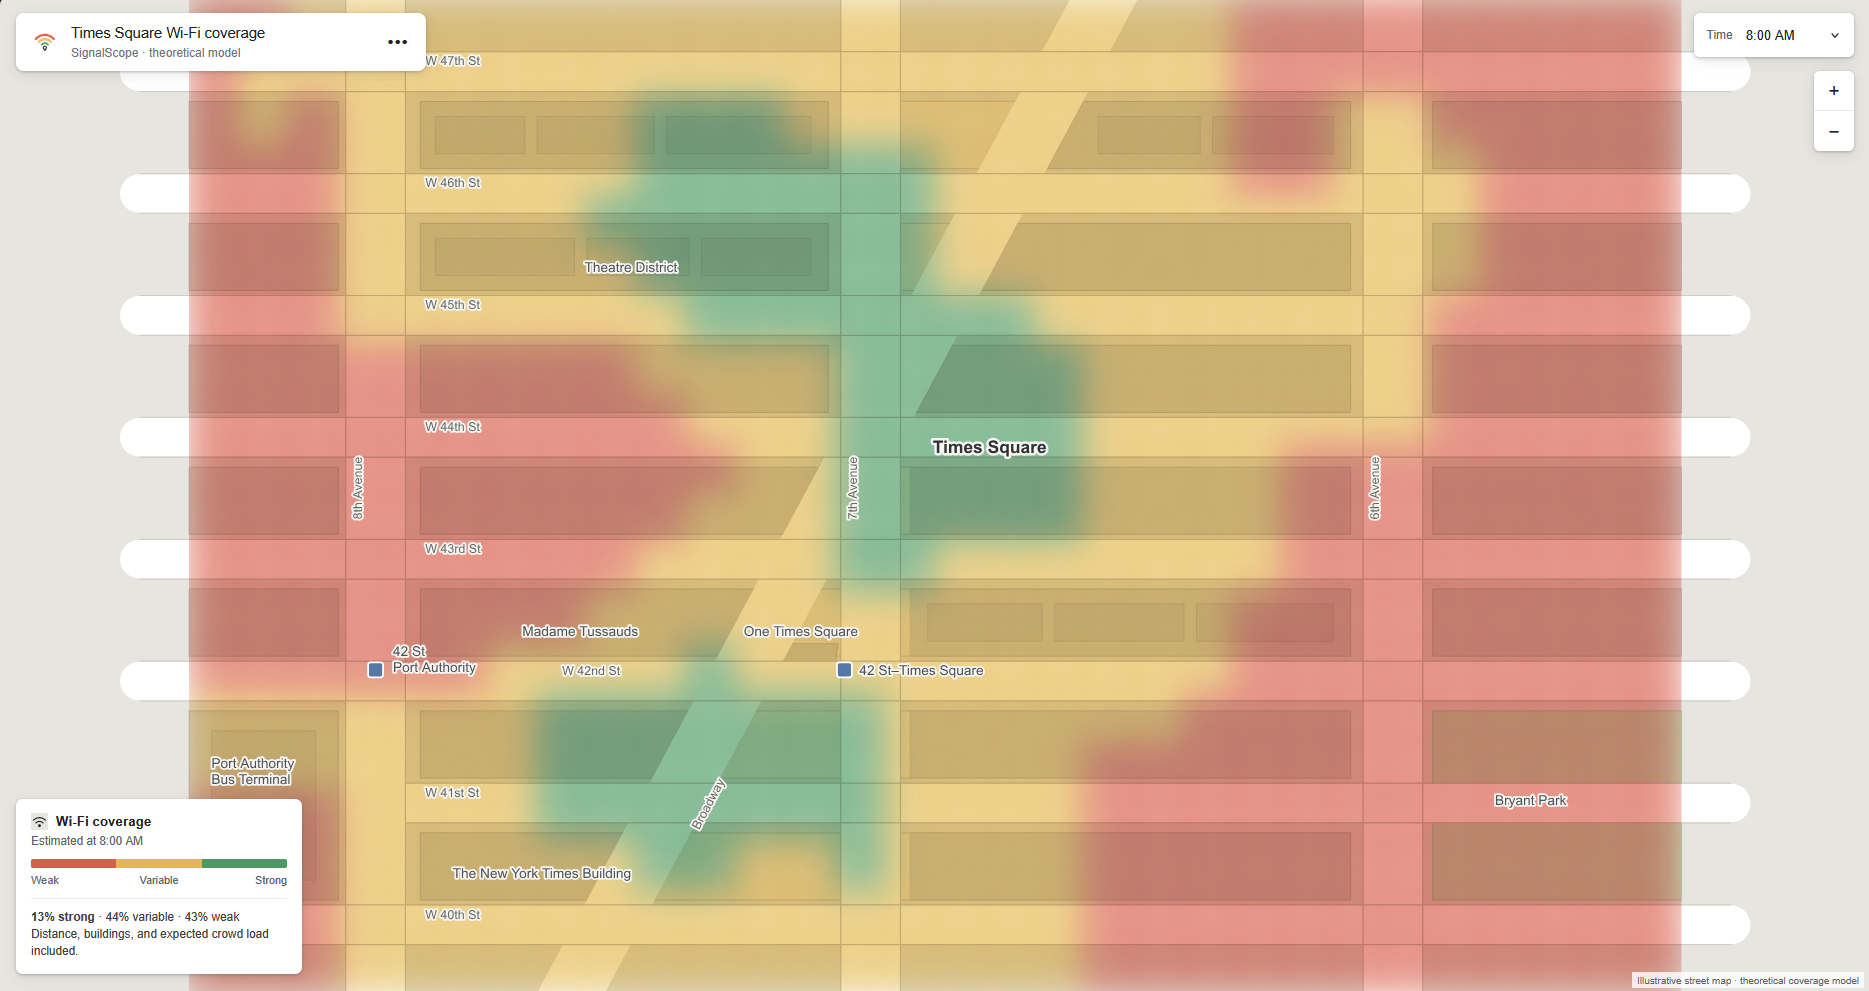
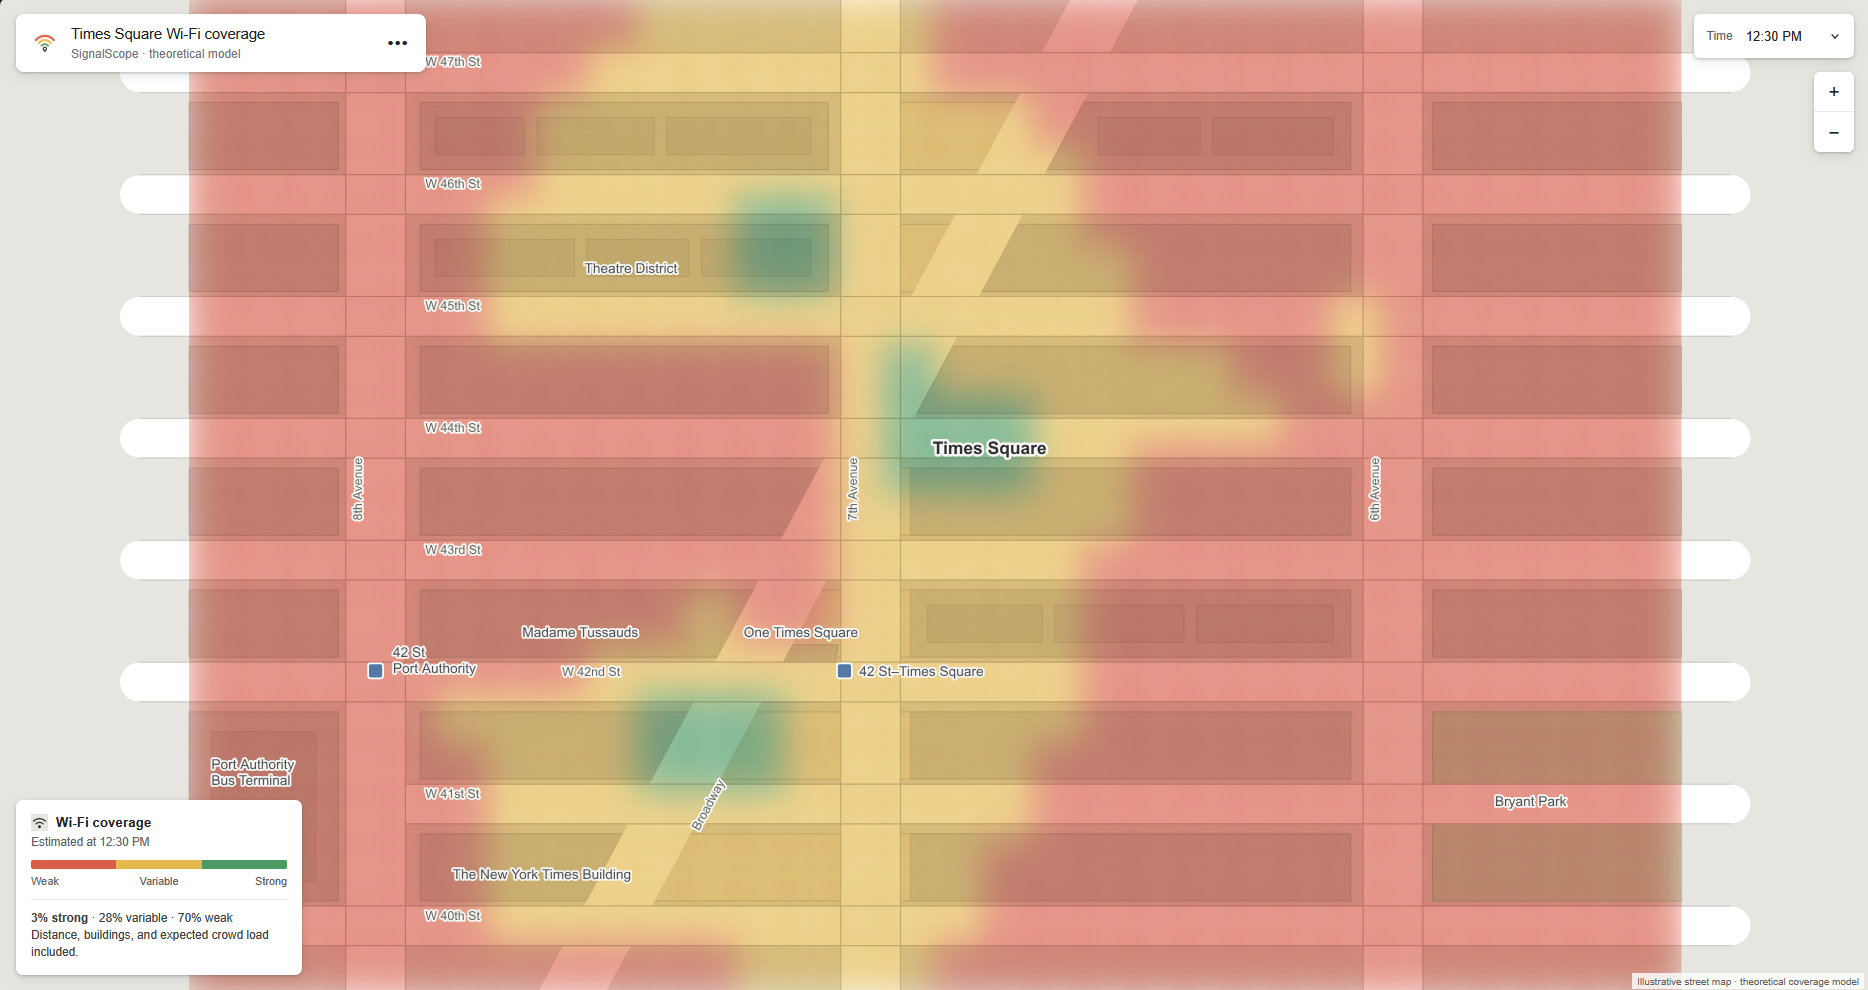
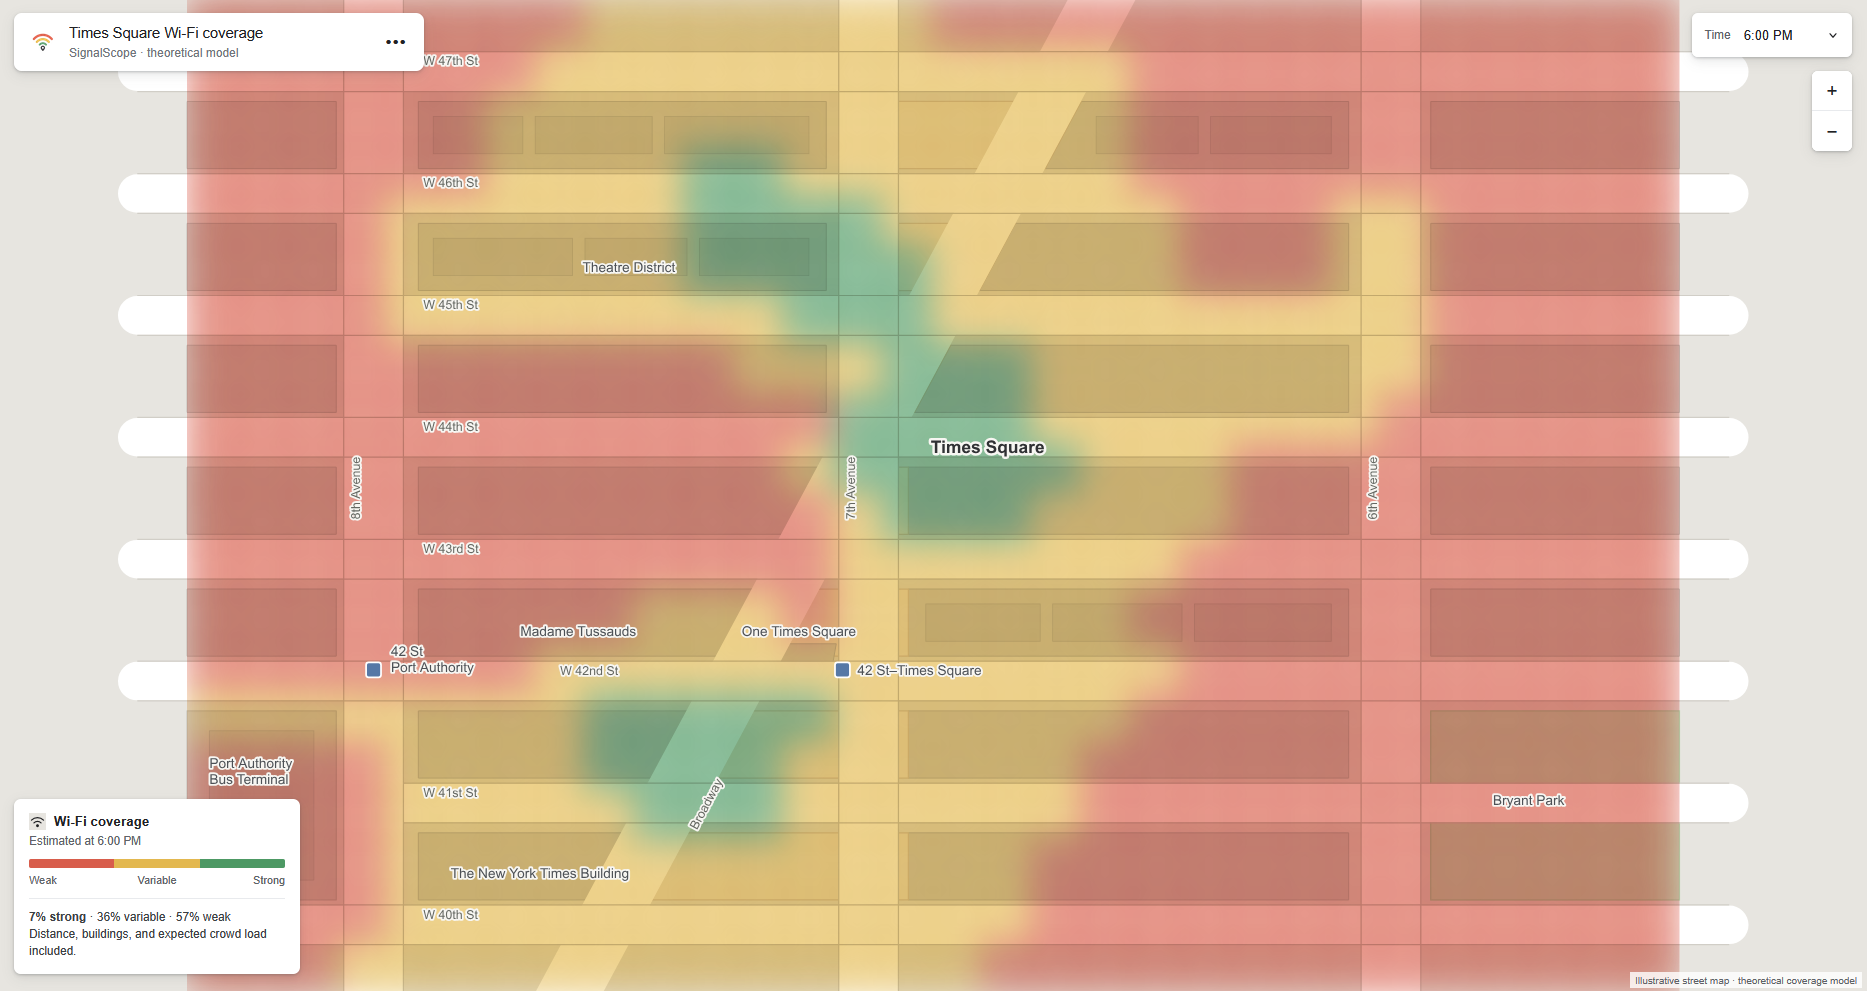
Signal Survey uses repeated network measurements to create a coverage map. Users can compare performance, weak readings, and fluctuations of wifi throughout the day.
Coverage Levels: -Green: Strong, stable connection -Yellow: Moderate connection -Red: Weak, unstable connection
This can help schools, centers, event organizers, and technicians identify areas needing further signal testing or methods for improving Wi-Fi coverage.
How we built it
I created a web prototype using HTML, CSS, JavaScript, and SVG. The interface uses Times Square as a demonstration area, with interactive time, filters, GPS support, controls, live simulation, etc. The current Wi-Fi measurements are simulated, since standard browsers do not have access to Wi-Fi signal strength. The prototype demonstrates a full standard experience. A production version may implement Android applications for RSSI, latency, packet-loss, GPS, and more.
Challenges we ran into
The largest challenge was presenting the various types of information without map reading conflicts for the user. I replaced measurement markers with heat zones, creating red, yellow, and green coverage areas for more effective recognition. Another challenge was signal strength and connection quality being difficult to seperate, since strong Wi-Fi may not always have a reliable connection. I also had to use browser privacy, so real connection cannot be achieved, but simulated data with GPS coordinates still effectively completes the goal.
Accomplishments that we're proud of
I'm proud of combining simple words into a practical product. My product has the capability to assist many people in their day to day lives. A responsive prototype visualizing Wi-Fi performance changes with easy readability may be implemented in the future to assist citizens. I'm also proud of the limits extended by this product, creating more than a network speed test, and demonstrating a more fleshed out, complex, problem solving mechanism than traditional standards allow for.
What we learned
I learned that location alone is not reliable for network details. Measurements are much more useful when compared over time and paired with latency and stability readings. I also learned that effective visualization can help with decision making. SignalScope is designed to show additional testing, adjustment, improvement or alteration demanding locations.
What's next for SignalScope
The next step is to connect the interface to an Android data collector, to read real Wi-Fi signal. Secure local storage, community feedback, confidence scores, floor-plan differentiation, and more may improve the effectiveness of the product.
Words Chosen
The selected words were GPS, Sensor, and Time
Built With
- browser
- css3
- html5
- javascript
- svg
- visual-studio
- web
- webdesign


Log in or sign up for Devpost to join the conversation.