I wanted the “Bloomberg terminal for sports” — not just scores, but early warnings with explanations. When momentum shifts, people ask two things: what changed and why now. SignalPlay answers both in real time.
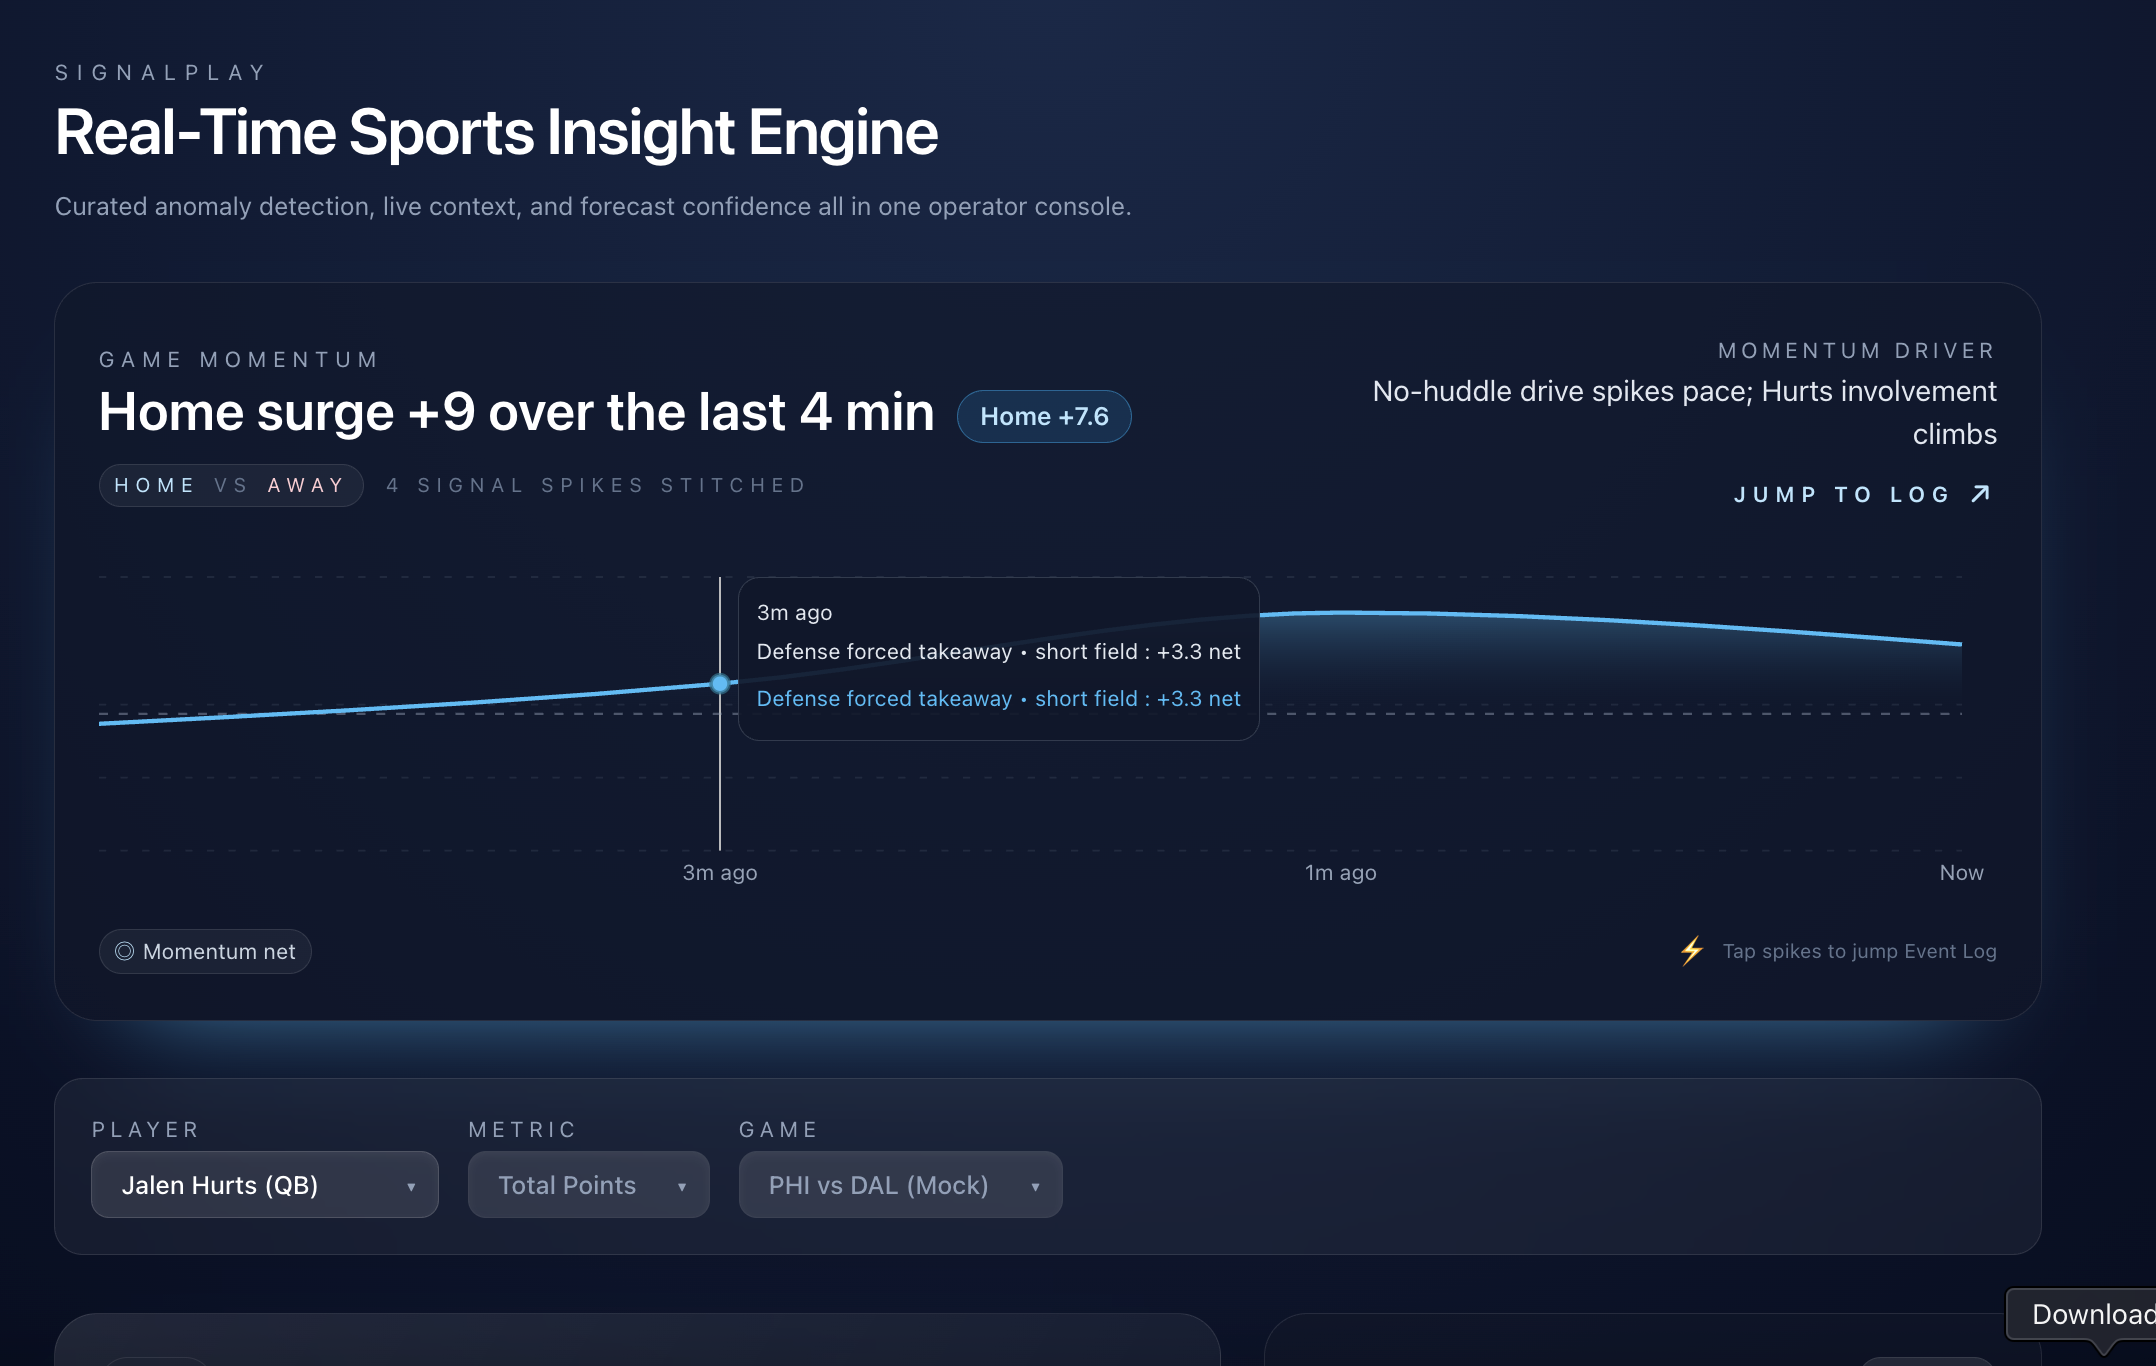
What I Built Real-time insight dashboard that detects volatility and anomalies, then explains them in plain English with a Why Meter and confidence. Ranked picks with probability, edge, and confidence, plus quick what-if sliders to see how pace/usage changes affect projections. Optional highlight clips: auto-pulls relevant video moments around detected pivots.
How I Built It Backend (FastAPI + DuckDB + Polars) Ingests Pulse Mock data (players, games, lines) and writes to DuckDB. Builds rolling features and a lightweight probabilistic model:
Normal-over probability via error function: pover=12(1−erf(line−μ2 σ))p_{\text{over}} = \tfrac{1}{2}\Bigl(1 - \operatorname{erf}\Bigl(\tfrac{\text{line}-\mu}{\sqrt{2}\,\sigma}\Bigr)\Bigr)pover=21(1−erf(2σline−μ)) Expected edge with payout π\piπ (e.g., 0.909 for -110): E=pover⋅π−(1−pover)E = p_{\text{over}}\cdot \pi - (1 - p_{\text{over}})E=pover⋅π−(1−pover) Volatility-aware confidence from recent vs. longer-term variance.
Clean endpoints: GET /picks GET /players GET /markets Optional: GET /series, GET /game
Frontend (Next.js + TypeScript + Tailwind) SSE + Web Worker compute EWMA, z-scores, simple CUSUM for real-time anomaly detection: μt=αxt+(1−α)μt−1,zt=xt−μtσt\mu_t = \alpha x_t + (1-\alpha)\mu_{t-1},\quad z_t = \frac{x_t - \mu_t}{\sigma_t}μt=αxt+(1−α)μt−1,zt=σtxt−μt UI panels: Live video overlay captions Volatility list Why Meter cards Momentum heatmap Calibration widget What-If sliders Recharts for sparklines, smooth streaming updates, and low-latency UX.
What I Learned Explainability > raw accuracy: concise, evidence-backed “why”s drive trust and action. Calibration matters: aligning ppp with outcomes is as important as lift. Volatility is a feature: mixing short- and long-window variance improves confidence scoring. Latency budgets: pushing compute into a Worker keeps the UI crisp while streams update.
Challenges Data realism vs. demo control: crafting believable surges without noisy false alarms. Calibration drift: changing variance breaks naive thresholds; blended σ5\sigma_{5}σ5 and σ20\sigma_{20}σ20 stabilized confidence. Explainable “why”s: terse, non-generic sentences that still capture context (pace, usage, matchups). Streaming UX: preventing jitter and chart reflows while keeping insights fresh. Edge compute balance: what to precompute in the backend vs. derive in the Worker for snappy interactions.
What’s Next Richer models (Nixtla MLForecast/StatsForecast) with conformal prediction for better σ\sigmaσ. RAG-enhanced Why Meter using play-by-play and prior summaries. Multi-league expansion and team-aware priors for faster cold starts. Human-in-the-loop feedback to tune phrasing and confidence thresholds.
North Star Know the momentum early. Know the “why.” Act with confidence.
Built With
- and
- asyncio)
- data)
- duckdb
- integrates
- mock
- numpy/scipy;-next.js-(react
- optional
- polars
- pulse
- python-(fastapi
- recharts
- shadcn/ui
- sse;
- tailwind
- twelvelabs
- typescript)
- web-workers


Log in or sign up for Devpost to join the conversation.