Inspiration
Every organization has employees who see problems before the systems do. A utility technician notices a transformer running hot on Monday. A bank teller flags a sluggish ATM. A nurse reports a warm ward. These observations exist in WhatsApp messages, verbal reports, and maintenance logs — but they never reach the people who can act on them in time. By the time a system alarm fires or customers start calling, the damage is done.
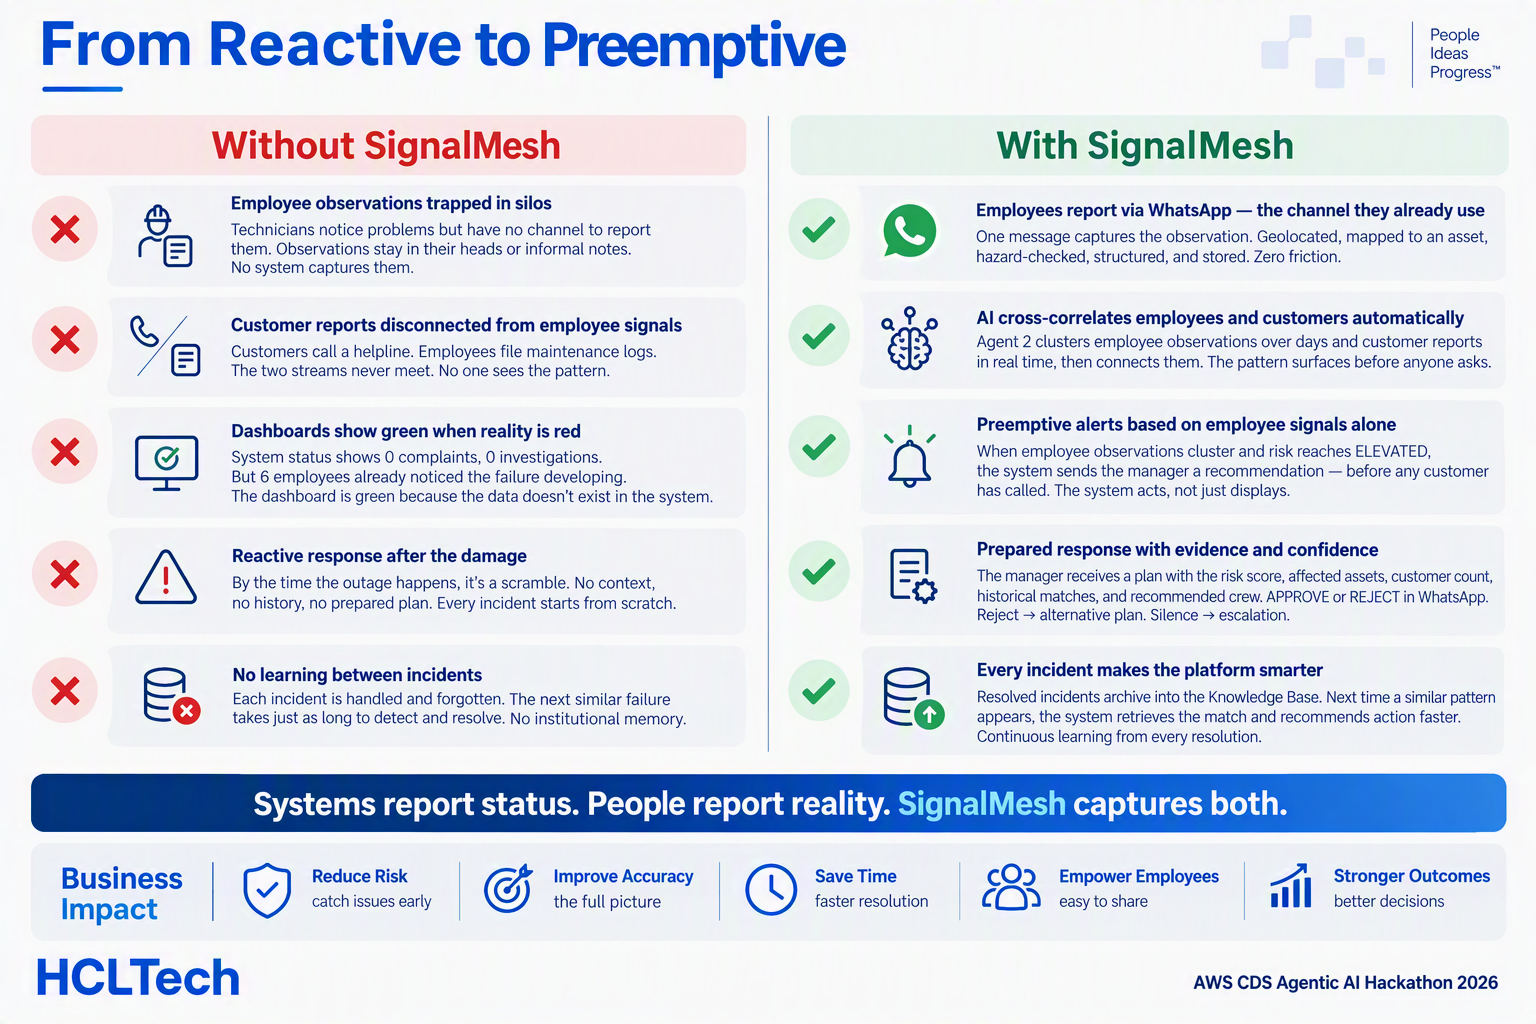
The deeper problem is that the people who matter (customers, employees, and management) operate in silos. Customers report to a helpline. Employees file observations in a maintenance system. Managers see dashboards that aggregate neither. The information exists across all three groups; the connection between them does not.
We asked: what if you could break those silos and correlate what employees observe with what customers report, surface the pattern to management, and act on it before the failure happens?
What it does
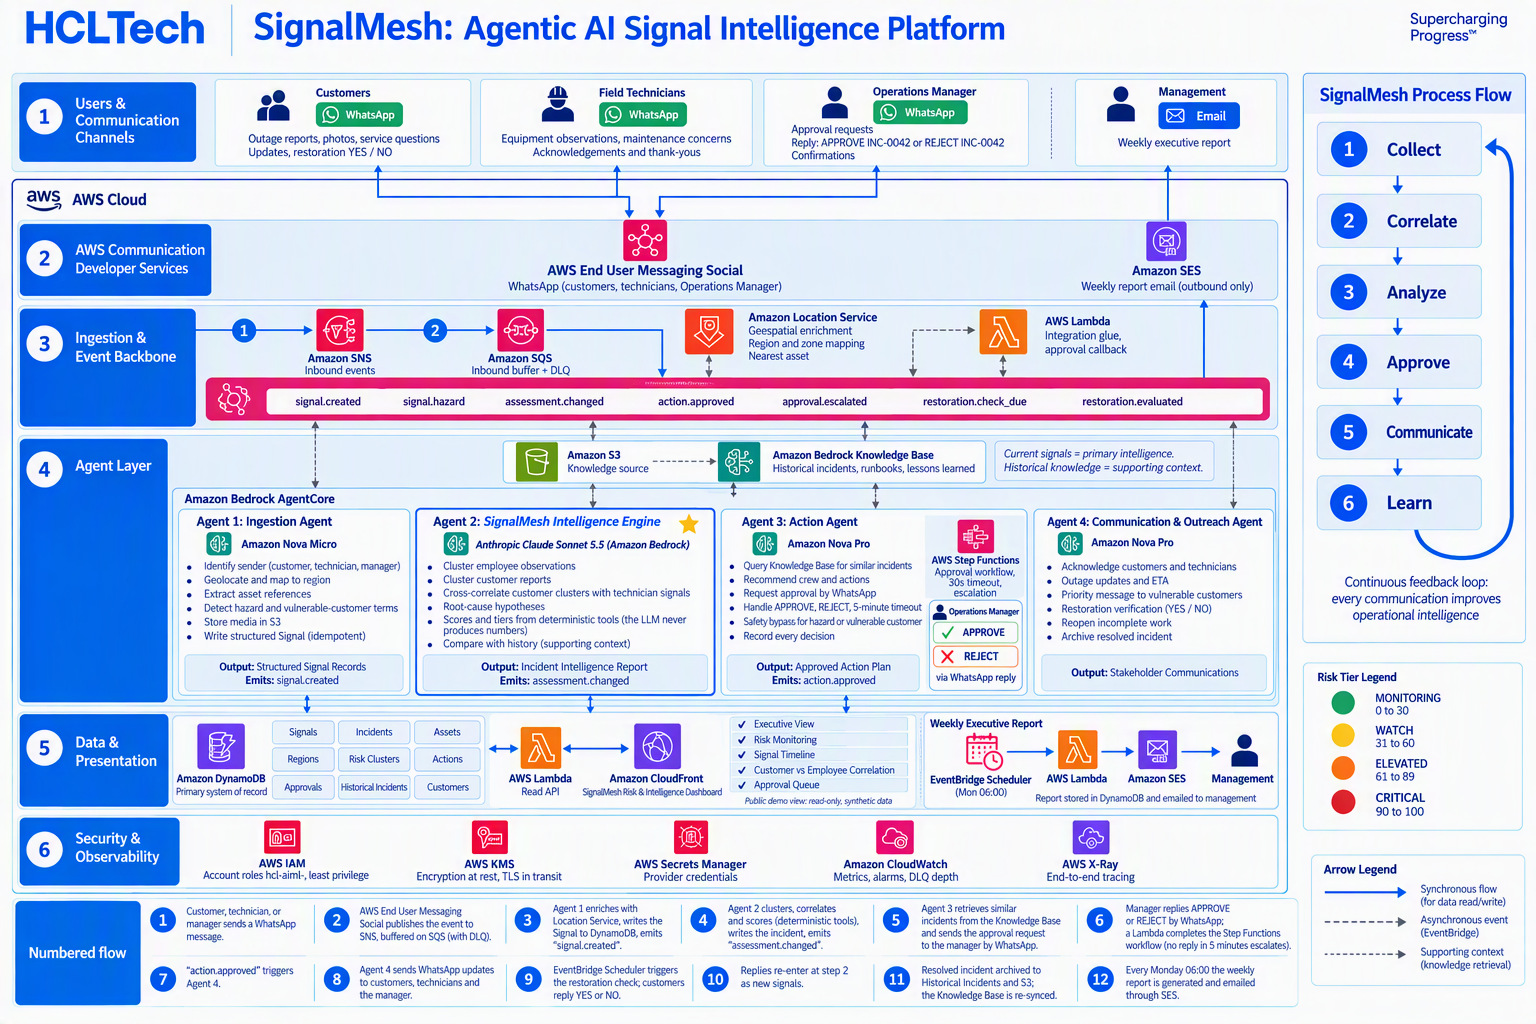
SignalMesh is an agentic signal intelligence platform that proactively engages employees and customers via WhatsApp, correlates their observations, and resolves issues before they escalate. It connects three stakeholder groups that traditionally operate in isolation:
- Customers report issues and receive status updates, ETAs, and restoration checks — all via WhatsApp.
- Employees (field technicians, branch staff, floor nurses) submit observations from the front line — the earliest signals in any organisation — and receive acknowledgements when their report contributes to an assessment.
- Management (operations managers, supervisors) receive actionable recommendations with evidence and confidence scores, approve or reject via WhatsApp, and receive a weekly executive report via email summarising incidents, risk trends, and response times.
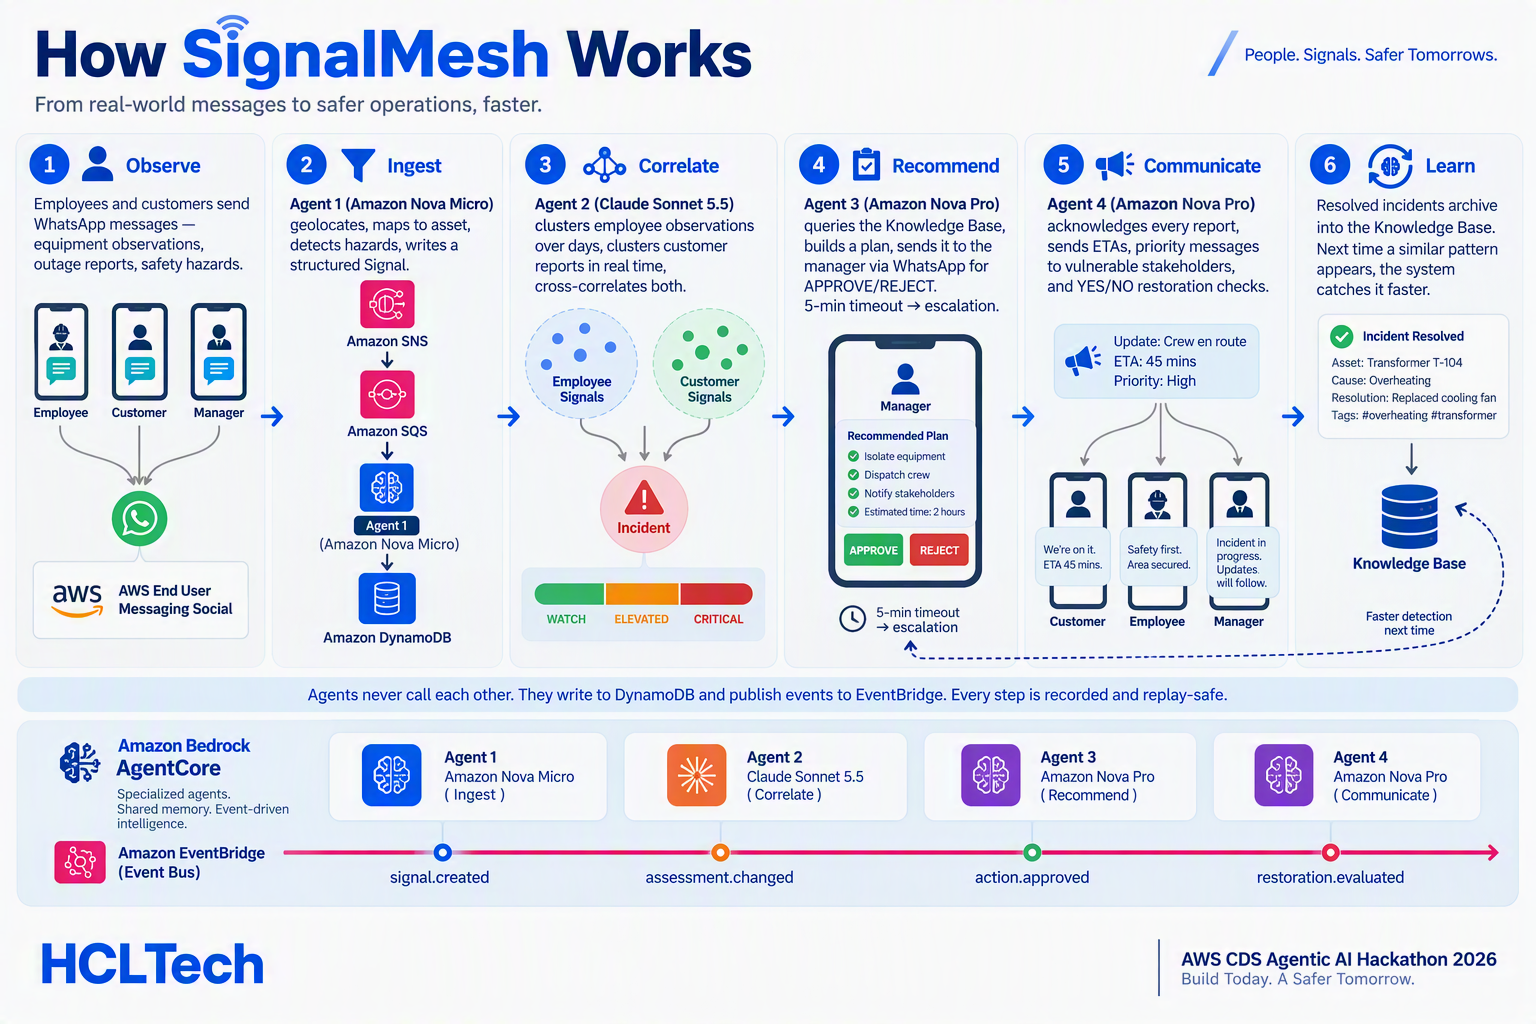
Four AI agents work as a pipeline to connect these groups:
- Agent 1 — Ingestion: Every WhatsApp message from an employee or customer is geolocated, mapped to an operational asset, checked for hazards and vulnerable individuals, and recorded as a structured signal.
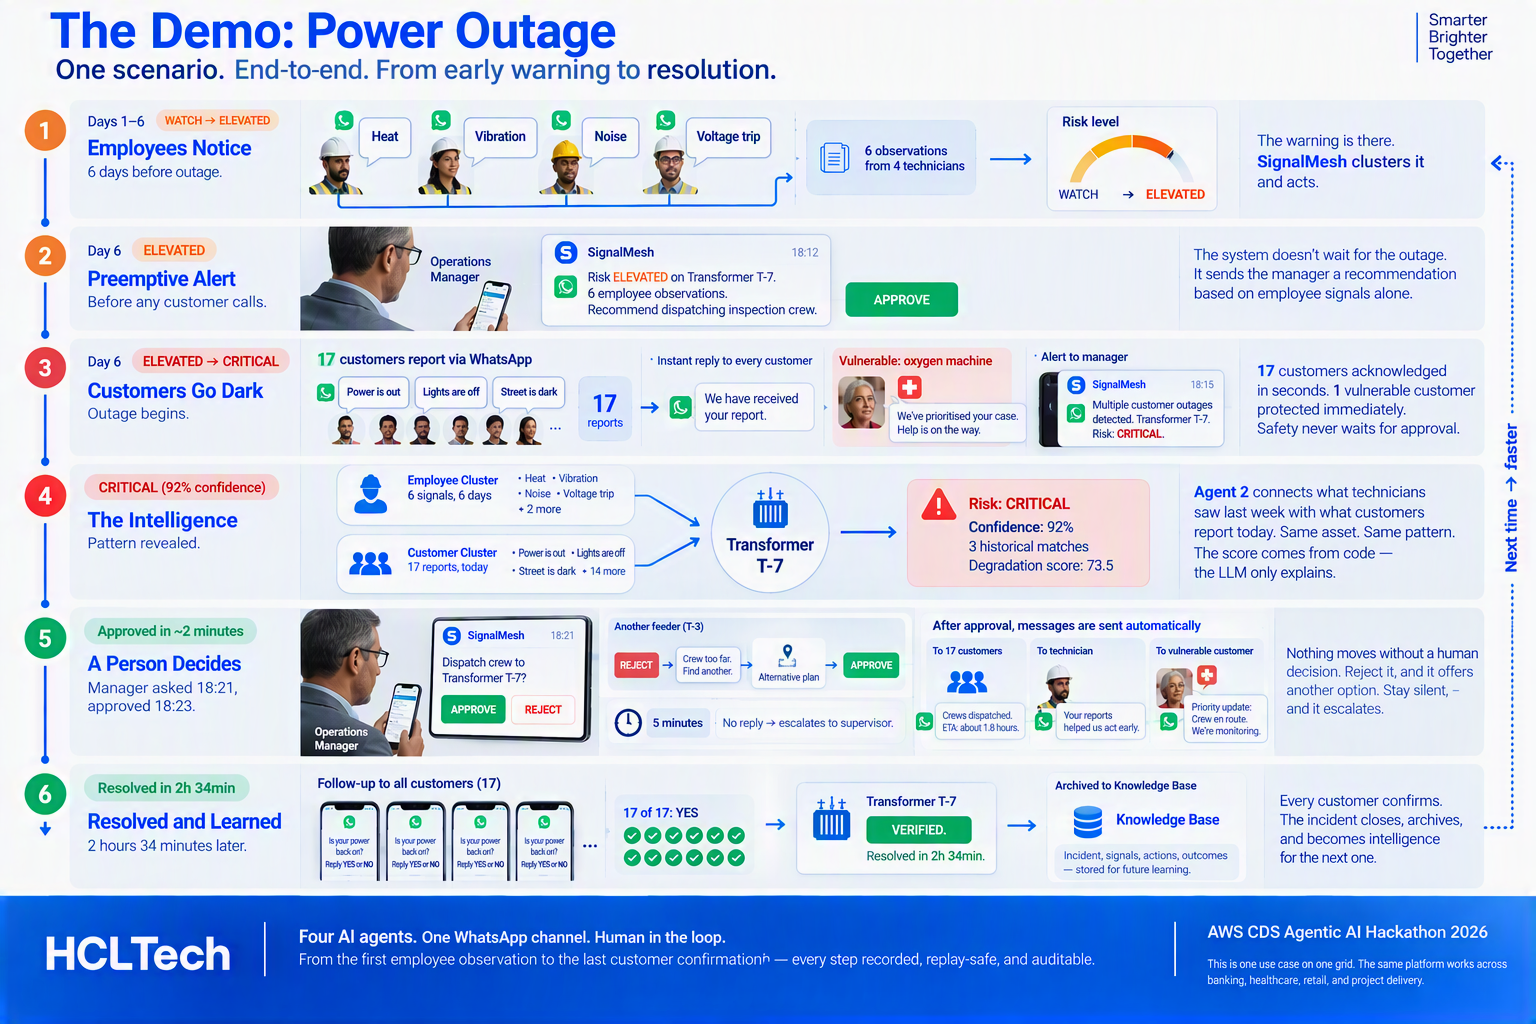
- Agent 2 — Intelligence: Employee observations are clustered over a rolling time window. Customer reports are clustered in real time. The engine cross-correlates the two, surfacing patterns no single report reveals, often days before a failure escalates. Risk scores and confidence values come from deterministic code; the LLM explains the reasoning but never invents a number.
- Agent 3 — Action: The system doesn't just score risk on a dashboard, it acts. It sends the operations manager a recommendation via WhatsApp with the evidence, confidence score, and suggested response. Reject it, and it offers an alternative. Stay silent for five minutes, and it escalates. Nothing moves without human approval, except safety-critical signals involving hazards or vulnerable individuals, which bypass the queue.
- Agent 4 — Communication: Every stakeholder is kept informed. Customers get acknowledgements within seconds, status updates with ETAs, and a YES/NO restoration check when the repair time is up. Vulnerable individuals get priority messages immediately. The employee who first noticed the problem learns their report mattered. Management receives decision confirmations and closure notifications.
Every resolved incident feeds back into the Knowledge Base. The next time a similar pattern appears — on any asset, in any region — the system catches it faster and recommends a response sooner. The platform learns from every incident it handles.
How we built it
Amazon Bedrock AgentCore hosts all four agent runtimes. Each agent uses a different model suited to its task:
| Agent | Model | Why |
|---|---|---|
| Ingestion | Amazon Nova Micro | Fast, low-cost classification and entity extraction |
| Intelligence | Anthropic Claude Sonnet 5.5 | Complex cross-correlation reasoning and root-cause explanation |
| Action | Amazon Nova Pro | Knowledge Base retrieval, plan generation, approval orchestration |
| Communication | Amazon Nova Pro | Multi-stakeholder message drafting and tone adaptation |
AWS Communication Developer Services handle all messaging:
- AWS End User Messaging Social — WhatsApp is the single channel for all three stakeholder groups: customers report issues and confirm restoration, employees submit field observations and receive acknowledgements, and operations managers receive approval requests and respond with APPROVE or REJECT.
- Amazon SES — Delivers the automated weekly executive report to management every Monday, summarising the week's incidents, risk trends, response times, and resolution outcomes. The report is compiled by a scheduled Lambda, stored in DynamoDB for audit, and emailed through SES.
Core AWS services: Amazon DynamoDB (system of record), Amazon EventBridge (event backbone and weekly report scheduler), Amazon SQS/SNS (ingestion buffer with DLQ), AWS Step Functions (approval workflow with 5-minute timeout and escalation), AWS Lambda (integration glue), Amazon Location Service (geospatial enrichment), Amazon S3 (media storage and Knowledge Base source), Amazon CloudFront (dashboard hosting), Amazon CloudWatch and AWS X-Ray (observability).
Architecture principle: Agents never call each other directly. Each writes to DynamoDB and publishes an identifier-only event to EventBridge. The next agent reacts. This makes every handler idempotent — replaying any event produces the same result.
SignalMesh Risk & Intelligence Dashboard
The operations dashboard, hosted on Amazon CloudFront, gives management and operations teams a real-time view across the entire platform:
- Executive View — High-level summary of active incidents, risk distribution, and resolution metrics across all regions.
- Risk Monitoring — Live risk scores by asset and region, with the intelligence engine's reasoning for each assessment, including the employee-to-customer correlation that triggered it.
- Signal Timeline — Chronological view of every signal (employee observations and customer reports) mapped to assets, showing how early warnings evolved into incidents.
- Customer vs. Employee Correlation — Side-by-side view of employee observation clusters and customer report clusters, showing the cross-correlation that powers the intelligence engine.
- Approval Queue — Pending, approved, and rejected action plans with full audit trails, manager decisions, and escalation history.
Weekly Executive Report
Every Monday at 06:00, an EventBridge Scheduler triggers a Lambda that compiles the week's incidents, risk trends, response times, and resolution outcomes into a structured executive report. The report is stored in DynamoDB for audit and delivered to management via Amazon SES. This gives leadership a recurring, automated summary of operational intelligence without requiring them to log into the dashboard — connecting management to the front line on a weekly cadence.
Demo/ Testing Instructions
SignalMesh Risk & Intelligence Dashboard
Explore the live dashboard to see how SignalMesh processes signals, correlates employee observations with customer reports, and tracks incidents in real time.
Dashboard URL: https://d2fcuh757mqik5.cloudfront.net
Password: i0EI9iK_FZxOVihzgOpf7qqg
What to look for:
- Executive View — Active incidents, risk distribution, and resolution metrics across all regions
- Risk Monitoring — Live risk scores by asset with the intelligence engine's reasoning for each assessment
- Signal Timeline — Chronological view of employee observations and customer reports mapped to assets, showing how early warnings evolved into incidents
- Customer vs. Employee Correlation — Side-by-side view showing how independent employee observation clusters and customer report clusters converge on the same asset
- Approval Queue — Pending, approved, and rejected action plans with full audit trails and manager decisions
SignalMesh on WhatsApp
Message SignalMesh directly to see how the platform engages with employees and customers via AWS End User Messaging Social.
WhatsApp Number: +65 8657 4427
Send a message as a customer reporting an issue or an employee sharing an observation — the agent will ingest, acknowledge, and process your message in real time.
Challenges we faced
- RCS quota: Our original design used RCS for customer messaging. The quota increase was denied, so we pivoted to WhatsApp via EUM Social for all roles — which turned out to be a better design. One channel, every stakeholder.
- The LLM-numbers problem: Early prototypes let the language model generate risk scores and confidence values. The numbers were plausible but unreliable. We moved all scoring into deterministic tools and restricted the LLM to reasoning and explanation only. This is now a core architectural rule.
- Breaking the silos: The hardest problem was not technical — it was designing a system where three stakeholder groups (customers, employees, management) that traditionally never share context are connected through a single intelligence pipeline. Each group's input enriches the others: employee observations give customer reports context, customer reports validate employee hunches, and management gets both sides before making a decision.
- Preemptive vs. reactive framing: Deciding when employee observations alone should trigger action — without waiting for customer impact — was a critical design choice. We settled on: employee clusters that reach ELEVATED risk are sent to the manager for preemptive approval. The system acts on what employees know, not just what customers report.
What we learned
- Front-line employees are the earliest signal in any organisation. The data was always there — in text messages, verbal reports, maintenance notes. The gap was never data collection; it was correlation and action.
- Silos are the real enemy. Customers, employees, and management each hold a piece of the picture. The value is not in any one group's data — it is in connecting all three. SignalMesh's core contribution is making that connection automatic, auditable, and actionable.
- Current observations must be primary intelligence. Historical incidents are valuable context, but they must never override what employees and customers are reporting right now. This principle guided every design decision.
- Continuous learning compounds. Every resolved incident archived into the Knowledge Base makes the next similar incident faster to detect and resolve. The platform gets measurably better over time.
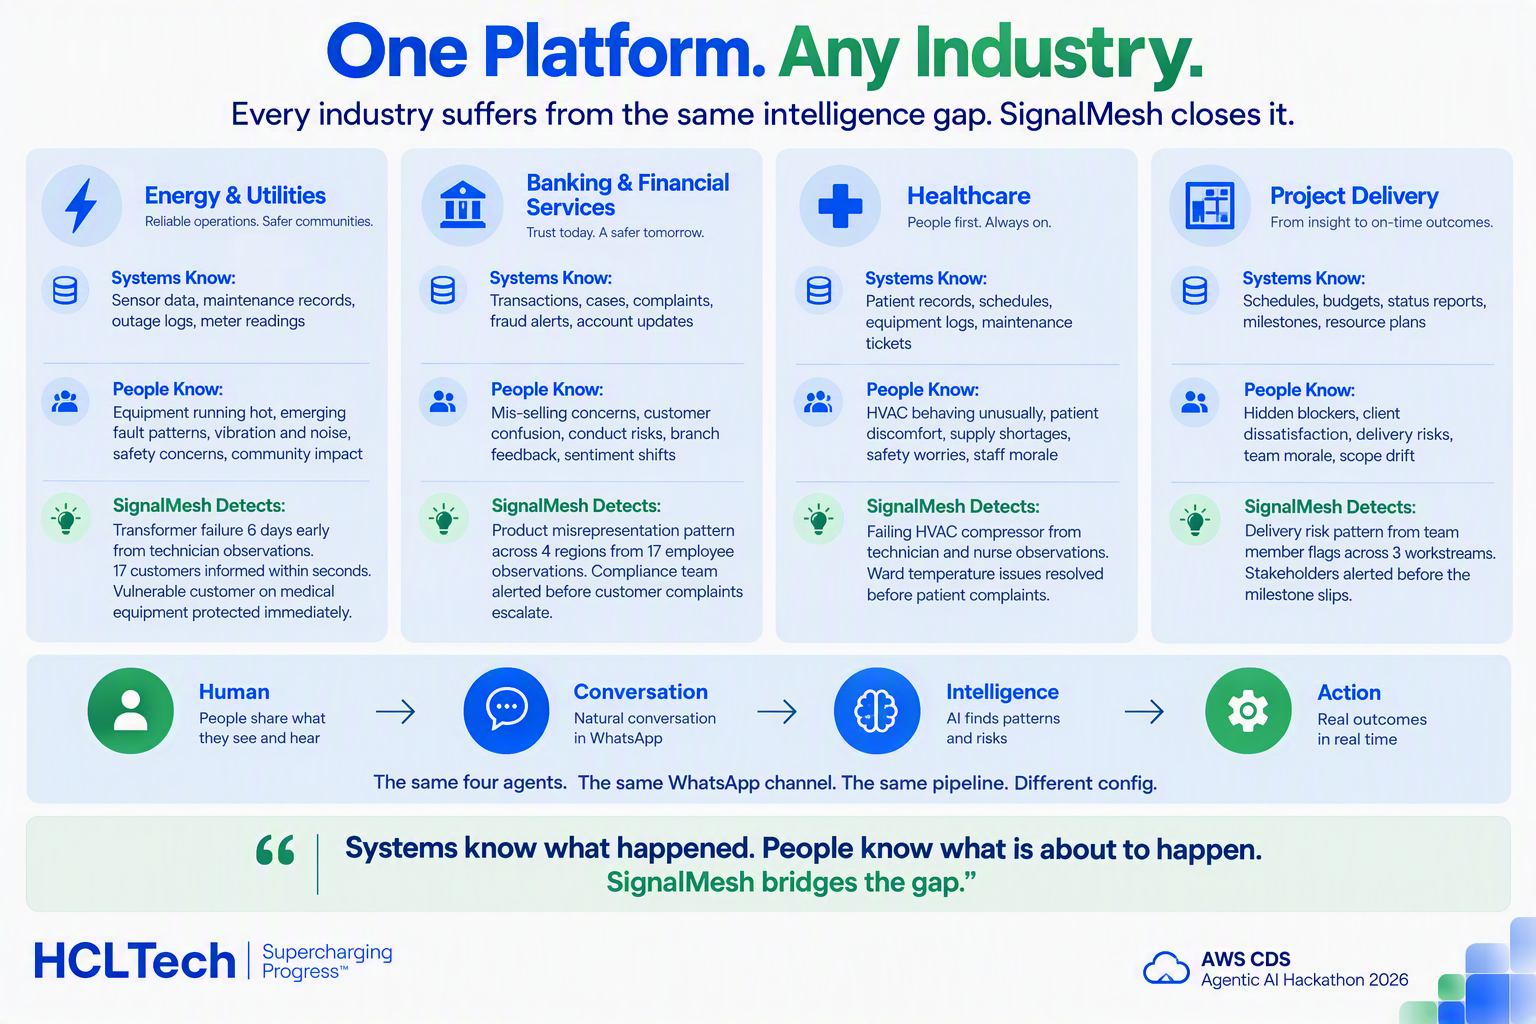
- This pattern is not specific to utilities. We built the demo on a power grid because the signal-to-incident pattern is vivid, but the architecture — signals, clusters, correlation, approval, communication — applies to banking (branch staff + customer complaints), healthcare (technician reports + patient complaints), retail (warehouse observations + customer returns), and project delivery (team flags + stakeholder escalations). SignalMesh is a platform, not a vertical app.
What's next
- Deploy to additional verticals with HCLTech clients — the configuration-driven design (symptom taxonomies, scoring weights, message templates, approval workflows in
config/) means onboarding a new industry is a configuration change, not a rewrite. - Expand the Knowledge Base with cross-client anonymised patterns (with consent), so the platform learns not just from one organisation's history but from the collective intelligence of similar operations.
- Add photo and media analysis to the ingestion agent — employees already send photos of equipment; extracting signal from images would catch visual anomalies that text reports miss.
Built With
- amazon-bedrock-agentcore
- amazon-cloudwatch
- amazon-dynamodb
- amazon-end-user-messaging-social
- amazon-lambda
- amazon-location-services
- amazon-ses
- bedrock-knowledge-bases
- cloudfront
- eventbridge
- iam
- kms
- s3
- secrets-manager
- sns
- sqs

Log in or sign up for Devpost to join the conversation.