-
-
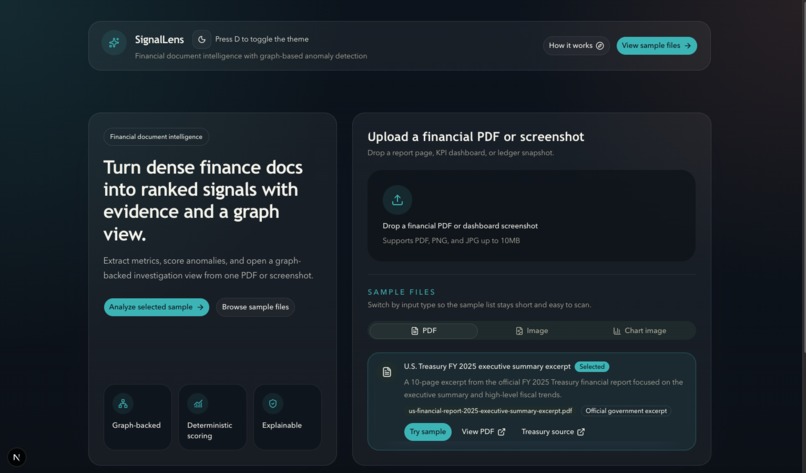
Home page
-

Workflow
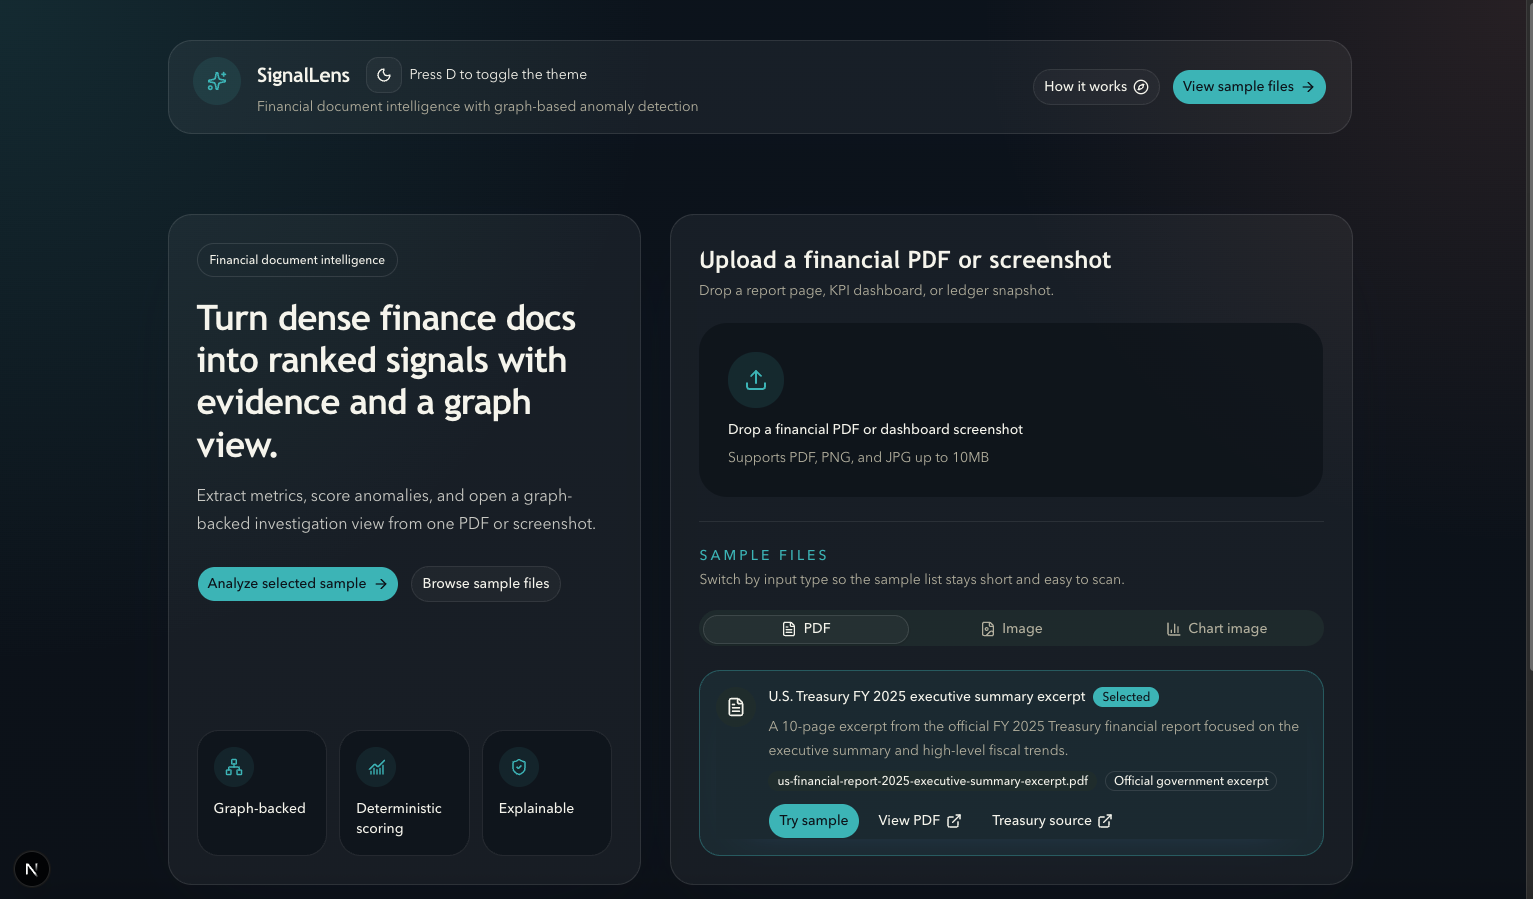

Inspiration
Financial risk review is fragmented. Analysts spend hours hunting for signals buried across tables, commentary, and appendices. and even when they find something, they struggle to explain why it matters or where it came from
What it does
SignalLens uploads a financial PDF or screenshot, extracts metrics and tables, scores anomalies with a visible formula, and surfaces the top findings with evidence, provenance, period-over-period comparison, and official-data verification.
How we built it
Next.js + Tailwind + shadcn/ui frontend, FastAPI Python backend, PyMuPDF + pdfplumber for extraction, OpenAI for grounded explanations, Postgres/Neon for persistence, and Neo4j for relationship graphs, and interactive.
Challenges we ran into
Keeping extraction deterministic and explainable without hallucination, rendering provenance thumbnails with accurate source highlighting, and gracefully degrading when optional services (OCR, database, graph) are unavailable.
Accomplishments that we're proud of
A fully working end-to-end demo and new features added, from upload to ranked findings to analyst brief export, with compare mode, official-data verification, and an interactive graph investigation panel
What we learned
Analysts don't just need alerts. They need grounded, traceable answers. Deterministic scoring plus citation-first explanations is more trustworthy than pure LLM summarization
What's next for SignalLens 2
- Monitoring mode
- Benchmark mode
- Observability
- Cross-document consistency validator
Built With
- fastapi
- neo4j
- nextjs
- postgresql
- pymupdf
- python
- typescript
- vercel


Log in or sign up for Devpost to join the conversation.