-
-

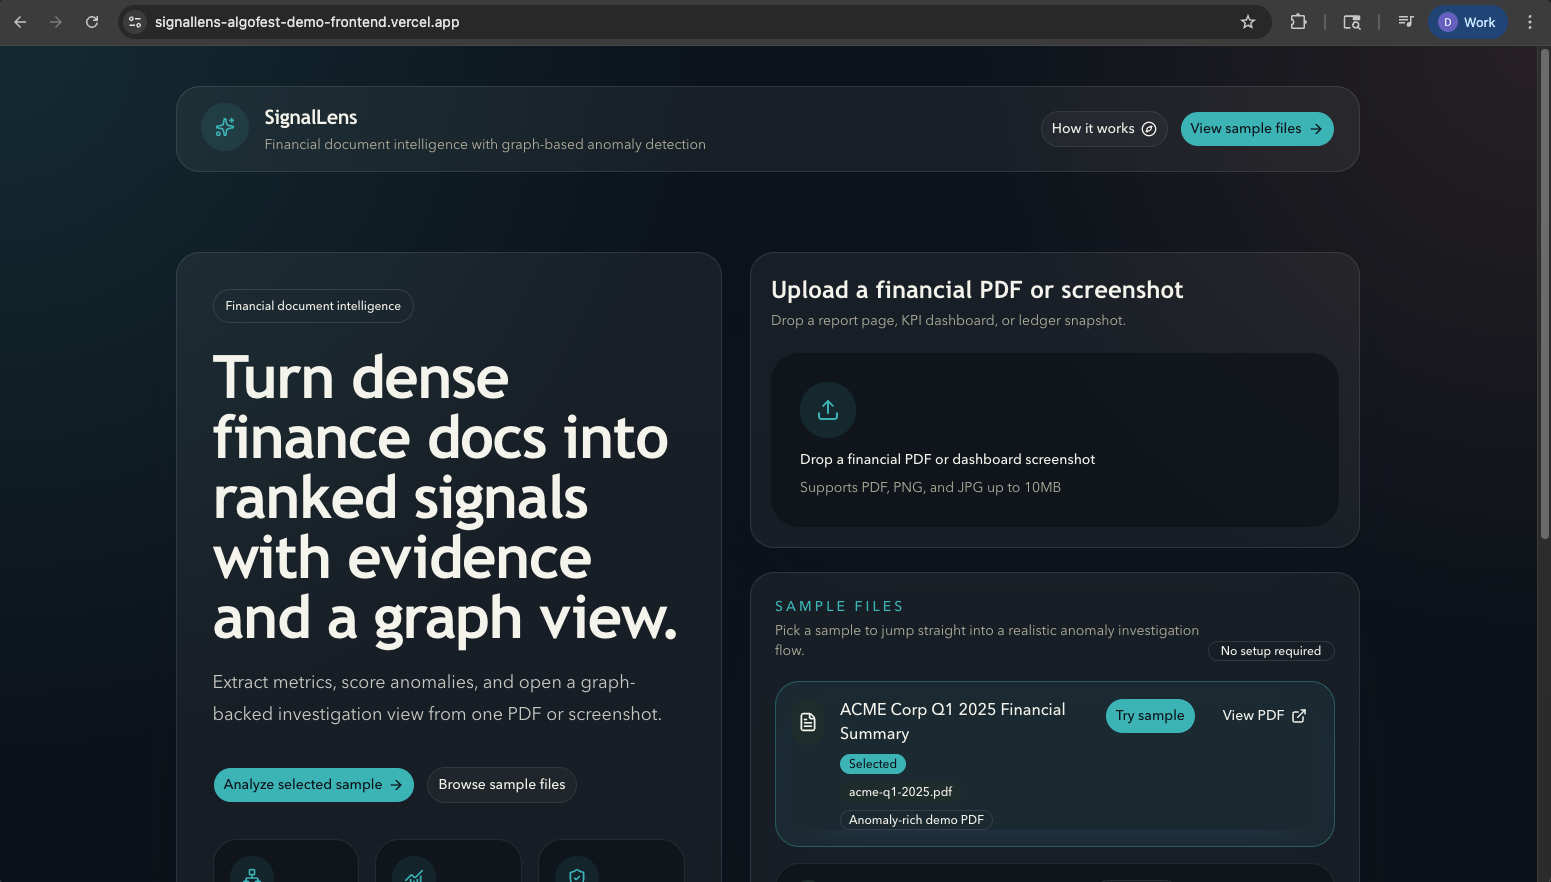
Main Page
-
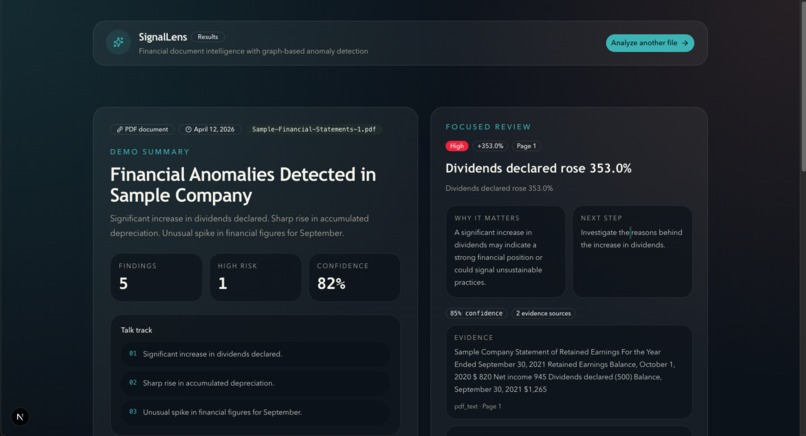
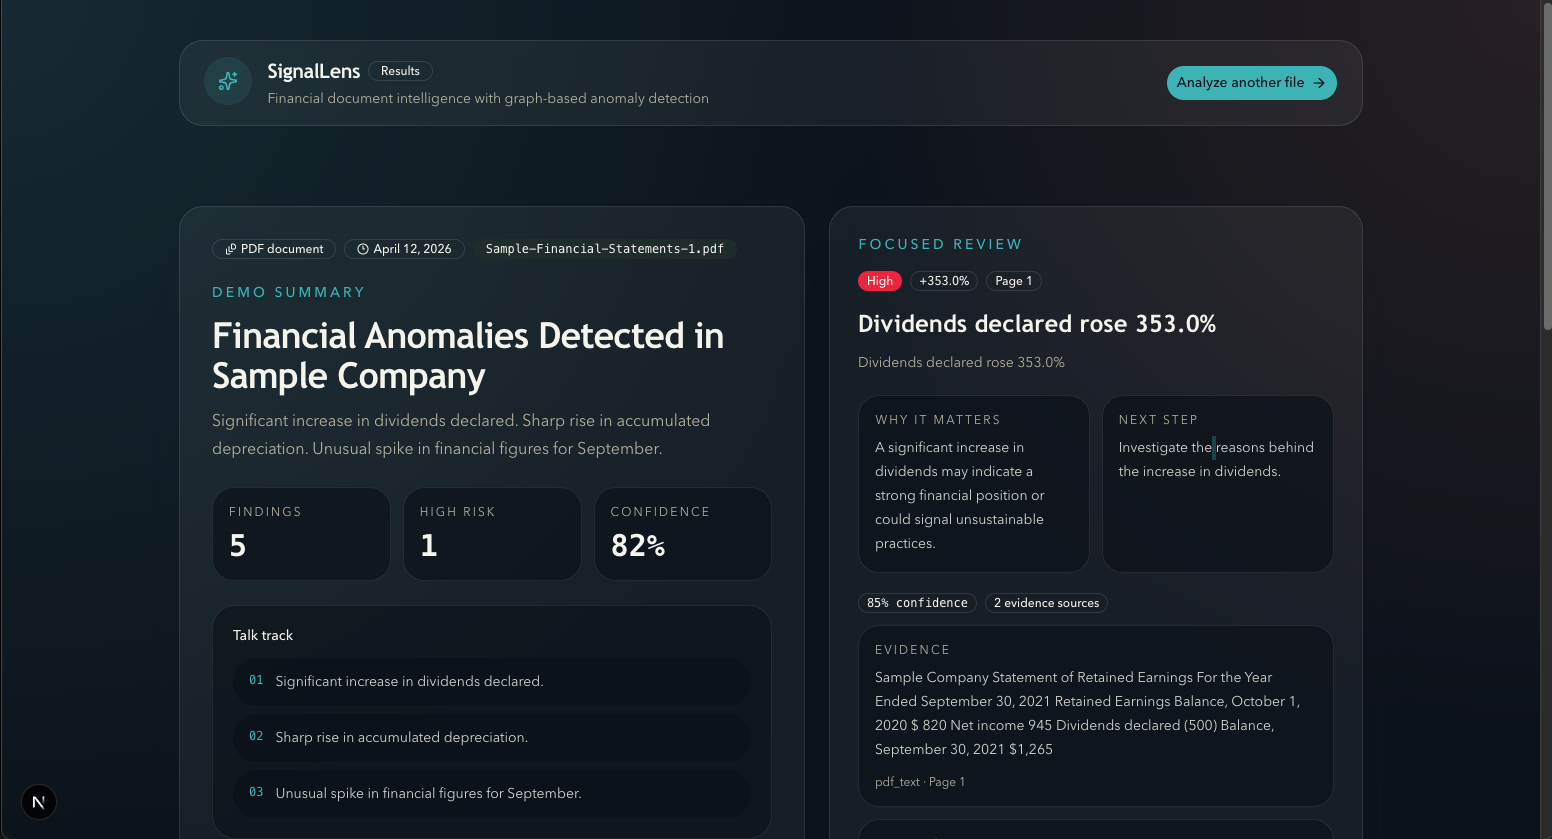
Result Page
Inspiration
Financial reviews still depend on someone scrolling through 40+ pages of PDFs and spreadsheets, hunting for the same handful of KPIs and red flags. It is slow, brittle under time pressure, and hard to explain live. SignalLens came from asking: “What if one upload gave you the three most important issues, with evidence and relationships, ready to show in a 2–5 minute demo?”
What it does
SignalLens turns a single financial PDF or screenshot into a short investigation flow. You upload one document, it extracts metrics and entities, scores anomalies with a transparent formula, and returns the top findings with severity, confidence, and a human‑readable explanation. Each finding is linked to concrete evidence snippets and visualized in a small relationship graph so you can see which vendors, periods, and metrics are involved.
How we built it
We built a demo‑first UI with Next.js and a minimal design system focused on a simple landing page and a focused results workspace. The backend uses FastAPI with modular routes for upload, extraction, analysis, explanation, and graph generation. We started from an API‑first contract, wired the frontend against mock data, then implemented services for deterministic scoring and graph payloads behind those endpoints.
Challenges we ran into
The hardest part was making the system smart enough to feel valuable while still being fully explainable in a 2–5 minute demo. We had to tune the anomaly scoring so it behaves predictably on sample documents and design a graph view that adds clarity instead of noise. Working with messy financial layouts (tables, notes, and mixed text) under hackathon time pressure also forced us to be very selective about what we extract and surface.
Accomplishments that we're proud of
We’re proud that SignalLens delivers a complete narrative from one upload: ranked findings, clear explanations, concrete evidence, and a relationship graph all tied together. The UI stays intentionally tight—only a few top findings, one selected at a time—so it is easy to present live. Getting this end‑to‑end flow working reliably with realistic sample data in a short window is a big win.
What we learned
We learned that explainability is a product feature, not just a model checkbox. A simple scoring formula, plus good UI around severity, confidence, and evidence, creates more trust than opaque “AI magic.” We also saw the value of designing contracts and mock data early, which let the frontend and backend move in parallel instead of blocking each other.
What's next for SignalLens
Next, we want to support more financial document layouts and richer entity linking, especially around counterparties and recurring vendors. We plan to add persistence so teams can compare findings across periods and documents, and to grow the graph from a focused preview into a deeper investigation surface. Longer‑term, SignalLens could plug into real workflows as a review assistant that flags issues before they reach analysts or judges.
Built With
- auradb
- docker
- fastapi
- langchain
- neo4j
- neon
- nextjs
- openai
- postgresql
- python
- railway
- typescript
- vercel


Log in or sign up for Devpost to join the conversation.