SignalGraph — Making Revenue-Signal Failures Visible
Inspiration
I spend a large part of my work trying to answer a deceptively simple question:
Which marketing interactions actually turned into real business outcomes?
In practice, that question becomes surprisingly difficult.
I work across marketing, tracking, attribution, websites, CRMs, booking systems, and advertising platforms. A typical journey might begin with a Google Ads click, continue through a website session and form submission, become a qualified lead inside a CRM, turn into a booking or sale days later, and finally need to be sent back to the advertising platform as an offline conversion.
I have already built systems around preserving attribution context such as UTMs, gclid, gbraid, and wbraid, connecting leads to later business outcomes, filtering bad conversion signals, and feeding verified outcomes back into platforms such as Google Ads.
That solved an important problem: closing the attribution loop.
But working on these systems exposed another problem that I found just as interesting.
What happens when the loop silently breaks?
The customer can still book. The CRM can still contain the sale. The warehouse can still have the record. Every individual system can appear healthy.
But the advertising platform may never receive the conversion.
There may be no application error, no broken dashboard, and no obvious failed pipeline. Weeks later, somebody notices that advertising revenue and actual revenue have drifted apart.
At that point, the questions become:
How many conversions were affected?
What business value is involved?
Where in the journey did the signal stop?
Who owns the asset or process that needs to be investigated?
That became the idea behind SignalGraph.
What I built
SignalGraph is a deterministic evidence engine for conversion-delivery and marketing-journey health.
Instead of trying to become another attribution platform, CRM, warehouse, or observability system, SignalGraph focuses on one narrower problem:
Determine whether an expected business signal actually completed its journey, explain where the evidence suggests it failed, quantify the affected outcome, and use DataHub to attach the organizational context needed to act on it.
A simplified conversion journey looks like this:
Ad click
   ↓
Website
   ↓
Lead / booking
   ↓
Qualified business outcome
   ↓
Eligible offline conversion
   ↓
Upload attempt
   ↓
Destination acceptance
SignalGraph evaluates evidence across those stages.
For example:
Eligible conversions:        10
Upload attempts:               9
Destination-normalized:        8
Accepted:                      4
Confirmed successful:          3
From that evidence, SignalGraph can produce a finding such as:
Affected conversions: 7
Affected value: €700
Likely failure location: upload_job
Reason codes:
- missing
- pending
- rejected
- duplicated
The important part is that SignalGraph does not stop with a technical identifier.
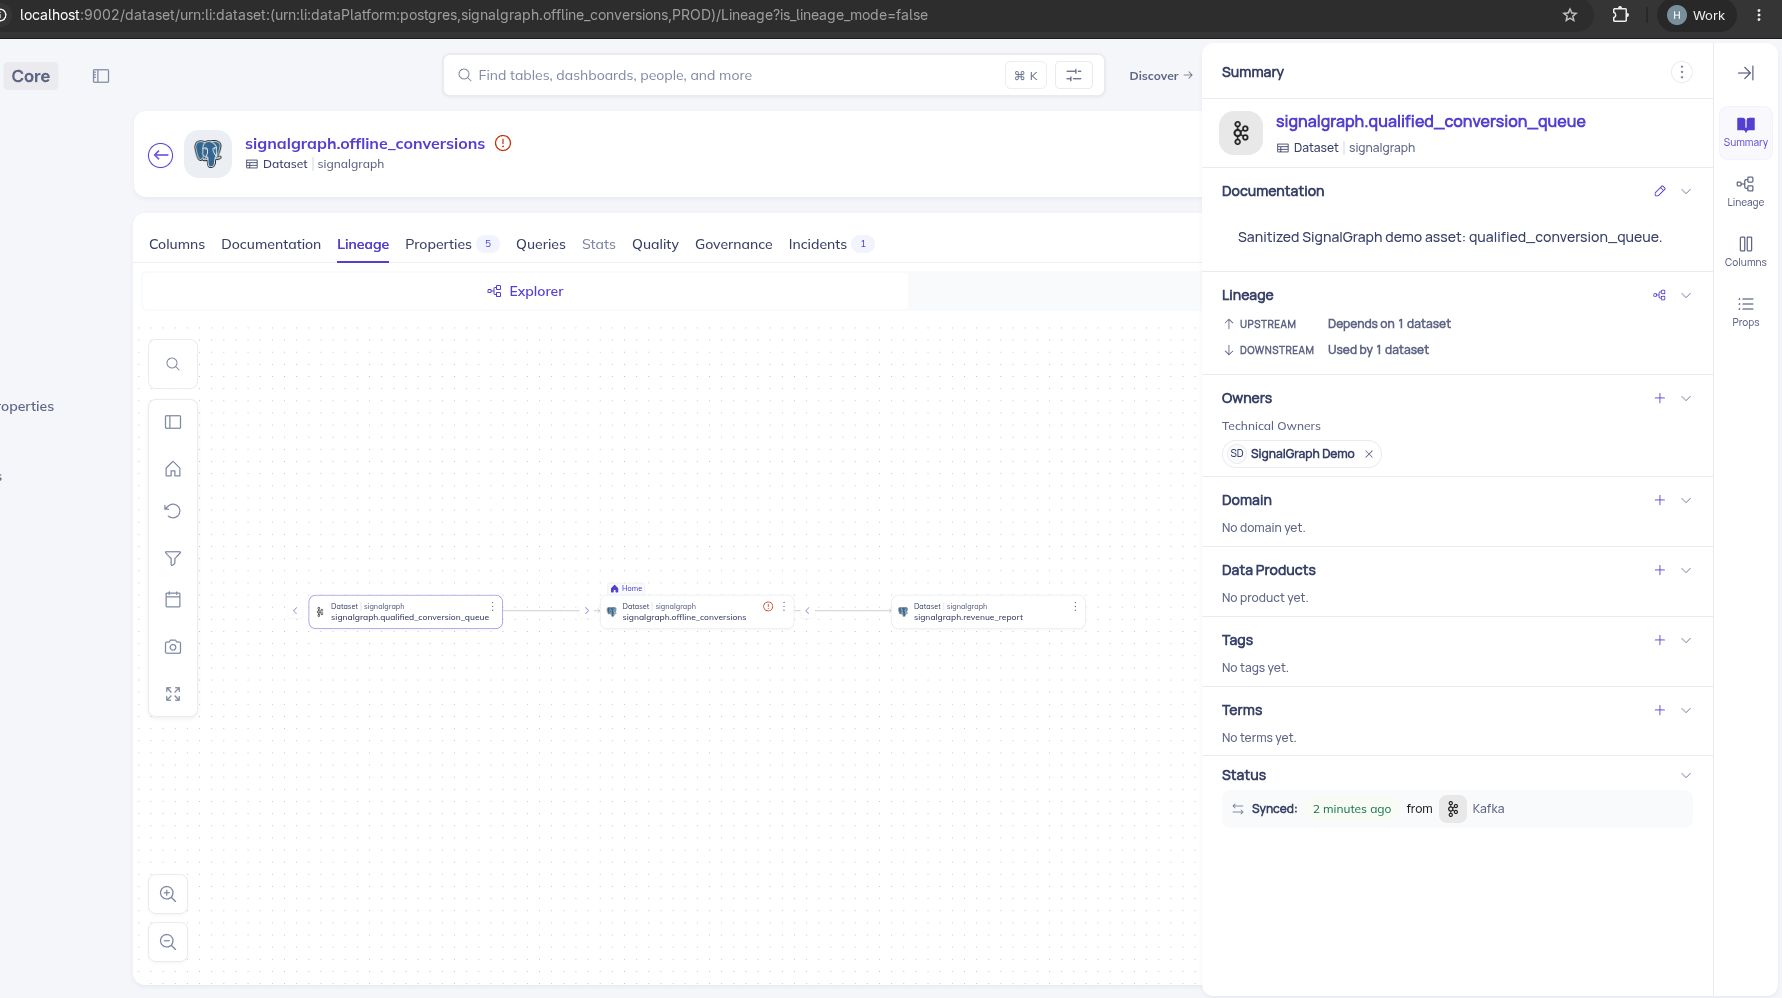
Once a finding has been evaluated, it asks DataHub for the corresponding asset, owner, and lineage context. The current implementation uses DataHub's official MCP interface for search, entity retrieval, and lineage lookup.
So instead of reporting:
urn:li:dataset:(...)
has a delivery mismatch
the useful result becomes closer to:
Conversion delivery failure

7 conversions affected
€700 affected value

Likely failure:
upload_job

Owner:
Growth Operations

Downstream impact:
1 dependent asset
That was the connection that made DataHub especially interesting to me.
Why DataHub
At first I thought about SignalGraph primarily as a monitoring problem.
While learning more about DataHub, I realized the more interesting architecture was different.
DataHub should not be the event-processing engine, and SignalGraph should not become another metadata catalog.
The two systems can specialize.
SignalGraph understands the domain-specific rule:
eligible
→ attempted
→ received
→ accepted
→ successful
DataHub understands:
What asset is this?
Who owns it?
What depends on it?
What is upstream?
What business context surrounds it?
SignalGraph therefore treats DataHub as context, not as the source of truth for the conversion events themselves.
That separation ended up being one of the most valuable architectural lessons from the project.
It also changed how I thought about data observability.
A dataset can be fresh.
Its schema can be valid.
Its row count can look normal.
Its pipeline can technically be running.
And yet a business process represented by those datasets can still be broken.
For example:
qualified_conversions       ✓ healthy
offline_conversion_queue    ✓ healthy
ads_upload_results          ✓ healthy

BUT

31% of eligible conversions
never reached the destination.
SignalGraph is trying to operate at that layer: business-process integrity on top of technically healthy data.
How I built it
I deliberately kept the first version small and deterministic.
An upstream producer supplies sanitized aggregate evidence. SignalGraph does not currently pull raw customer rows directly from Google Ads, Meta, a CRM, or a warehouse. The project explicitly separates that future integration work from the evidence engine itself.
That allowed me to concentrate on the core contract:
sanitized evidence
      ↓
deterministic evaluation
      ↓
failure classification
      ↓
business exposure
      ↓
DataHub context
      ↓
structured evidence
      ↓
optional explicit action
I built several related evaluators around that approach.
One checks whether eligible conversions reached their destination. Another evaluates an entire conversion-delivery window and distinguishes between missing, rejected, duplicated, and pending outcomes. A marketing-health evaluator looks further upstream at things such as click-context capture, consent enforcement, attribution-context propagation, and destination delivery.
I also made an intentional privacy decision: the marketing-health path accepts aggregate evidence rather than raw advertising identifiers, cookies, or customer identifiers.
The system is fail-closed.
If DataHub returns ambiguous ownership, malformed metadata, or missing required lineage evidence, SignalGraph refuses to manufacture a confident answer.
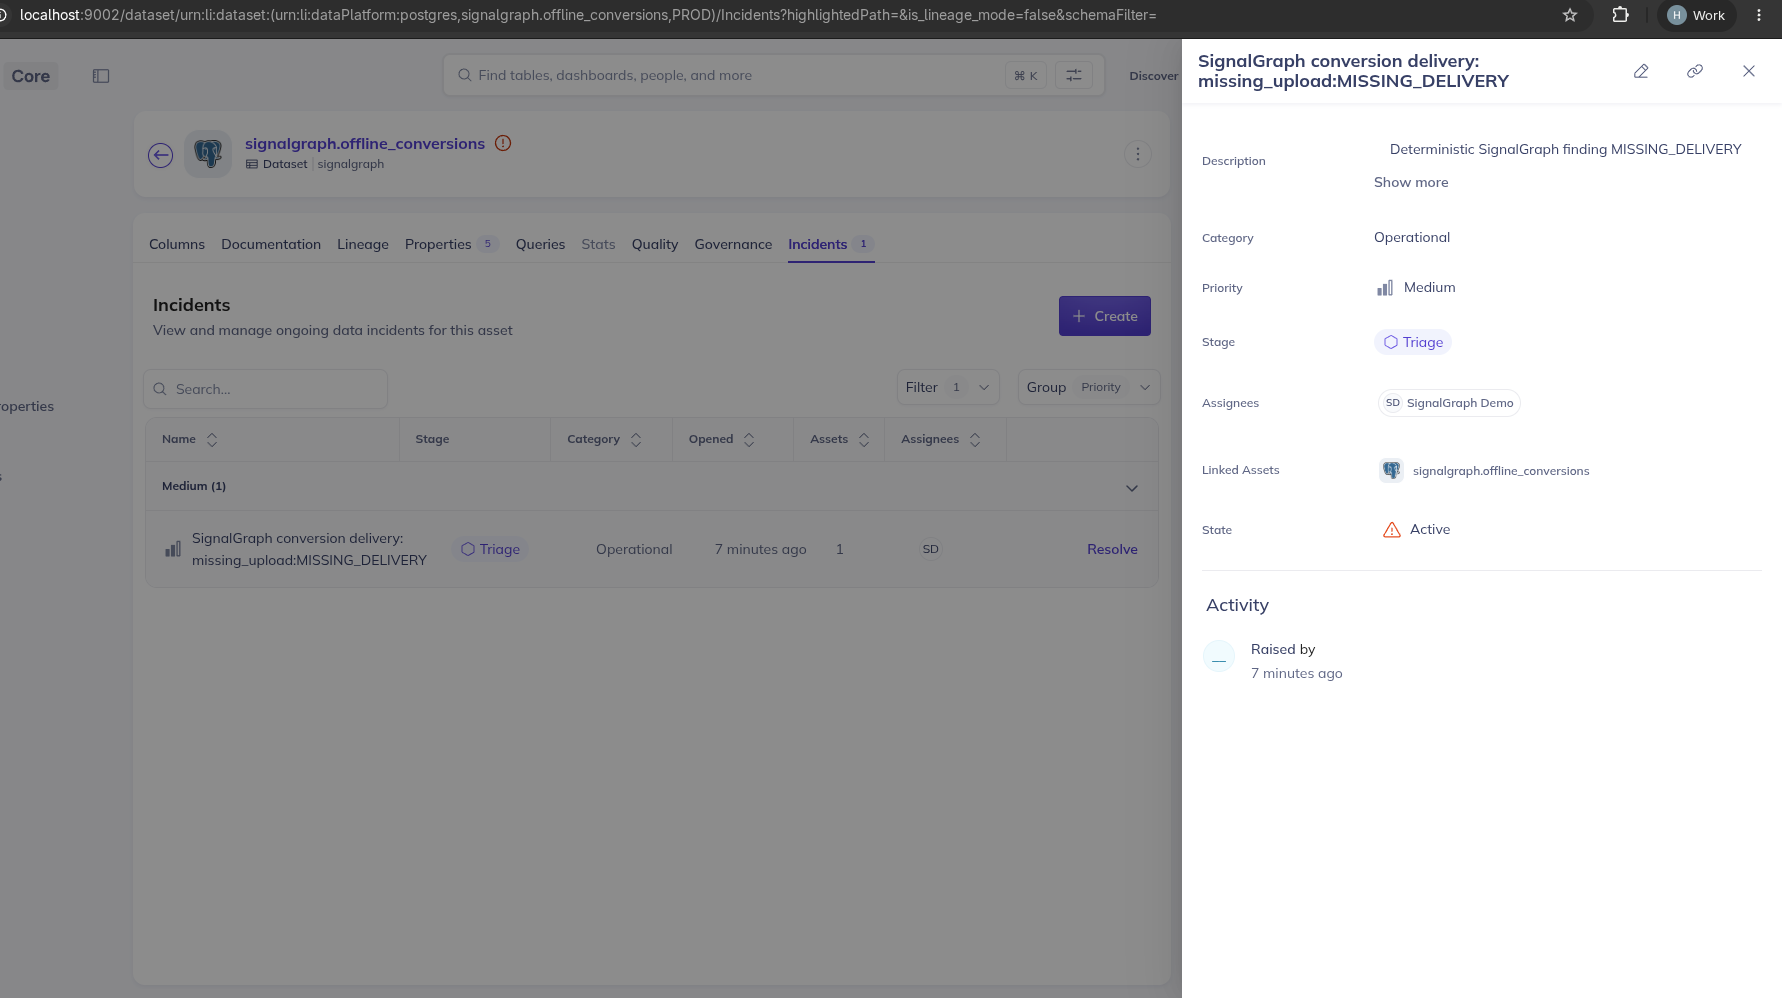
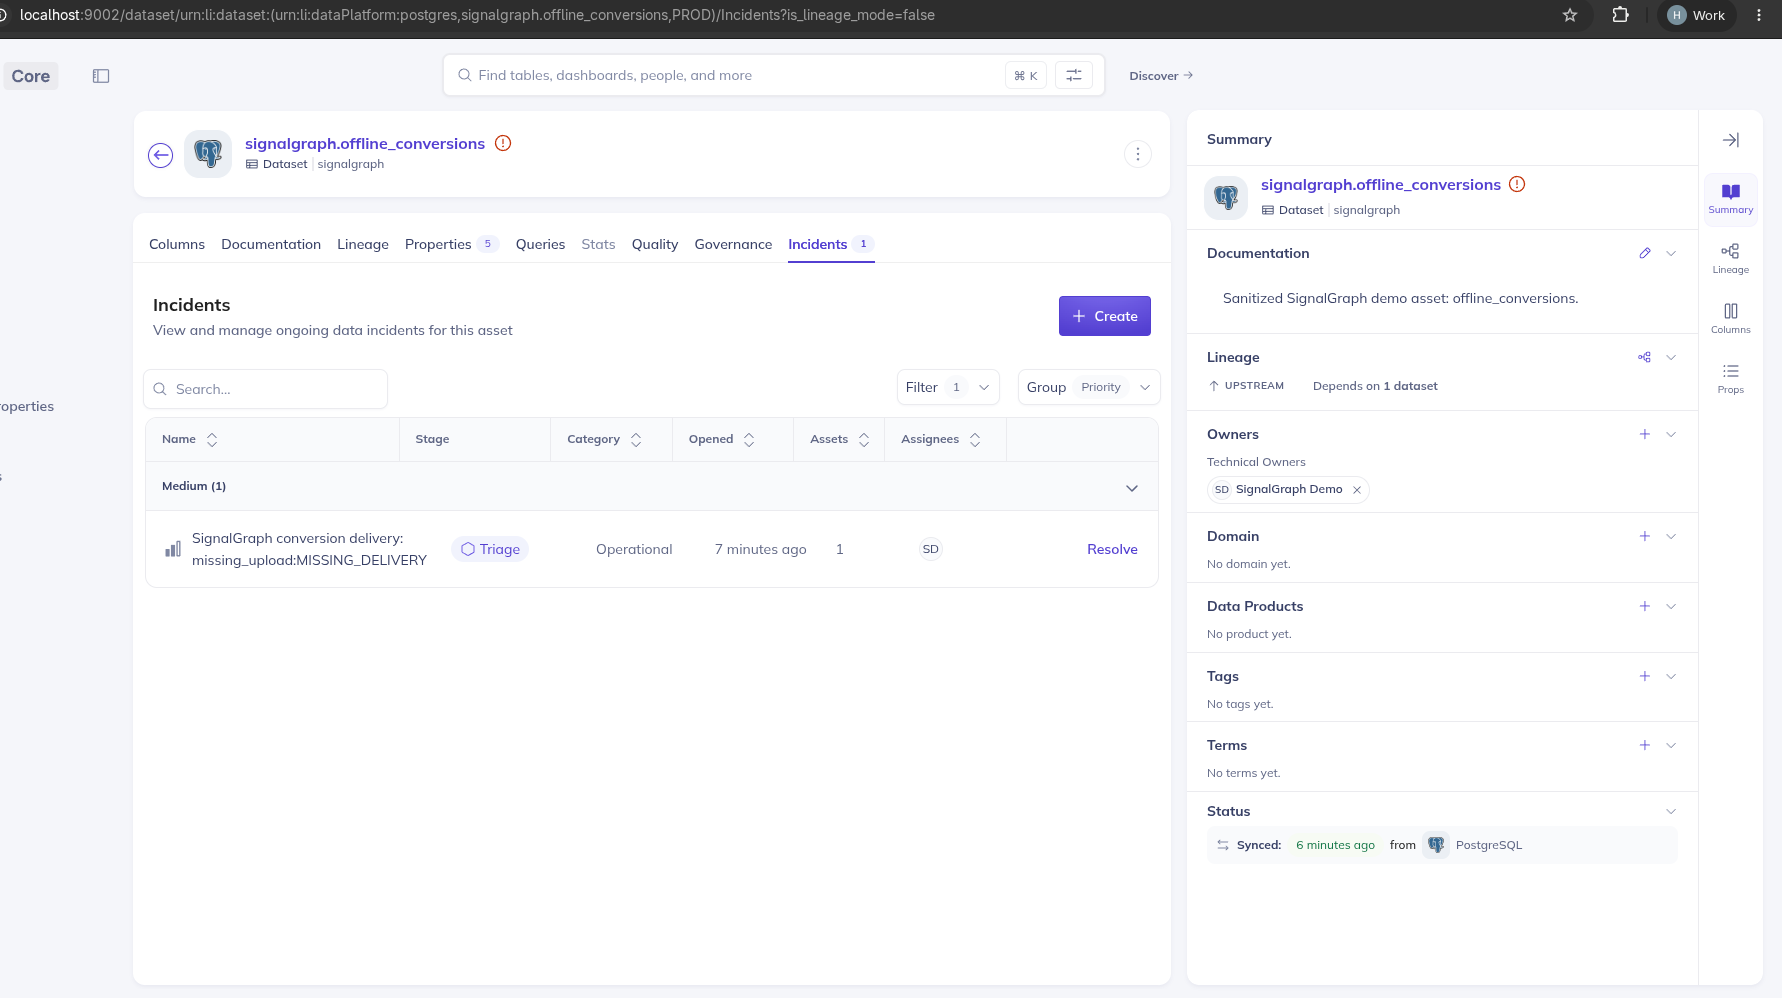
It is also read-only by default. An incident can only be created through an explicit action rather than silently mutating DataHub during an evaluation.
That was important because I wanted the evidence to be boring in the best possible way:
same evidence in → same result out.
Challenges
The hardest part was not calculating something like:
[
\text{affected conversions}
\text{eligible conversions}
\text{successful conversions} ]
That arithmetic is trivial.
The difficult part was deciding what the numbers are actually allowed to mean.
If I multiply seven missing conversions by €100, I can calculate:
[ 7 \times €100 = €700 ]
But that does not automatically mean that €700 of revenue was actually lost.
Maybe the conversion arrives later. Maybe it was duplicated. Maybe it was rejected and subsequently retried. Maybe €100 was only an assumed conversion value.
That forced me to become much more precise with terminology and evidence provenance.
SignalGraph distinguishes an affected-value estimate from independently verified financial loss. The repository explicitly records when counts or values were supplied rather than independently observed.
That might sound like a small naming detail, but it became central to the project.
Another challenge was scope.
It would have been easy to keep adding:
Google Ads APIs. Meta CAPI. HubSpot. Salesforce. BigQuery. ClickHouse. Automatic retries. LLM reasoning. Scheduling.
Instead, I tried to keep asking:
What is actually required to prove the core idea?
The result is intentionally still a prototype. The broader source integrations are roadmap work rather than something I claim already exists.
That constraint made the project better.
What I learned
The biggest thing I learned is that data quality and business-signal quality are not exactly the same problem.
Before building SignalGraph, I tended to think about this problem mainly from the marketing side:
Did Google Ads receive the conversion?
DataHub pushed me toward a broader question:
What business signal was expected to travel through this data graph, what evidence tells us that journey was completed, and what organizational context do we need when it wasn't?
That opens a much more general model.
The same pattern could eventually apply to:
lead → qualified lead

trial → paid customer

booking → completed appointment

order → fulfilled order

invoice → payment

conversion → advertising feedback
The individual domain rules differ, but the underlying concept is similar:
[ \text{Expected state transition} \neq \text{Observed state transition} ]
The second lesson was about the role of metadata.
Before this project, it was easy for me to think of lineage and ownership as information somebody searches for after something breaks.
DataHub showed me another possibility.
Metadata can participate directly in the operational workflow.
A detector can discover a problem and immediately ask:
Which asset?
Which owner?
What is downstream?
What context already exists?
DataHub's current agent architecture explicitly treats technical metadata, business context, lineage, quality signals, and shared context as inputs that external agents can reason with.
That made SignalGraph much more interesting to me than building another isolated marketing monitor.
What surprised me
The project started with a fairly niche problem: broken offline conversions.
What surprised me was that the interesting part was not really Google Ads.
It was the gap between technical system health and business-process health.
A company's data infrastructure can be green while something financially important is silently failing between systems.
That is where I now think SignalGraph fits best.
Not as a replacement for DataHub.
Not as another generic observability platform.
But as a specialized layer that can teach DataHub something about the meaning of a particular business process, while relying on DataHub for the context required to make the finding actionable.
DataHub provides the graph.
SignalGraph evaluates whether an important signal successfully made its way through that graph.
What's next
The current project proves the deterministic evaluation and DataHub-context path.
The next meaningful step is making the evidence production itself easier.
Instead of requiring teams to prepare aggregate input manually, I want SignalGraph to eventually be able to derive the same privacy-preserving contracts from systems where DataHub customers already keep their data:
BigQuery
Snowflake
Databricks
ClickHouse
CRM systems
marketing destinations
From there, SignalGraph findings could become native operational signals inside DataHub: assertions when a business invariant is evaluated, incidents when it fails, and potentially approved remediation actions when a failure is understood well enough to repair safely.
The long-term idea is simple:
Make failures in important business-signal journeys as observable and actionable as failures in the datasets that carry them.
That is what made this project personally interesting to build, and it is the biggest idea I am taking away from the hackathon.
Built With
- agent
- ai-agent
- cli
- conversion-tracking
- data-catalog
- data-governance
- data-lineage
- data-observability
- data-quality
- datahub
- deterministic-rules
- gclid
- google-ads
- hackathon
- incident-detection
- marketing-attribution
- metadata
- offline-conversions
- python

Log in or sign up for Devpost to join the conversation.