-
-
-
-
-
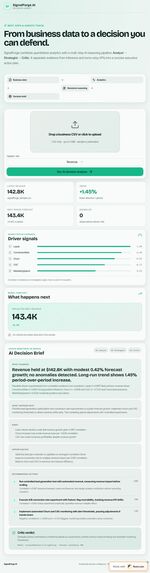
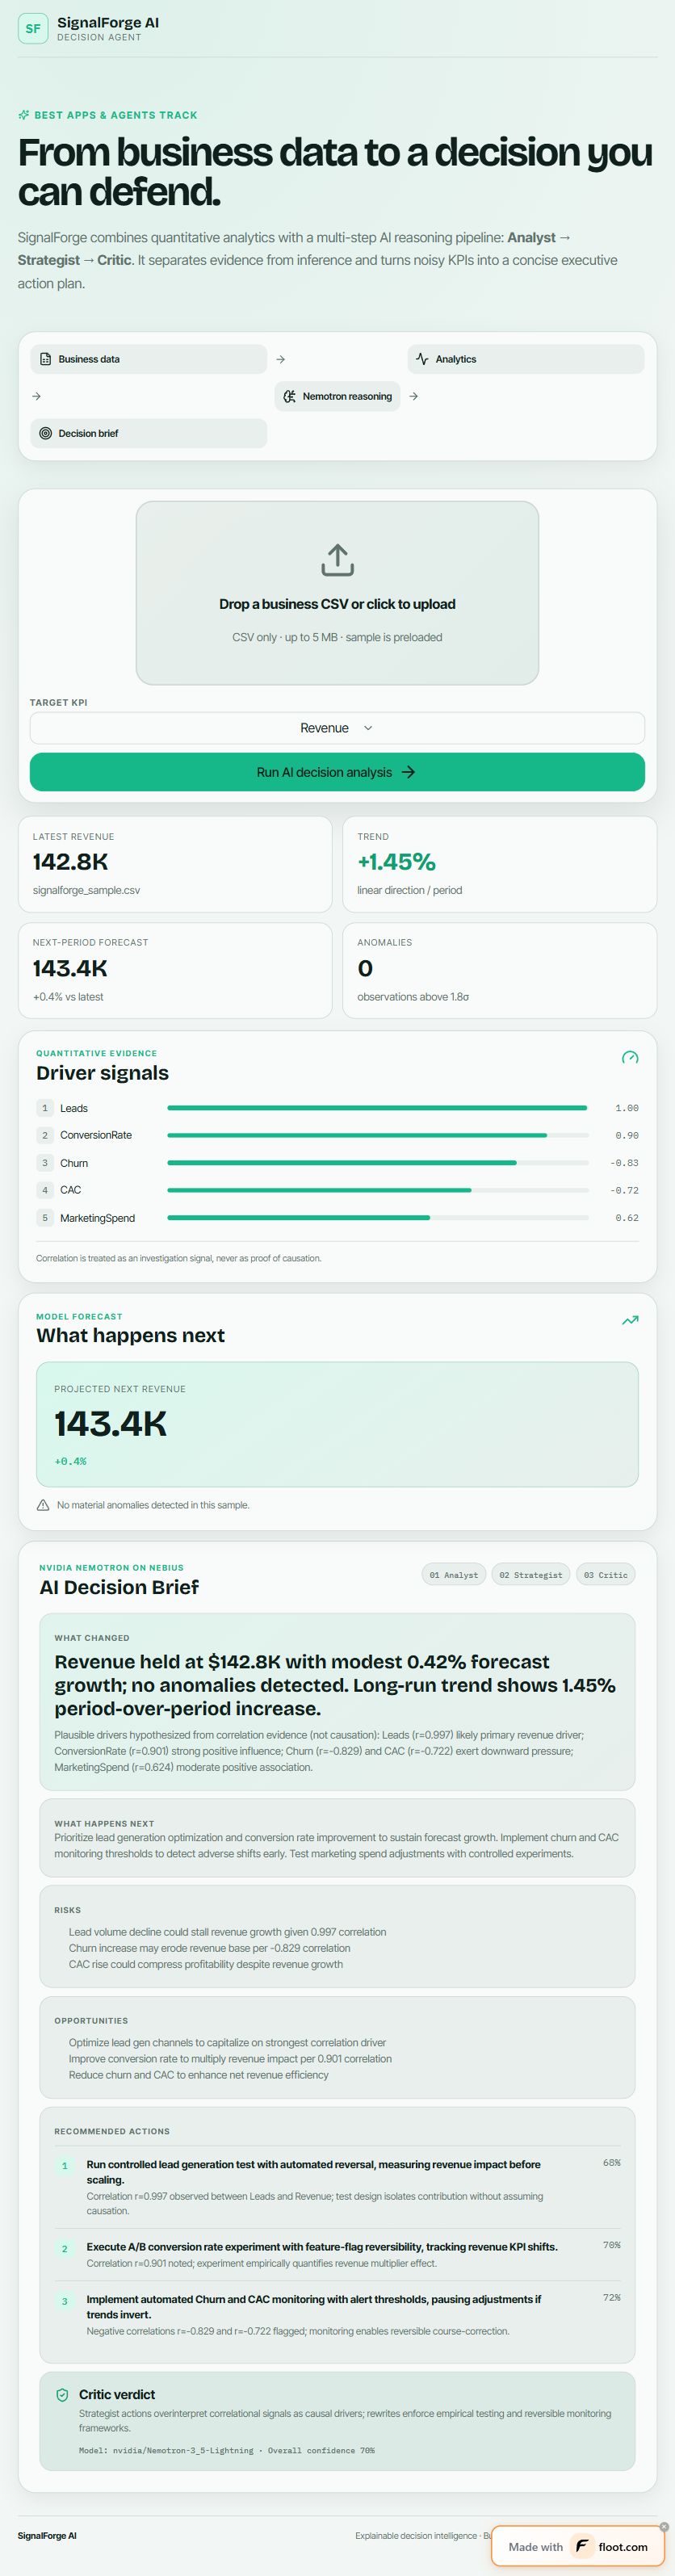
Real deployed Nemotron response: the Critic revises correlation-based claims into reversible experiments.
Inspiration
Small teams already have business numbers in spreadsheets, but turning those numbers into a decision still takes time. A chart can show that revenue changed without explaining which questions to investigate or what to try next.
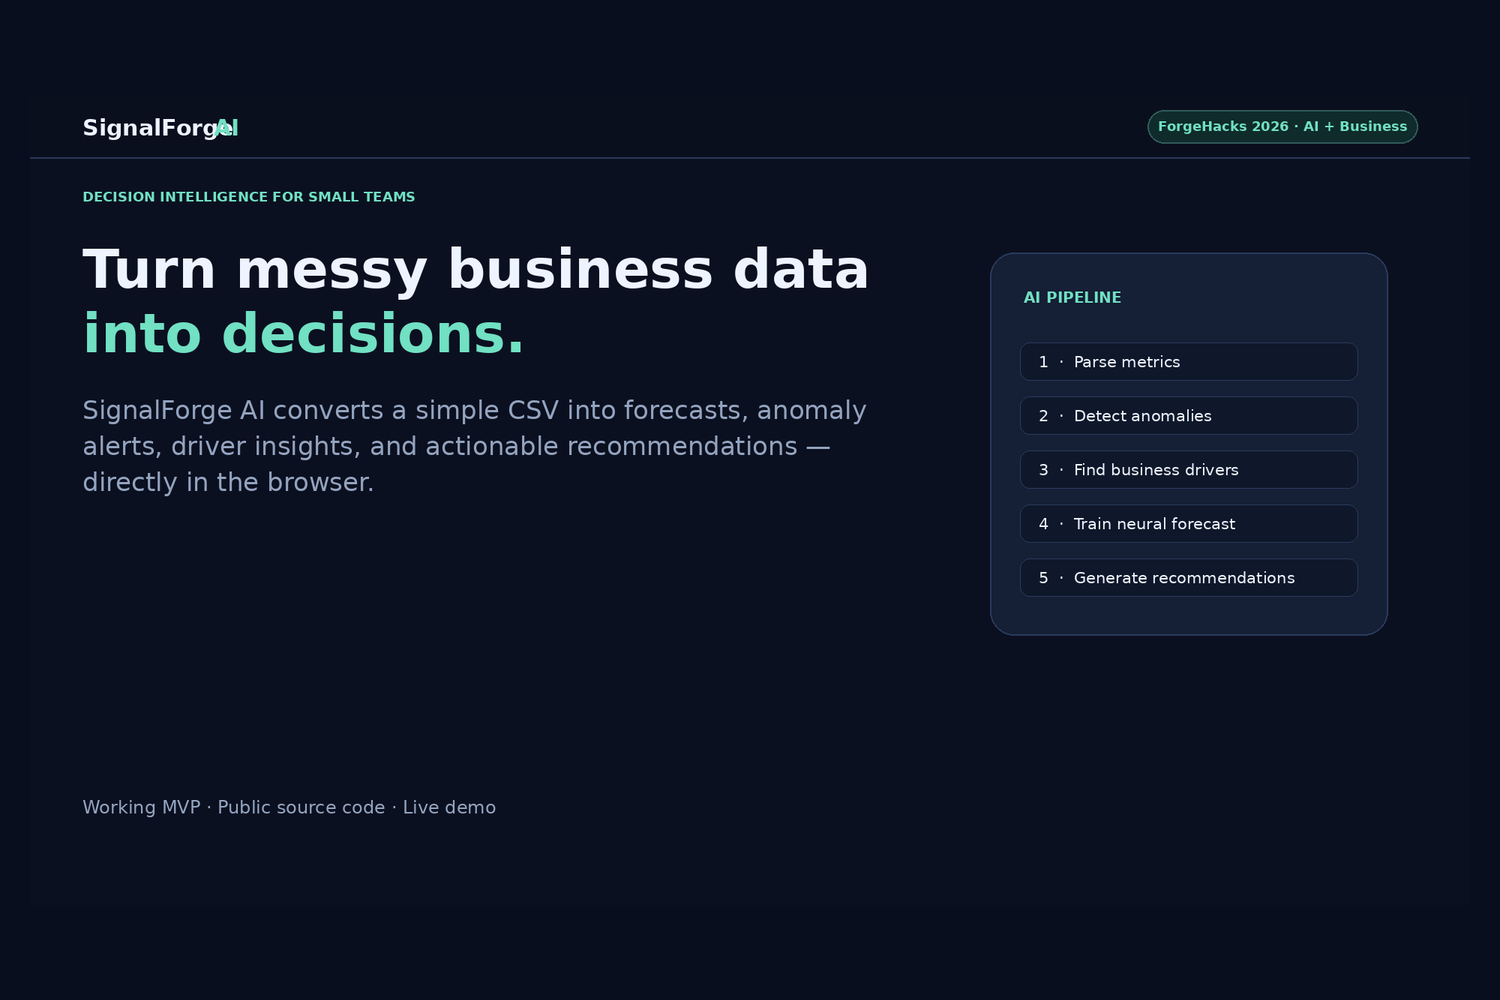
SignalForge AI brings the evidence and the proposed action into one workflow. It is designed for founders and business operators who need an understandable first analysis before committing resources.
What it does
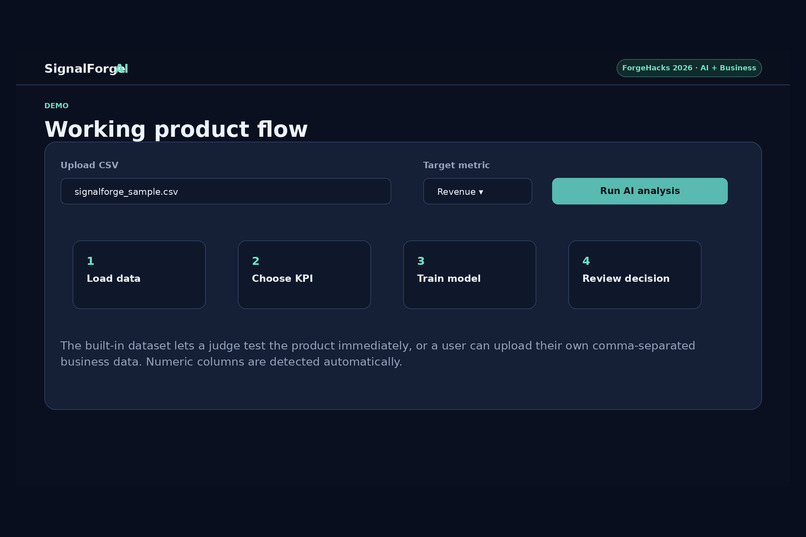
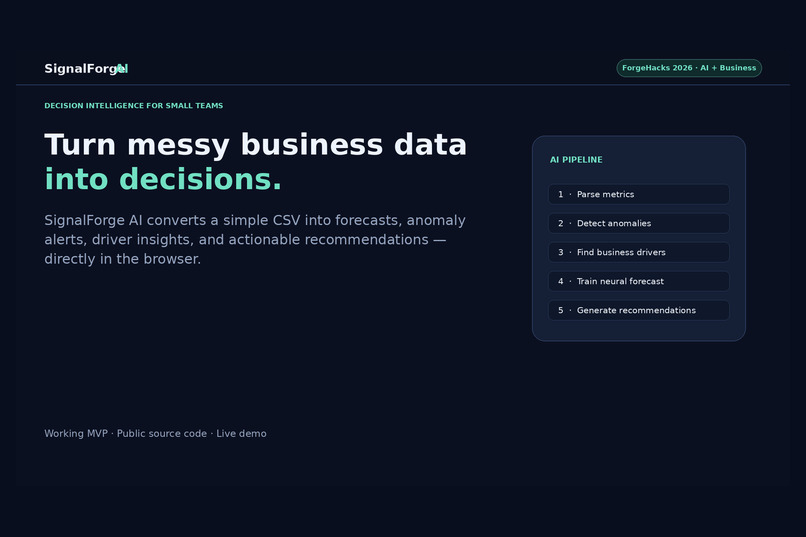
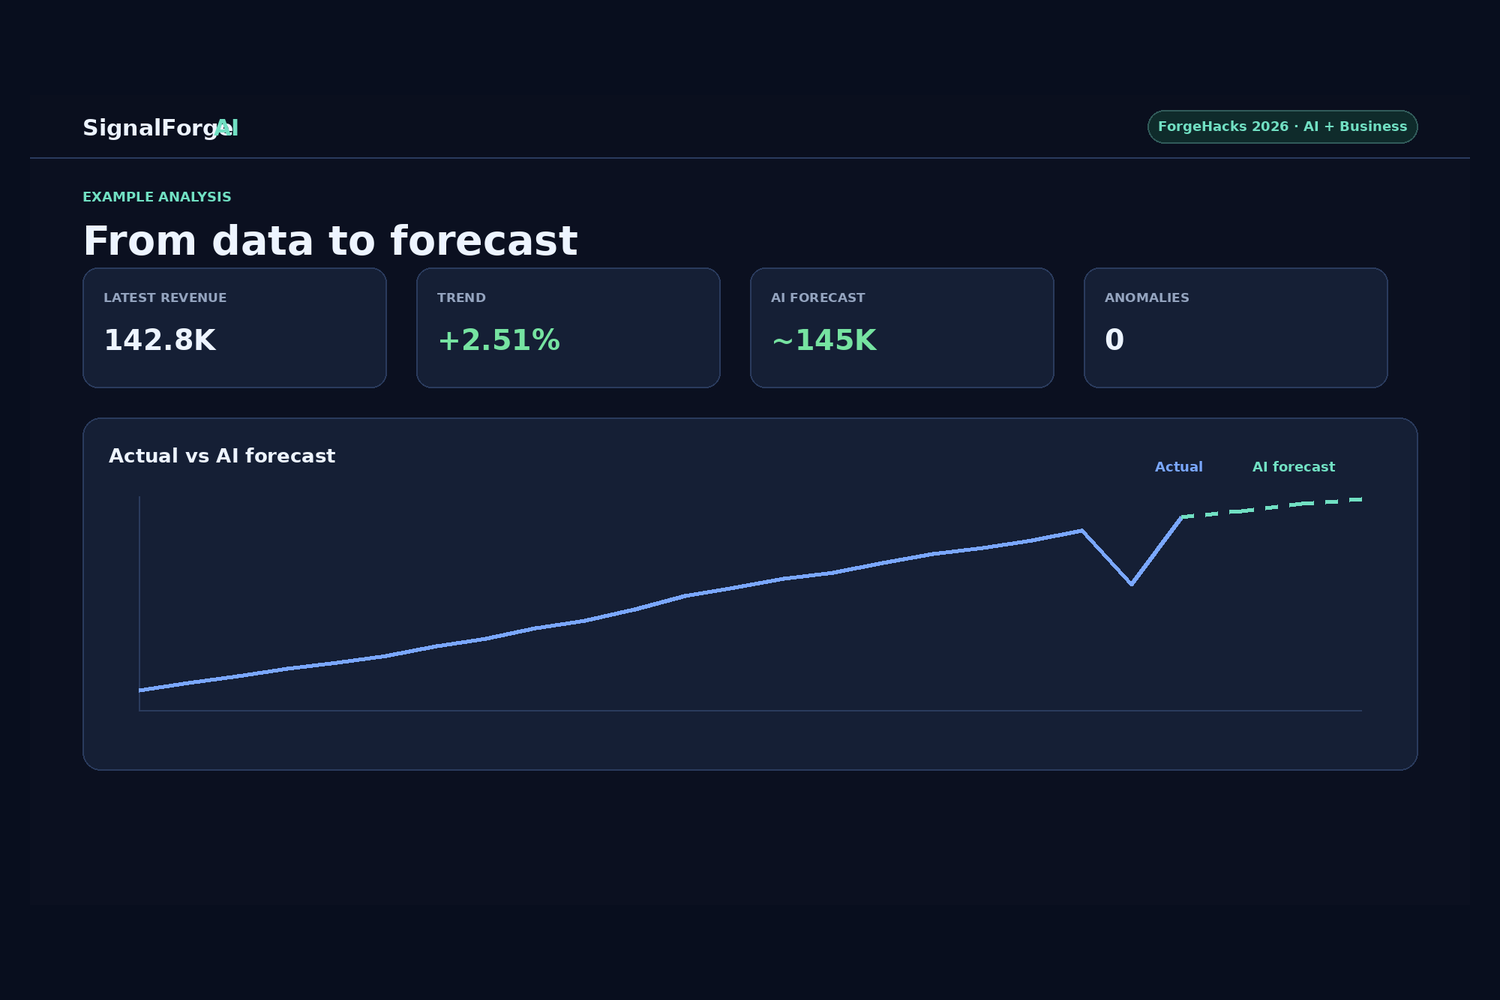
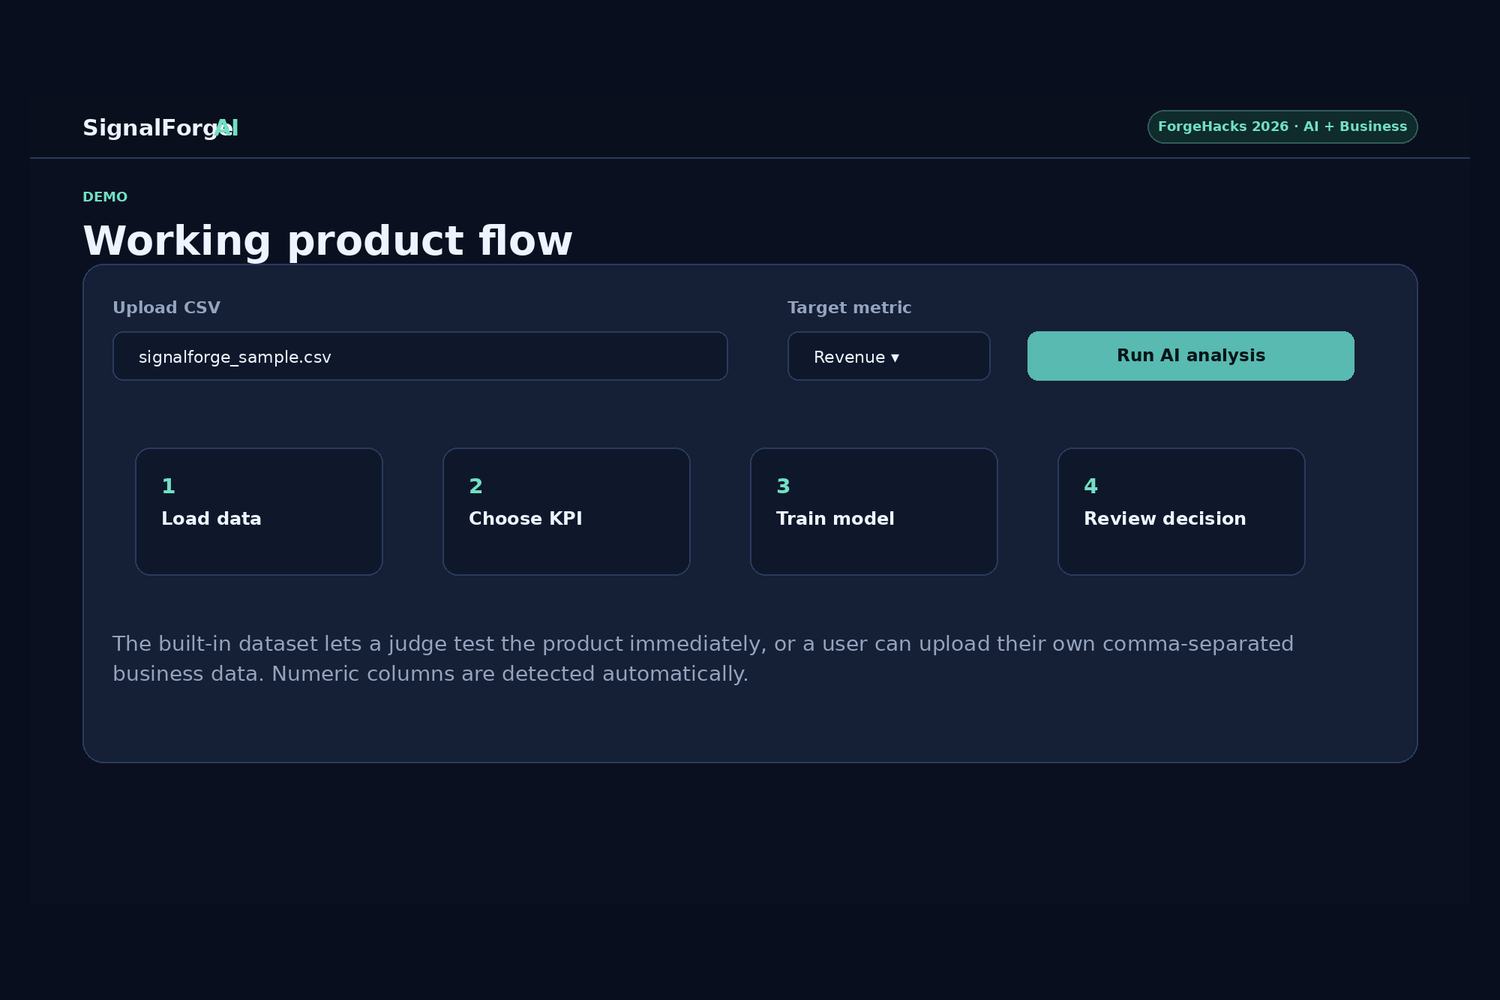
Upload a business CSV or explore the built-in synthetic dataset, then choose a target KPI. SignalForge calculates a linear trend, z-score anomaly signals, Pearson correlations and a simple next-period forecast.
Click Run AI decision analysis to turn those quantitative signals into a brief with three sequential NVIDIA Nemotron stages:
- Analyst describes what changed and separates observations from possible explanations.
- Strategist proposes three actions, favoring reversible experiments.
- Critic reviews unsupported causal claims, contradictions and overconfidence, and can rewrite the proposed actions.
The dashboard places the resulting risks, opportunities, recommendations and critic verdict beside the numerical evidence. Actions are suggestions for a person to review; the application does not execute business changes.
How we built it
The frontend is a React/TypeScript dashboard hosted on Floot. Browser code handles CSV input, KPI selection and the lightweight statistical calculations. When the user requests a brief, the server sends a structured evidence summary through three chat-completion requests to Nebius Token Factory, using NVIDIA nvidia/Nemotron-3_5-Lightning.
The model is part of the running product. The Analyst's output informs the Strategist; both outputs are reviewed by the Critic. This version uses prompt engineering, without fine-tuning. It does not claim deployment on dedicated Nebius GPU instances or Nebius AI Cloud compute.
The Nebius credential is kept in a server-side environment secret. It is not included in the browser interface or public source. ChatGPT/Codex and Floot assisted with implementation, debugging, documentation and QA.
Challenges we ran into
Model output was not always complete, valid JSON. We added reasoning-block removal, JSON parsing, truncated-response detection and a bounded retry with concise structured-output instructions. The workflow reports failures instead of presenting a failed request as a successful analysis.
A second challenge is that correlations can invite causal overstatement. The Critic provides a deliberate review step, but it is not a guarantee of correctness. Users still need to validate recommendations against business context.
What we verified
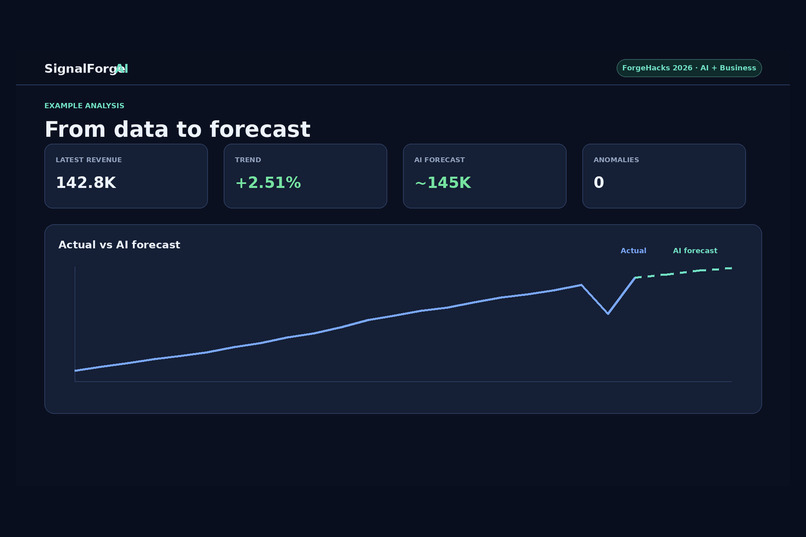
On 27 October 2026, a live run of the deployed application returned and displayed a real Analyst → Strategist → Critic brief. For the synthetic sample, the dashboard showed latest revenue of 142.8K, a next-period forecast of 143.4K, and zero observations above the configured 1.8σ anomaly threshold.
The returned Critic explicitly challenged causal interpretations of correlated metrics and rewrote actions toward controlled tests and reversible monitoring. These are observed demo outputs, not evidence of improved revenue or predictive accuracy. Model wording can change between runs.
How to try it
- Open the live application. No sign-in is required.
- Use the preloaded synthetic dataset and leave Revenue selected.
- Review the KPI cards, driver signals and forecast.
- Click Run AI decision analysis and wait for the three-stage result.
- Read the recommendations alongside the Critic verdict. Compare the narrative with the quantitative evidence.
- Optionally upload a small, non-sensitive CSV with a header row and numeric KPI columns, choose a target, and run the workflow again.
The live app uses the deployed server credential; judges do not need to enter an API key.
Known limitations
- The included dataset is synthetic and is used only for demonstration.
- Correlation does not establish causation. The forecast is a simple exploratory extrapolation, not a validated forecasting service.
- Displayed confidence percentages are model-generated assessments, not calibrated probabilities.
- The CSV parser is basic and does not support every quoted-field or formatting edge case.
- The prototype has no authentication or persistent workspaces. Do not upload confidential business information; a structured evidence summary is sent to Nebius when AI analysis is requested.
- Three sequential inference requests add latency and depend on service availability and account quota.
- No controlled comparison with other models or production business-impact study is claimed.
Prior work and what is new
An earlier, separate SignalForge AI prototype was built for ForgeHacks Online 2026 with HTML/JavaScript and TensorFlow.js browser forecasting. Its public repository and Devpost project date to 9 October 2026, after this hackathon's 26 August 2026 start.
The Nebius iteration uses a new React/TypeScript dashboard and a server-side, three-stage Nemotron pipeline on Nebius Token Factory. The earlier TensorFlow.js implementation is disclosed as prior work and is not presented as the current AI architecture.
What's next
Improve CSV validation, evaluate forecast and recommendation quality on held-out datasets, and make uncertainty and evidence traceability easier to inspect. User research and measured evaluations will be needed before treating this prototype as production decision support.
Track: Best Apps and Agents
Live app: https://signalforge-nebius-2026.floot.app
Source repository: https://github.com/daryas2226-rgb/signalforge-nebius-2026
Built With
- floot
- nebius-token-factory
- nvidia-nemotron
- react
- typescript
- zod
