-
-
SingnalDrop
Inspiration
Streaming platforms lose viewers to specific, detectable causes — a bad edit, a subtitle desync, a localized CDN failure at one edge node — but today, someone has to notice a chart looks wrong before anyone investigates. That's slow, and it's human-bottlenecked. I wanted to build something that doesn't just surface a chart, but actually closes the loop: find the anomaly, explain it, and hand it to a human as something actionable, not just visible.
What it does
SignalDrop is a real, three-agent pipeline:
- Analyst Agent — runs a genuine statistical query against real streaming engagement telemetry in ClickHouse Cloud (via the official
mcp-clickhouseMCP server): for every title/region/device/hour combination, it computes that combination's own baseline average and standard deviation, then ranks every combination by z-score. It has no prior knowledge of which row will come back — it computes fresh every run. - Diagnosis Agent — feeds that real result into Gemini, which proposes the most likely root cause category with real reasoning, not a template response.
- Action Agent — files a real GitHub Issue with the anomaly data and diagnosis in a dedicated content-ops repo. No human in the loop until triage.
How we built it
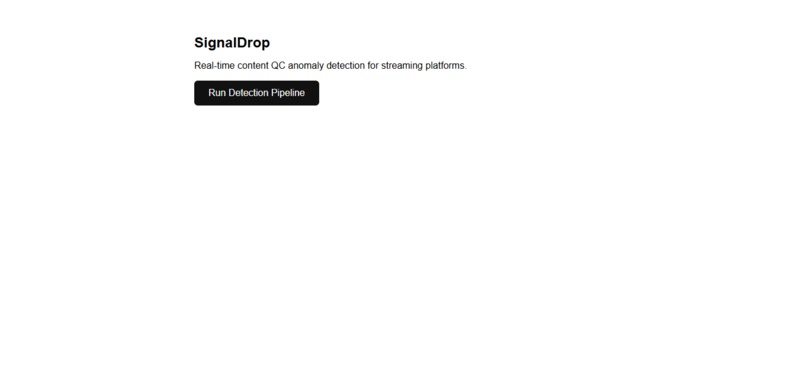
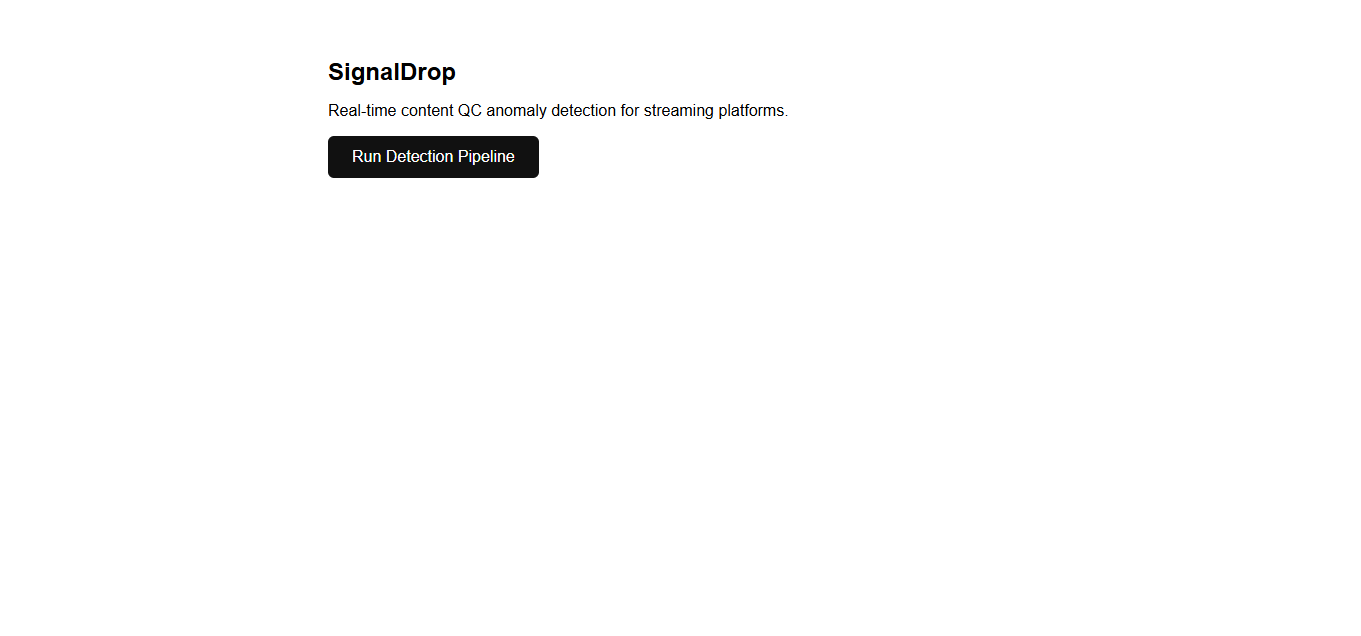
FastAPI backend orchestrating all three agents, deployed on Google Cloud Run. The frontend is a minimal single-page dashboard — click one button, watch all three agents run live, in sequence, each one's real output feeding the next one's real input.
The underlying telemetry is synthetic — no real streaming platform would hand a hackathon entrant production data — and that's disclosed directly in the README, not hidden. Two anomalies were deliberately engineered into it: an obvious one (a sharp buffer-stall spike) and a subtler one (a drop-off pattern tied to a mismatched subtitle language, which requires the detection logic to actually correlate two columns, not just count one).
What's not staged is the detection itself. I verified this directly by increasing the injected anomaly's session count partway through development (60 → 180 sessions) and watching the computed z-score genuinely change (2.0 → 3.0) between two separate runs, computed fresh from ClickHouse both times. A hardcoded answer can't do that.
Challenges we ran into
Getting this actually deployed, not just working locally, turned into a real debugging session with three distinct, unrelated root causes:
- A missing package.
mcp-clickhouseworked locally because I'd installed it directly into that environment weeks earlier — it was never actually inrequirements.txt. Cloud Run's fresh build caught this immediately; the fix was one line. - IAM permissions. The Cloud Run service's own identity didn't have the same access my personal login had — first for Cloud Build, then separately for calling Gemini via Vertex AI. Shared-project IAM is genuinely granular; each capability needs its own explicit grant.
- Routing around a blocked dependency entirely. Rather than keep waiting on a third IAM grant, I switched the Gemini calls from Vertex AI's project-based auth to a Google AI Studio API key — same accepted
google-genaiSDK, a completely different and much simpler auth model, with no project-level permissions needed at all.
Each of these was a real, different bug, diagnosed from actual Cloud Run logs each time rather than guessed at — the fix for the second issue looked plausible for the third failure too, and I was wrong about that until I re-read the traceback.
Accomplishments that we're proud of
- Every agent is independently verifiable, not just the end-to-end demo. Before wiring anything together, I tested the ClickHouse query alone, the Gemini call alone, and the GitHub write alone — each with its own real evidence — so when the full pipeline worked, I already knew exactly which piece to trust.
- Proving the detection isn't hardcoded, not just asserting it. Changing the injected anomaly's size mid-development and watching the z-score genuinely recompute is the kind of test that actually distinguishes a real statistical query from a staged demo.
- Diagnosing three unrelated production bugs from real logs, not guesses. A missing package, then two separate IAM permission gaps — each one looked at first like it might be the same root cause as the last, and each time I went back to the actual traceback instead of assuming.
- Removing a whole dependency instead of just working around it once. Switching to a fundamentally simpler auth model that doesn't need project-level permissions at all is a decision that outlasts this one hackathon.
- Picking the less-crowded track deliberately. ClickHouse over the more obvious Parallel (web search) track, on the reasoning that narrower technical fit beats a bigger prize pool with more competition for the same slot.
What we learned
- How much of "shipping" an AI pipeline is actually infrastructure and permissions work, not model or prompt work — three of my real bugs were packaging and IAM issues, zero were about the AI agents themselves.
- The value of testing a system's sensitivity to its own inputs, not just its output on one fixed input — that's what actually proves a detection query is computing something real, not returning a hardcoded answer.
- Cloud Run's subprocess and service-identity behavior differs meaningfully from an already-authenticated local dev environment in ways that don't show up until you actually deploy.
- When a permission dependency is genuinely blocking progress, it's often faster and more durable to route around it with a simpler architecture than to keep escalating the same request.
Built With
- clickhouse
- clickhouse-cloud
- docker
- fastapi
- gemini
- github-api
- google-cloud
- google-cloud-run
- google-genai
- mcp
- python
- uvicorn

Log in or sign up for Devpost to join the conversation.