-
-
demo1
-
hero
-
demo2
SignalDesk AI — Devpost Submission
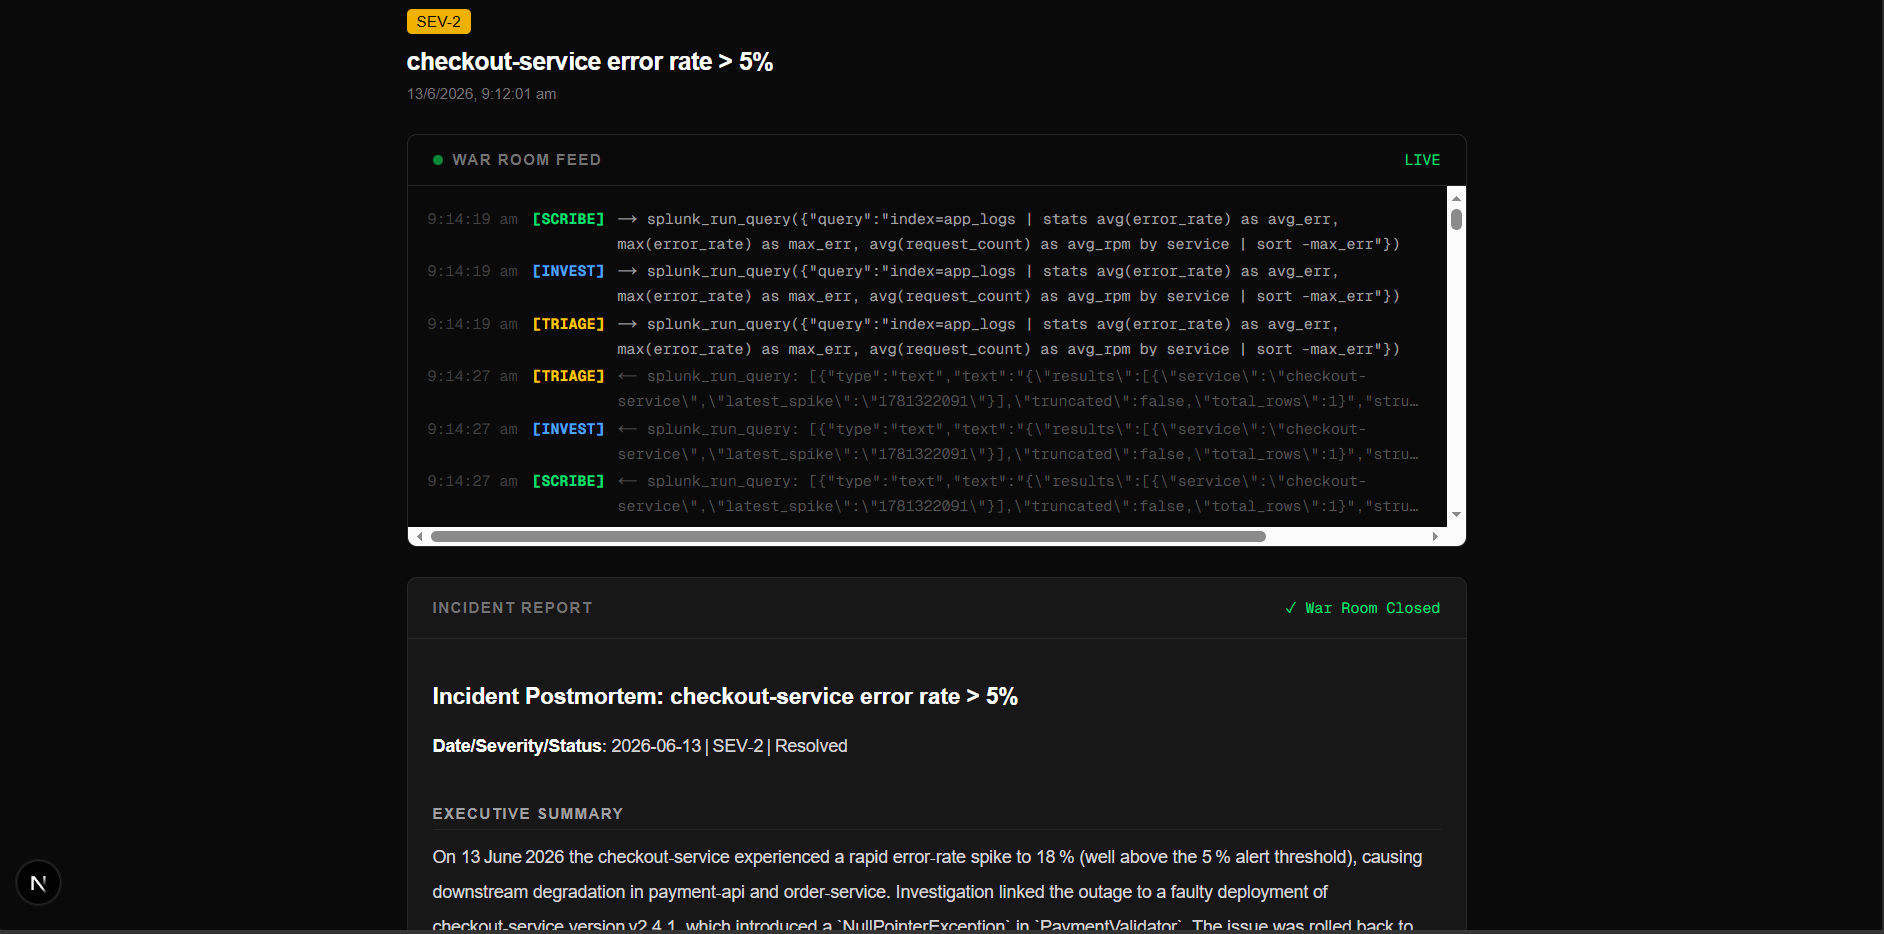
When a Splunk alert fires, four AI agents open an incident "war room": one triages, one investigates, one challenges the answer, and one writes the report. You watch them work live.
The Problem
An alert fires at 2 AM. Something is broken, users are affected, and the on-call engineer has to figure out what happened — from scratch.
Every time, it's the same routine:
- Open Splunk and run error queries
- Check what was recently deployed
- Come up with a guess at the cause
- Run more queries to prove or disprove it
- Ask a teammate to double-check
- Write a postmortem while exhausted
This takes 15–30 minutes of stressful, manual work — and it happens every single time, even for the same kind of incident you've seen before.
The steps never really change. And anything that repeats the same way every time can be automated.
What It Does
SignalDesk AI turns a Splunk alert into a fully automatic investigation. The moment the alert fires, four AI agents run one after another:
- Triage Agent — Checks Splunk to see which services are failing and how badly, then rates the severity (SEV-1, SEV-2, or SEV-3).
- Investigation Agent — Comes up with 2–3 possible causes (bad deploy? traffic spike? a dependency went down?), runs Splunk queries to test each one, and picks the most likely cause with a confidence score.
- Skeptic Agent — Acts like a second opinion. It runs queries that try to prove the answer wrong, then adjusts the confidence up or down. This stops the system from blindly trusting its first guess.
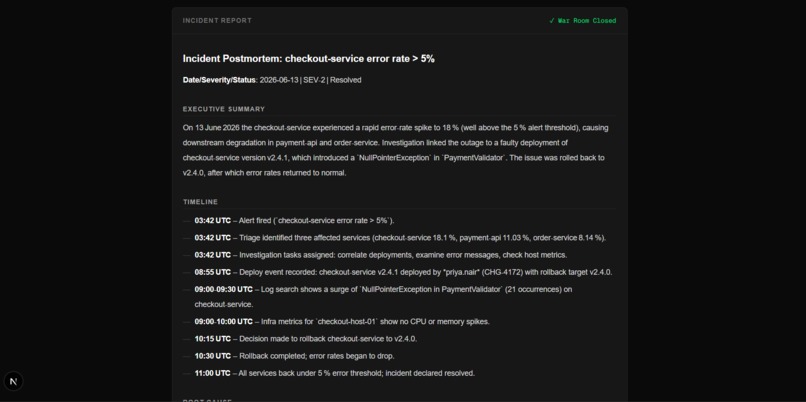
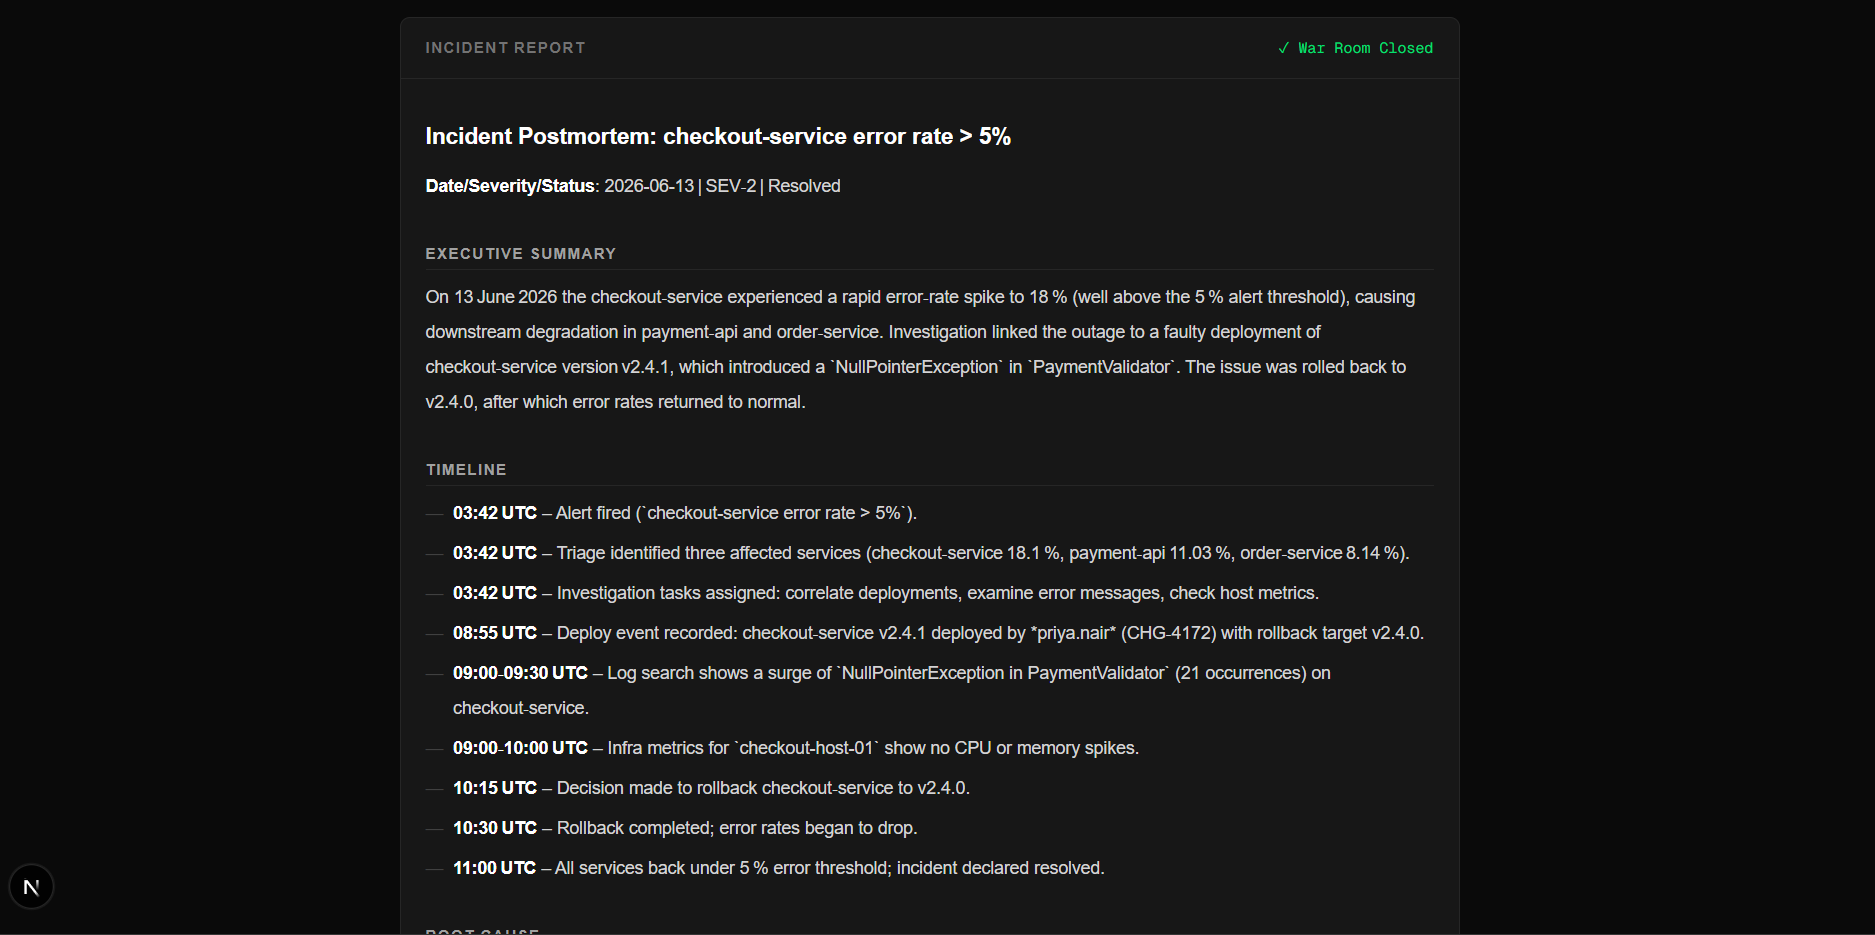
- Scribe Agent — Writes the final postmortem: summary, timeline, root cause, evidence, affected services, action items, and lessons learned.
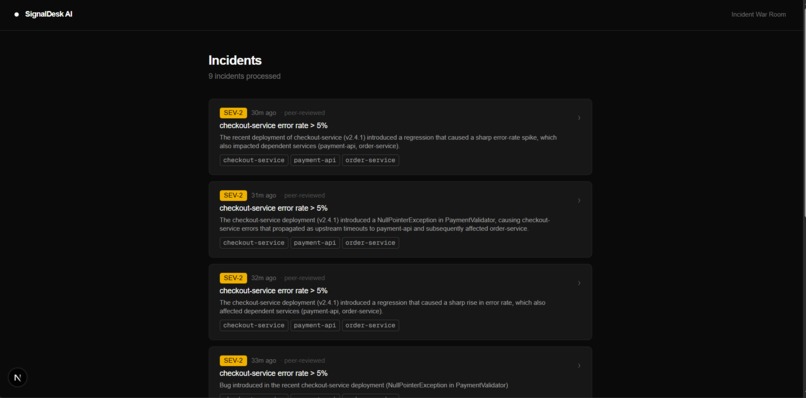
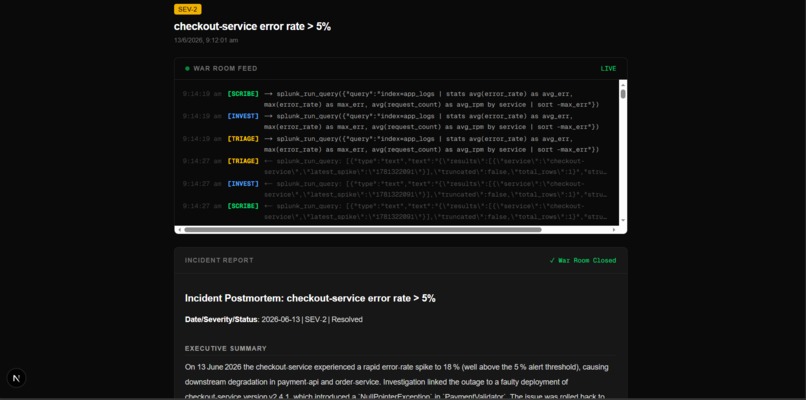
Everything streams to a live dashboard as it happens — you see each query the agents run and each answer they get, in real time. When they finish, the full report is waiting for you.
Result: what used to take ~30 minutes of manual work now happens automatically in ~3 minutes.
How I Built It
The agents. Four AI agents built with LangChain, each with its own job and its own instructions. They run in order, and each one reads the previous agent's notes before starting — so the picture of the incident builds up step by step.
Connecting to Splunk. Every agent talks to the Splunk MCP Server and uses its splunk_run_query tool to run real searches against live Splunk data. The agent decides what to search and when. Nothing is faked or pre-written — every conclusion is checked against actual data in Splunk.
The live feed. Behind the scenes, every query an agent runs (and every result it gets) is captured and pushed to the dashboard over a WebSocket connection, so you can watch the investigation unfold instead of staring at a spinner.
Saving the work. Each incident gets its own folder. The status is saved the instant the alert arrives, so the dashboard shows the incident as "live" right away, and each agent saves its findings as a file for the next agent to read.
Avoiding duplicates. Splunk can fire the same alert every minute. So before starting, the system checks if an investigation is already running and skips starting a second one.
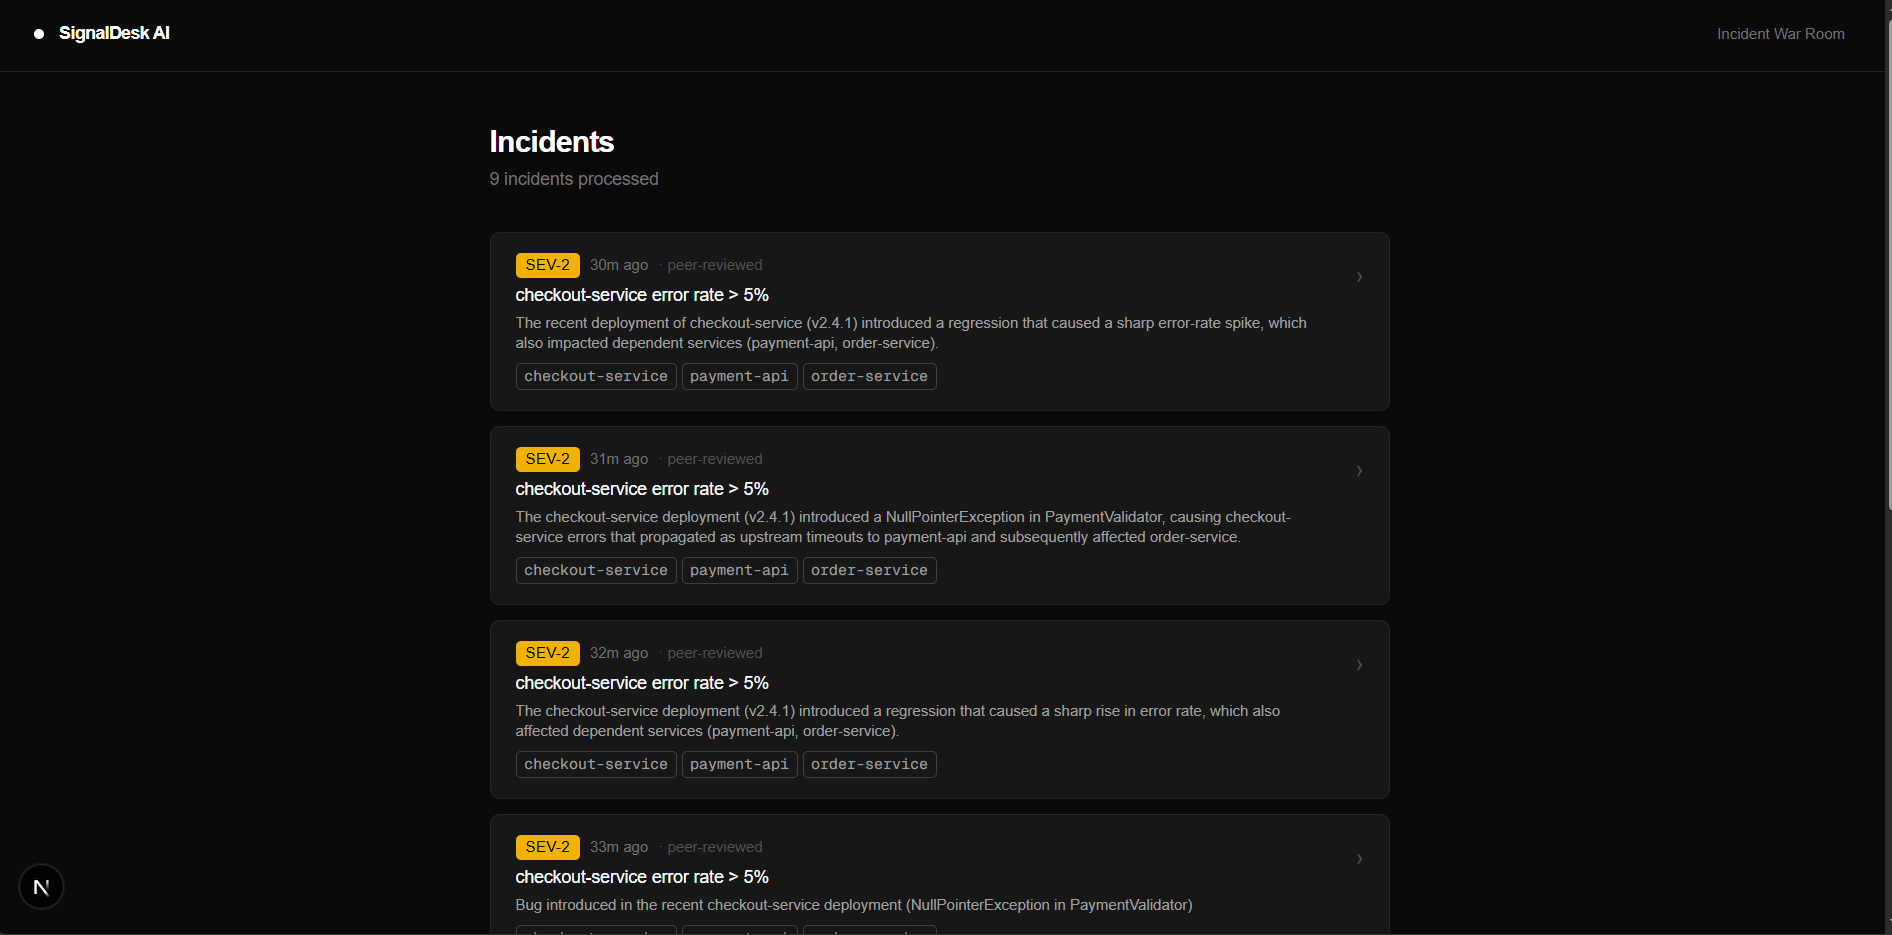
The dashboard. Built with Next.js. It shows a list of incidents and, for each one, a live progress tracker (Triage → Investigation → Skeptic → Scribe) plus the final report.
What I Learned
- Splitting the work across focused agents beats one giant AI prompt. Giving each agent one clear job produces more reliable, easier-to-follow results than asking a single AI to do everything at once.
- The Skeptic agent makes a real difference. Without something actively trying to disprove the answer, the first guess almost always becomes the final answer — even when the evidence is weak. Forcing a challenge raises the quality a lot.
- Showing the incident as "live" immediately matters. Saving the status the moment the alert arrives is what makes the dashboard feel real-time instead of laggy.
- The Splunk MCP Server made live-data access easy. Connecting an AI agent to real operational data normally takes a custom integration. With MCP, the agent just calls a tool and Splunk does the rest.
- Small technical gotchas cost real time — e.g. each agent needed its own fresh copy of the Splunk tools, otherwise their activity got mixed together in the live feed.
What's Next
- Slack / PagerDuty — automatically post the finished postmortem to the incident channel.
- Learn from past incidents — match new incidents against old ones, and if the cause looks familiar, surface the fix that worked last time.
- Auto-rollback — if the Skeptic confirms a bad deploy with high confidence, trigger the rollback automatically.
- Multi-team support — route each team's alerts to its own separate war room.
- Splunk hosted models — the AI model lives behind a single file (
backend/src/lib/model.ts), so switching to Splunk's own hosted models is a one-line change. It's built to support this — I just couldn't get hosted-model access provisioned during the hackathon despite repeated requests. Once granted, this would let the whole thing run on-premise with no outside AI service at all.
Built With
- bun
- express.js
- gpt-oss-120b
- langchain
- next.js-15
- openrouter
- splunk-mcp-server
- tailwind-css
- typescript
- websocket

Log in or sign up for Devpost to join the conversation.